An Updating d3.js Donut in React
by Joe Hsu (@jhsu)
React
var SleepEfficiency = React.createClass({
  ...
});
var SleepEfficiency = React.createClass({
...
});React.render(
<SleepEfficiency />,
document.body
);SleepEfficency Donut Chart
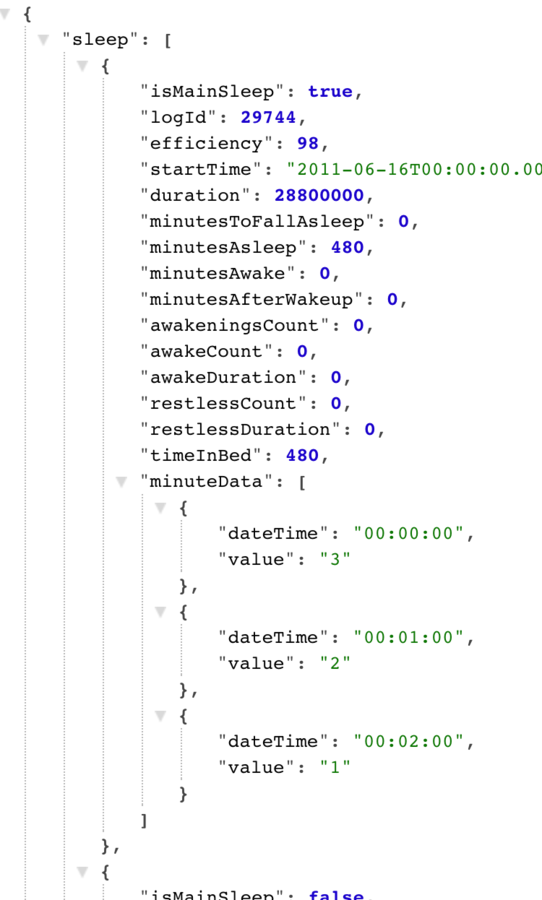
Fetch sleep data and calculate the average sleep efficiency percent and display it as a donut chart.
fitbit sleep data
SleepEfficiency
avgEfficiency
Fetch sleep data and calculate average sleep efficiency.
SleepEfficiency
avgEfficiency
DonutGraph
setup of d3 chart and inserting into dom
d3.arc
var arc = this.arc = d3.svg.arc()
    .innerRadius(radius - 100)
    .outerRadius(radius - 50)
    .startAngle(0);
var svg = this.svg = d3.select(el)
.append('svg')
.attr('width', width)
.attr('height', height)
.append('g')
.attr('class', 'd3-points')
.attr("transform", "translate(" + width / 2 + "," + height / 2 + ")")
;
Center arc origin

When working with React...
- separate updating of d3 chart
- be careful of where you bind state
A D3.js Donut and React
By jhsu


