working with web maps
geocoding and web mapping with APIs, data and code
Kim Pham
@tolloid
manipulate data programmatically to geocode placenames
convert tabular data into a meaningful geographic data structure
understand the basic concepts of web mapping to programmatically create a web map
objectives
repo: https://github.com/kimpham54/dpi-mappingAPI
slides: kimpham54.github.io/dpi-mappingAPI
setup
getting the data
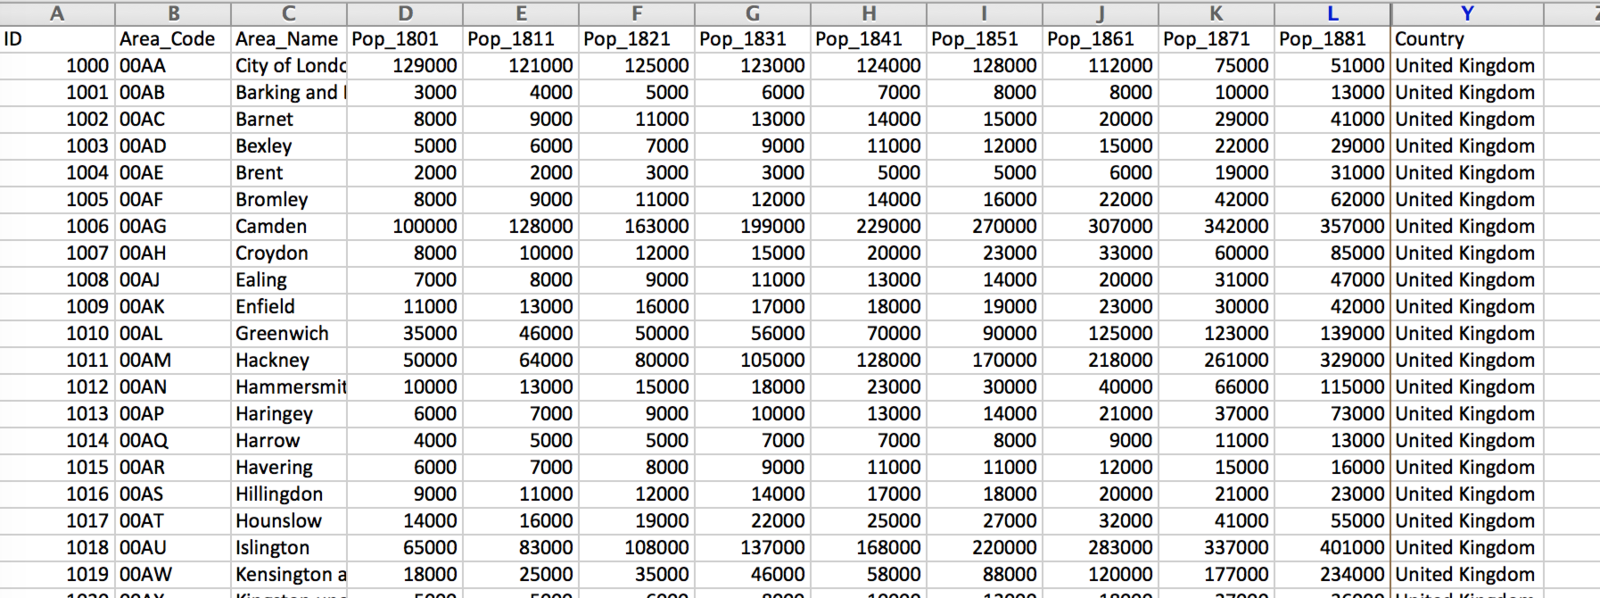
CSV: Estimates of London's population between 1801 and 2001 derived from historic Census data
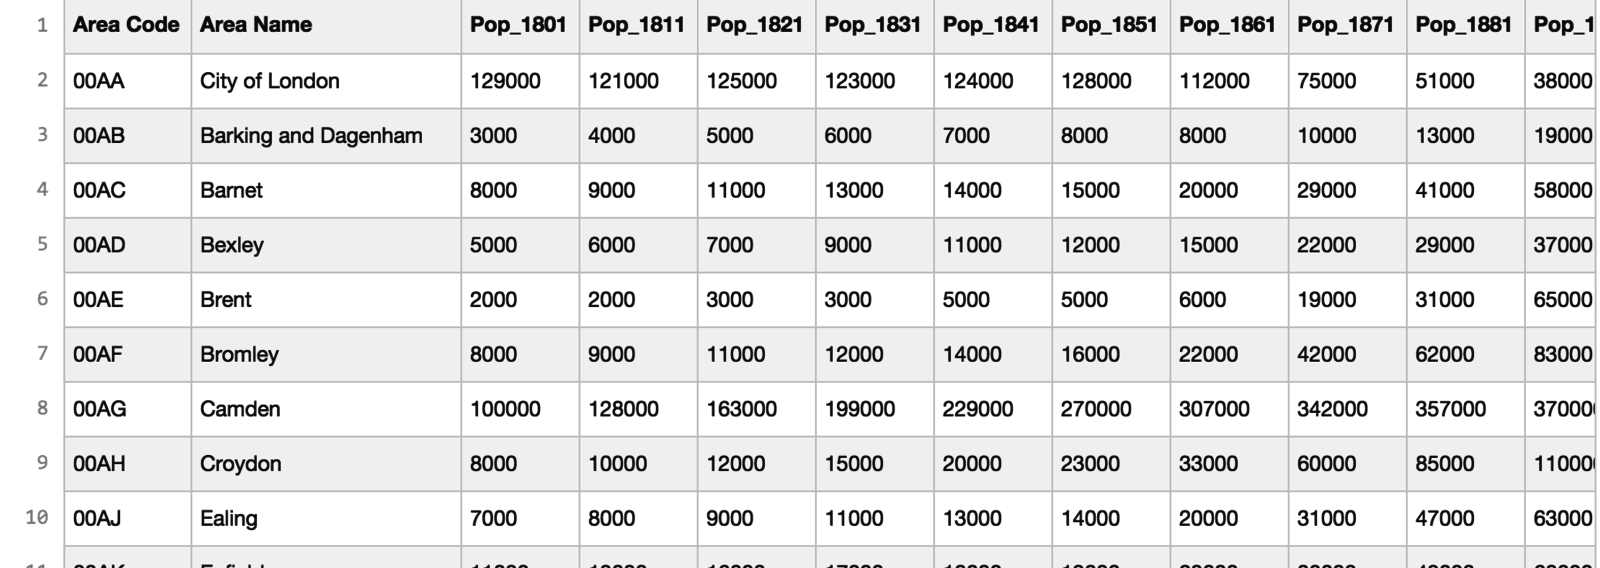
http://data.london.gov.uk/dataset/historic-census-population
sometimes the hardest part is just knowing what to do with the data
i can haz data now what
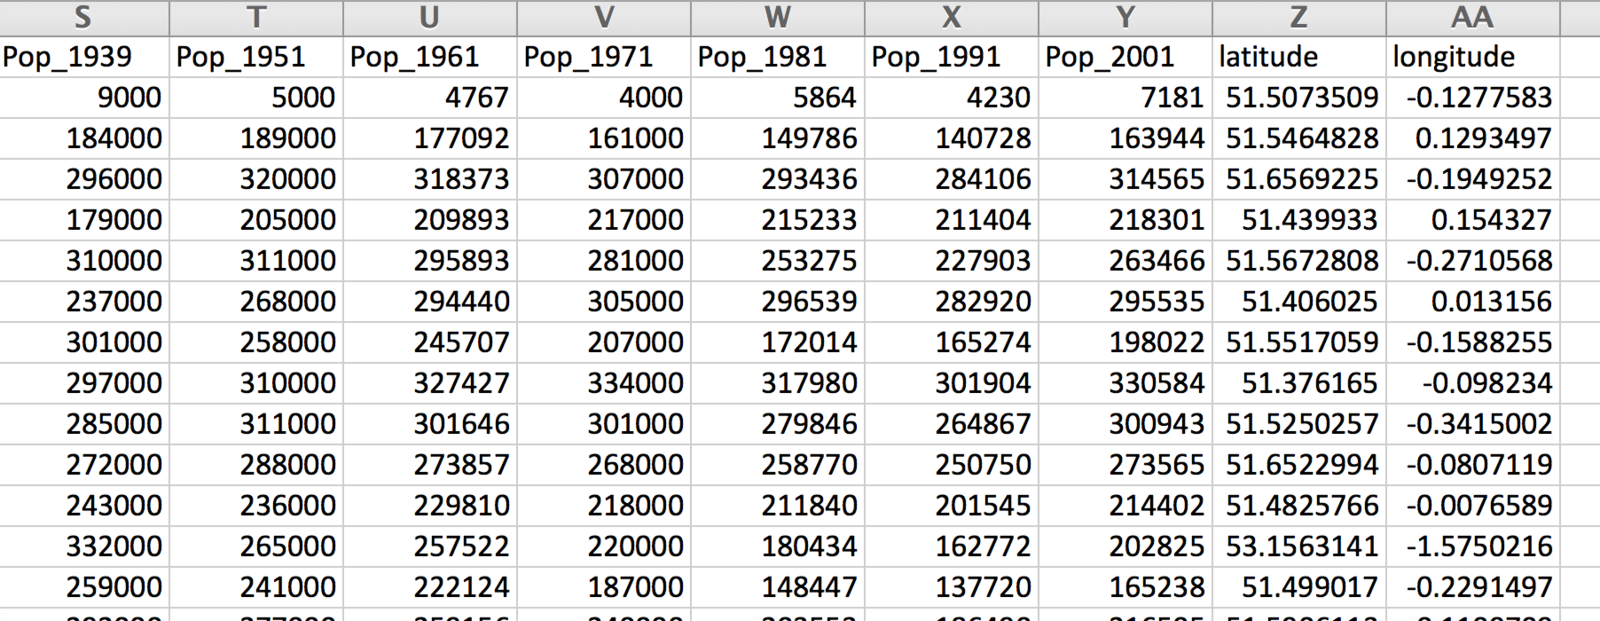
what do i want to achieve? make web map
what do web maps need? coordinates
you can do a coordinate lookup (geocoding): google maps
but I have > 1 place!!!! (reliable answer: program)
to program or not to program? sometimes you have no choice
ask yourself
code to geocode placenames
import os, csv, sys, geopy
import pandas
from geopy.geocoders import Nominatim, GoogleV3
# geopy 1.10.0, pandas 0.16.2

def main():
	io = pandas.read_csv('onerow3.csv', index_col=False, header=0, sep=",")
	name = io['Area_Name']
	geolocator = Nominatim()
	# geolocator = GoogleV3()
	io['latitude'] = io['Area_Name'].apply(geolocator.geocode).apply(lambda x: (x.latitude))
	io['longitude'] = io['Area_Name'].apply(geolocator.geocode).apply(lambda x: (x.longitude))
	io.to_csv('geocoding-output.csv')

if __name__ == '__main__':
  main()
modular python
def main():


if __name__ == '__main__':
  main()
import os, csv, sys, geopy
import pandas
from geopy.geocoders import Nominatim, GoogleV3import libraries to use with python (make sure they're installed!)
io = pandas.read_csv('onerow3.csv', index_col=False, header=0, sep=",")pandas reads the input CSV
        geolocator = Nominatim()
	# geolocator = GoogleV3()
setting your geolocator API with geopy
    io['latitude'] = io['Area_Name'].apply(geolocator.geocode).apply(lambda x: (x.latitude))
    io['longitude'] = io['Area_Name'].apply(geolocator.geocode).apply(lambda x: (x.longitude))
create and populate 2 new columns with geopy
io.to_csv('geocoding-output.csv')write to an output file with pandas
$$$
Nominatim()
-
OpenStreetMap
-
single-threaded applications
-
user-input
-
limit 1 request/s or timeout
-
33.5s
-
accurate?
GoogleV3()
-
Google
-
can upgrade for better performance
-
static (geocoding service not in geopy)
-
5 requests/s, 2500/day
-
11.6s
-
accurate? perhaps the winner
Other geocoders: https://github.com/geopy/geopy
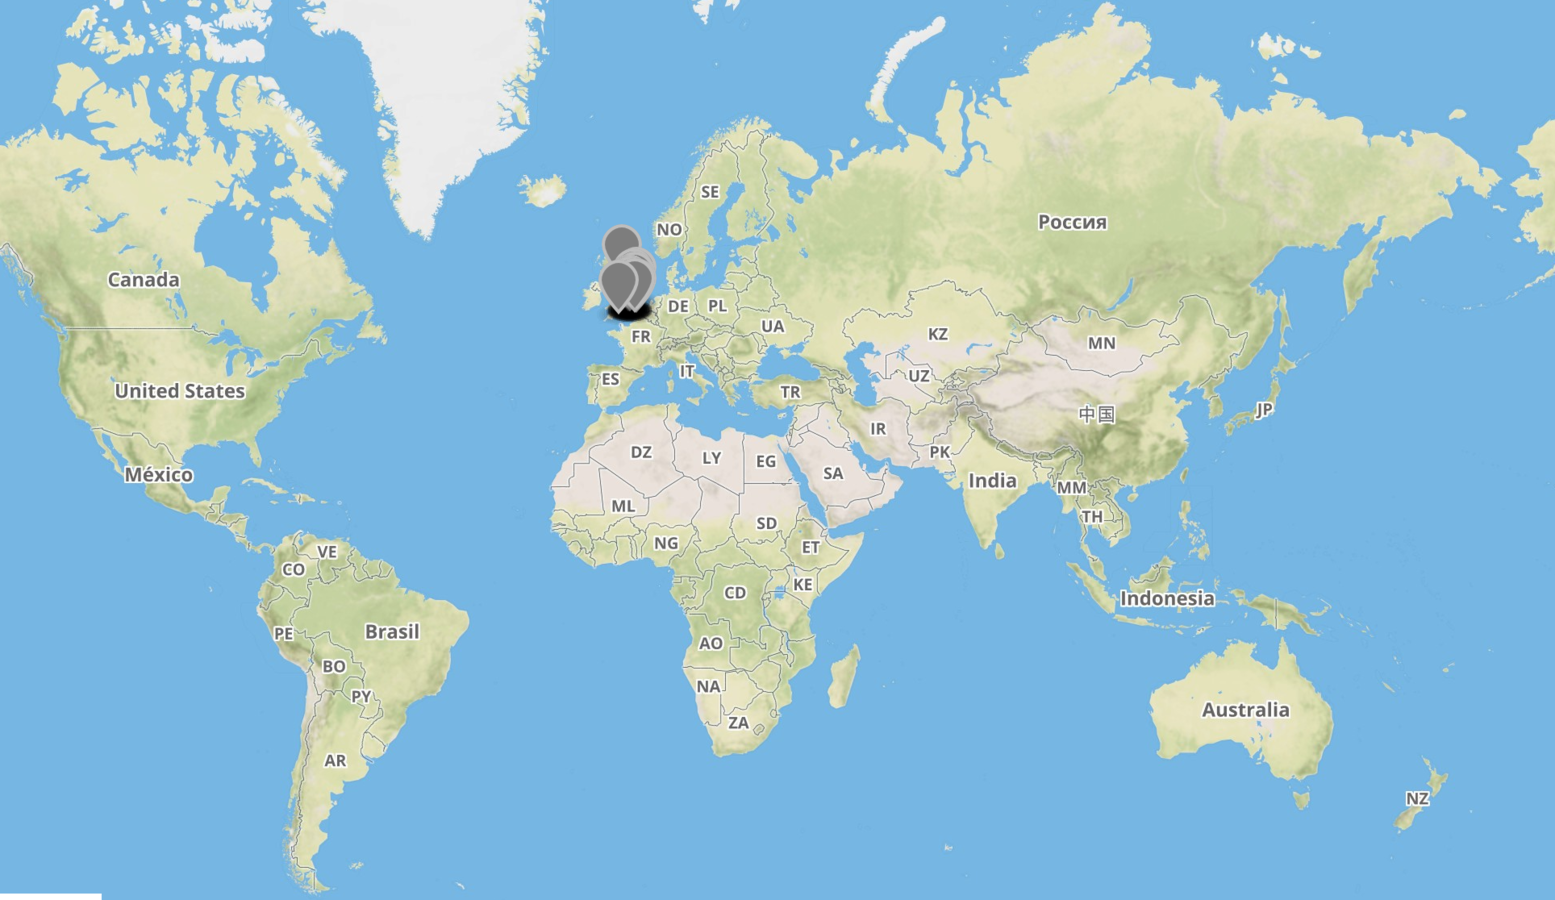
accurate? nominatim
accurate? googlev3
you're not stuck with these reults. coding is great because you can tweak it to make it better!
include a little helper
	io['helper'] = io['Area_Name'].map(str) + " " + io['Country']
	io['latitude'] = io['helper'].apply(geolocator.geocode).apply(lambda x: (x.latitude))
	io['longitude'] = io['helper'].apply(geolocator.geocode).apply(lambda x: (x.longitude))
new column with combined query to geocode with geopy
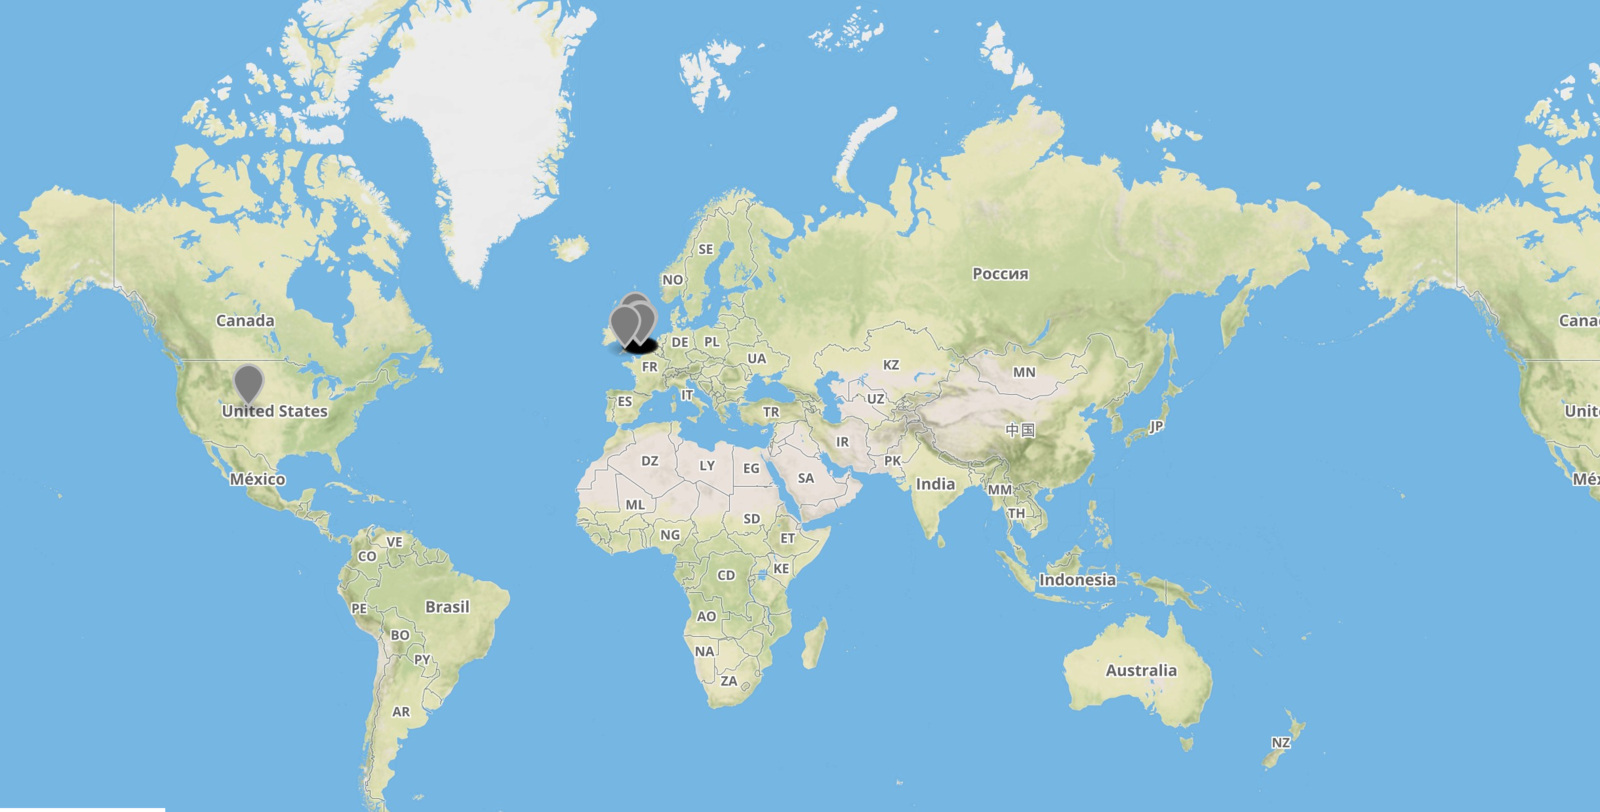
accurate? more accurate! googlev3
googlev3
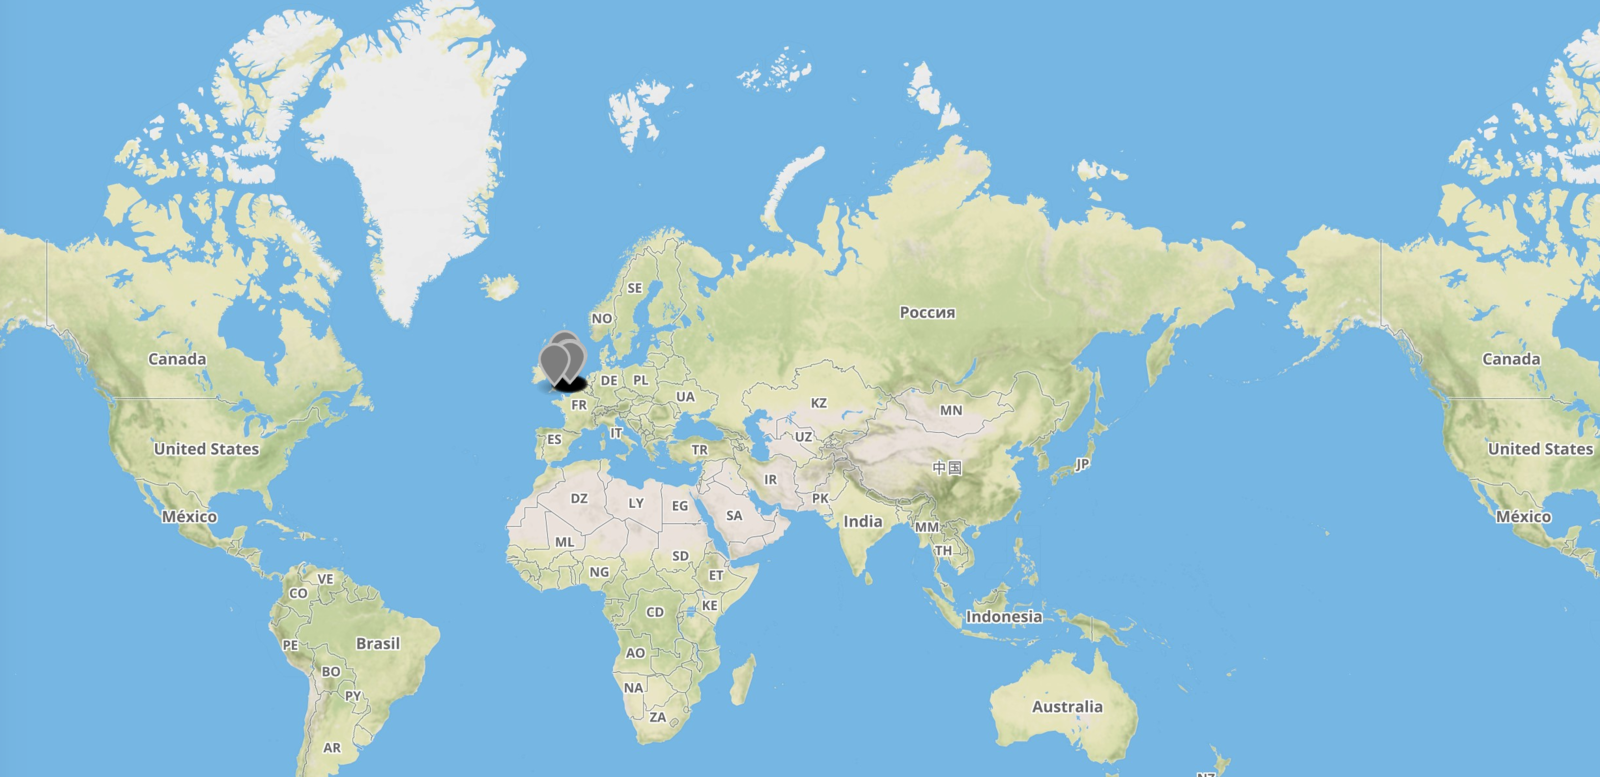
similarly, nominatim
nominatim
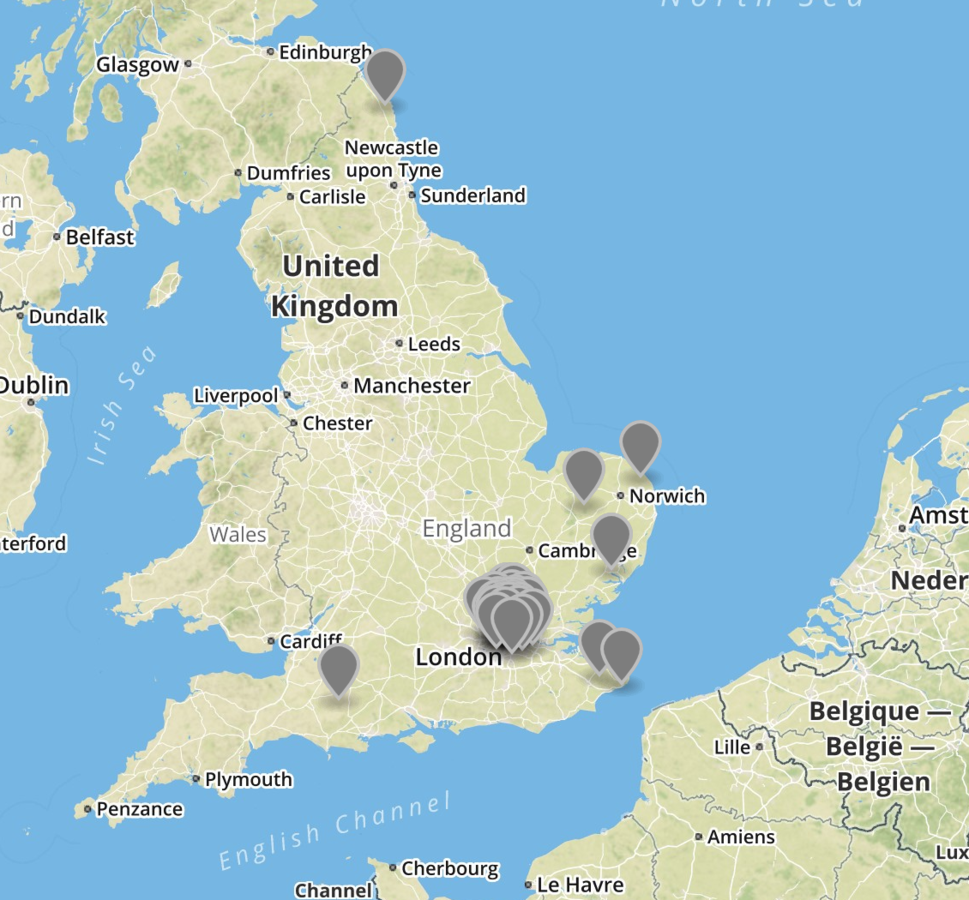
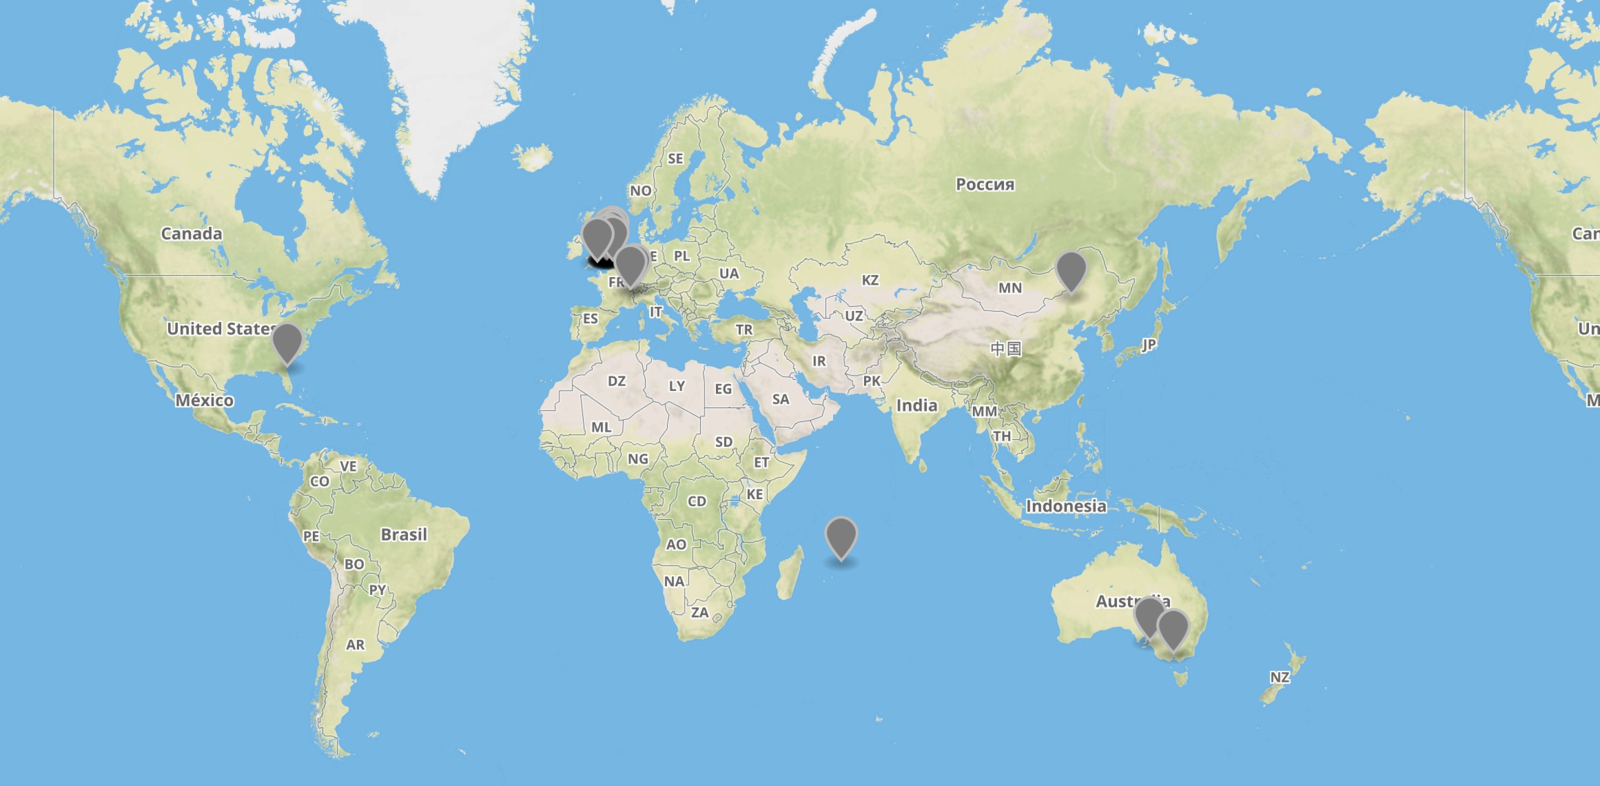
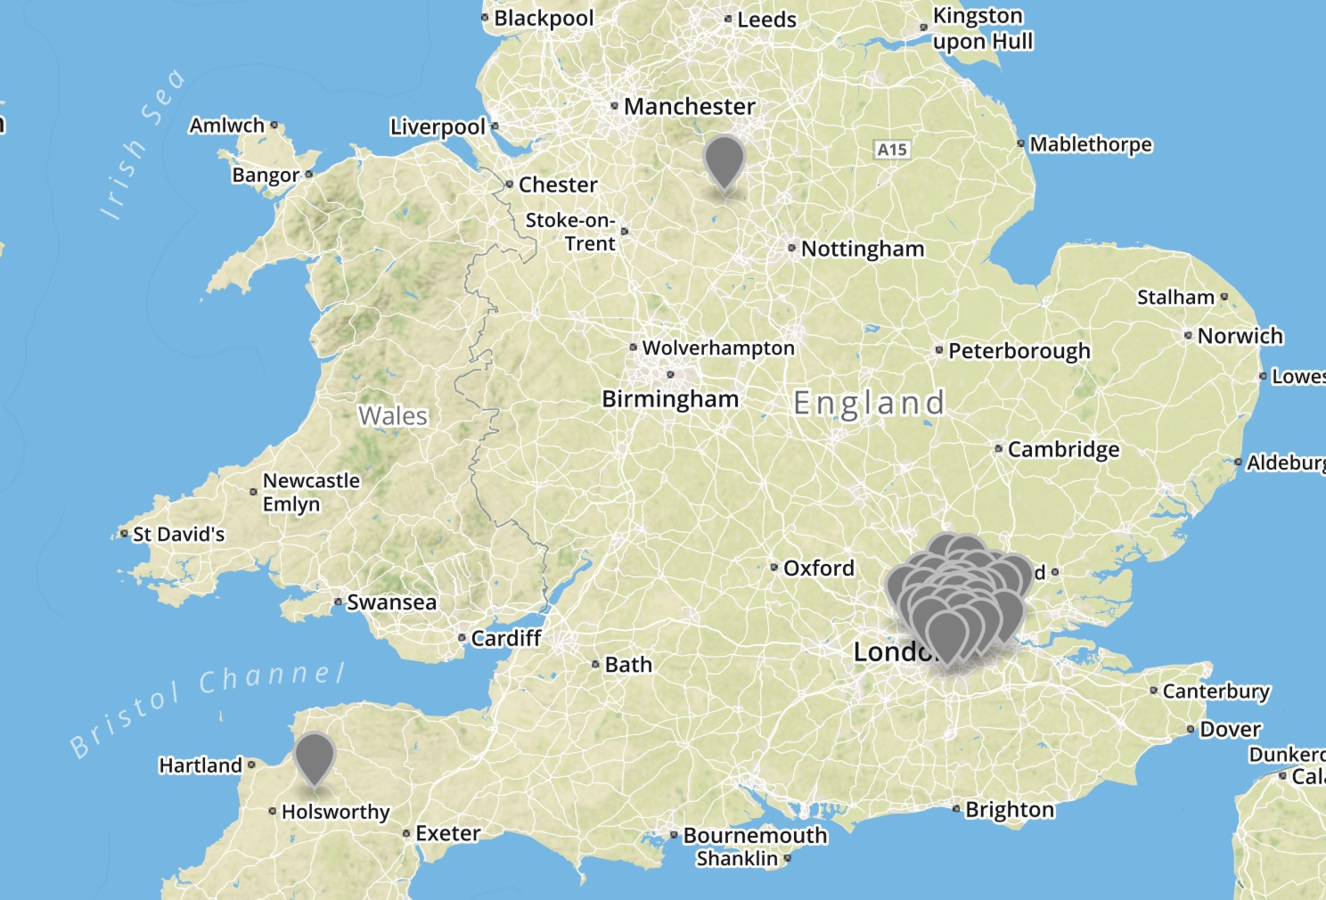
but, still not perfect
historical locations / placenames and boundaries (political and natural) change over time
the best guess - sometimes isn't the best (you might want the outlier!)
i can fix the mistakes myself...for now (but what if there's 200 000 points)
takeaways
human intervention is sometimes necessary...or iterate to improve your program
the more relevant information you provide, the better
here's a suggestion: use 'London, United Kingdom' rather than just 'United Kingdom'
GeoJSON is JSON, JSON is not GeoJSON
open format - meant to be human-readable
designed with the web in mind
can represent geometry (~ GIS): points, lines, polygons, more
can represent feature (geometry + additional properties)
making GeoJSON
UI tools
http://geojson.io
http://www.convertcsv.com/csv-to-geojson.htm
Programmatically
ogr2ogr with gdal
csv2geojson tools
geojson.io
From Paper Maps to the Web: A DIY Digital Maps Primer (Mauricio Giraldo Arteaga, NYPL Labs 2015)
the right kind of data
building a web map
with Leaflet
one. start an html document
two. link to external leaflet JS files
three. link to your data
four. create css style
five. adding a div container for your map
six. create javascript
seven. closing everything (your tags)
a web map is made up of tiles
you can set the map layout (viewport)
you can add layers
you can add style, animations, plugins
DATA
change the viewport to
[0.0,-10.0], 2
exercise one
add the 1981 population property to each marker popup
exercise two
change the data source to stations.geojson
exercise three
change the viewport
change popup properties
change declaration in the L.geoJson layer
don't forget
add a mapbox tileset/basemap layer
exercise four
mapbox map ID
mapbox API access token
don't forget
add your own custom icon
exercise five
Kim Pham
kim.pham@utoronto.ca
@tolloid
deck
By kim ph