Citizen Candidate Model
Lecture 2, Political Economics I
OSIPP, Osaka University
13 October, 2017
Masa Kudamatsu
Did you come up with
a research question
for your term paper?
If yes, is your research question
original, interesting, and feasible?
Motivations for today
Does the Median Voter Theorem still hold
if candidates cannot commit to their electoral platform?
cf. Lecture 1
Osborne and Slivinski (1996) and Besley and Coate (1997)
develop a theoretical framework
now widely known as the citizen-candidate model
Basic Model
We follow Section 5.3 of Persson and Tabellini (2000)
Players
A continuum of citizens, each indexed by
i
NOTE: The model endogenously derives who becomes a candidate
Citizens' actions (Timing of Events)
1
2
3
Each citizen decides whether to become a candidate
Each citizen decides which candidate to vote for
Entry into politics
Election
Inauguration of a new government
The candidate winning the majority of votes selects a policy
If no one becomes a candidate,
the default policy will be implemented
\overline{g}
g
Citizen i's Preference
For the ease of comparison to the Downsian model
we assume a single-peaked preference (cf. Lecture 1)
Citizen i's payoff function as one-dimensional policy
W^i(g)
Denote i's ideal policy by
g^i (=\arg\max_g W^i(g))
Citizen i's Preference (cont.)
Becoming a candidate incurs a cost of
\varepsilon
Electoral campaign expenditure
Opportunity cost (i.e. private sector wage)
Analysis
Equilibrium concept
The model is a dynamic game with complete information
Use the Subgame Perfect Nash Equilibrium as the solution concept.
Thus, we proceed with backward induction
Backward induction
1
2
3
Each citizen decides whether to become a candidate
Each citizen decides which candidate to vote for
Entry into politics
Election
Inauguration of a new government
The candidate winning the majority of votes selects a policy
If no one becomes a candidate,
the default policy will be implemented
\overline{g}
Winning candidate's optimization
Denote the winning candidate by
P
She solves
\max_g W^P(g)
So she chooses her own ideal policy
g^P
Even if we allow candidates to propose a policy before election
Winning candidate's optimization (cont.)
Choose her own ideal policy
g^P
no citizen believes it to be chosen once they are elected
Backward induction
1
2
3
Each citizen decides whether to become a candidate
Each citizen decides which candidate to vote for
Entry into politics
Election
Inauguration of a new government
The candidate winning the majority of votes selects a policy
If no one becomes a candidate,
the default policy will be implemented
\overline{g}
Optimization by citizens as voters
Single-peaked preference
Vote for the candidate whose ideal policy is the closest to their own
If there are at most two candidates...
Winning candidate:
the one preferred by the median voter (cf. Lecture 1)
We focus on this case: see Propositions 8 and 9 of Besley and Coate (1997) for the possibility of three-candidate equilibria
Optimization by citizens as voters (cont.)
We skip the case where there are three or more candidates
Propositions 8 and 9 of Besley and Coate (1997) show
non-existence of three-candidate equilibrium
under mild additional assumptions
Backward induction
1
2
3
Each citizen decides whether to become a candidate
Each citizen decides which candidate to vote for
Entry into politics
Election
Inauguration of a new government
The candidate winning the majority of votes selects a policy
If no one becomes a candidate,
the default policy will be implemented
\overline{g}
Equilibrium conditions for entry into politics
1
Those running for office prefer to do so given that the other candidate is running
2
No other citizen wants to run for office
One-candidate equilibrium
Suppose a median citizen becomes a sole candidate
Does the median citizen get better-off by running for office?
W^m(g^m) - \varepsilon \geq W^m(\overline{g})
Yes, as long as
Plausible if the default policy is a government shutdown
One-candidate equilibrium
Suppose a median citizen becomes a sole candidate
Do other citizens prefer becoming a candidate as well?
No. Other citizens cannot win the election against the median citizen
Other median citizens won't become a candidate because
The policy will be the median citizen's ideal one anyway
Becoming a candidate is costly
(\frac{1}{2}+\frac{1}{2})W^m(g^m) - \varepsilon < W^m(g^m)
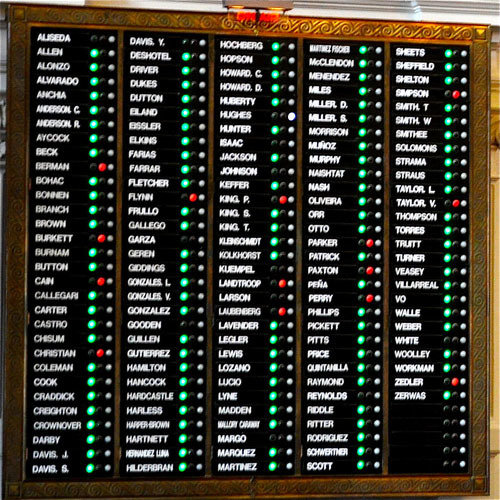
Uncontested elections in reality
Some constituencies for US state legislature, especially in the South

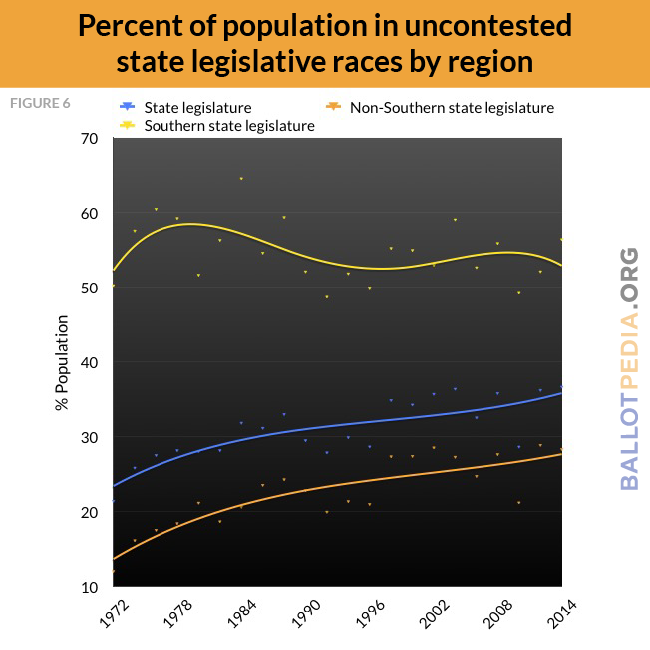
Source: Ballotpedia.org
So far, the model prediction is the same as the Median Voter Theorem
But the citizen-candidate model has other equilibria with policy divergence
Two-candidate equilibria
L prefers running for office if
p_L W^L(g^L)+(1-p_L)W^L(g^R)-\varepsilon\geq W^L(g^R)
Suppose two citizens, , run for office
L,R
p_L W^R(g^L)+(1-p_L)W^R(g^R)-\varepsilon\geq W^R(g^L)
p_L
denote the probability that L wins the election against R
R prefers running for office if
Let
Two-candidate equilibria (cont.)
Rearranging the terms yields:
p_L [W^L(g^L)-W^L(g^R)] \geq \varepsilon
Suppose two citizens, , run for office
L,R
(1-p_L) [W^R(g^R)-W^R(g^L)]\geq \varepsilon
where
p_L
is the probability that L wins the election against R
Two-candidate equilibria (cont.)
p_L [W^L(g^L)-W^L(g^R)] \geq \varepsilon
(1-p_L) [W^R(g^R)-W^R(g^L)]\geq \varepsilon
0 < p_L < 1
For these two conditions to hold,
Two-candidate equilibria (cont.)
W^m(g^L) = W^m(g^R)
0 < p_L < 1
For to be the case
the median citizen should be indifferent between L and R

W^m(g)
g
g^m
g^L
g^R
W^m(g^L) = W^m(g^R)
Then we have
p_L=1/2
Summarizing so far, citizens R and L run for office if
Two-candidate equilibria (cont.)
W^m(g^L) = W^m(g^R)
\frac{1}{2} [W^L(g^L)-W^L(g^R)] \geq \varepsilon
\frac{1}{2}[W^R(g^R)-W^R(g^L)]\geq \varepsilon
Median citizens are indifference: so each wins with prob. 1/2
Citizen L prefers running for office to letting R win
Citizen R prefers running for office to letting L win
1
2
3
Why not the third citizen runs for office?
Even if it's the median citizen who runs as the third candidate...
No citizens with change their vote for the median
g^i > g^m
Otherwise, their favorite candidate will lose for sure
\frac{1}{2}[W^i(g^L)+W^i(g^R)] \geq W^i(g^R)
The same is true for those with
g^i < g^m
The median citizen cannot win: she won't run
Strategic voting vs sincere voting
With three candidates
voters no longer vote for the policy closest to their ideal
We call such voting behavior as "strategic voting"
as oppose to "sincere voting" (vote for the policy closest to ideal)
Osborne and Slivinski (1996) propose the sincere voting version of the citizen candidate model
Strategic voting vs sincere voting (cont.)
Empirically, difficult to tell whether voters are strategic or sincere
Strategic voting may imply voting in a sincere way
Using structural estimation, Kawai and Watanabe (2013 AER) show:
63-85% of voters are strategic in Japanese general elections
while only 1-4% vote in a non-sincere way
With strategic voting, the following three conditions are sufficient
Two-candidate equilibria (cont.)
W^m(g^L) = W^m(g^R)
\frac{1}{2} [W^L(g^L)-W^L(g^R)] \geq \varepsilon
\frac{1}{2}[W^R(g^R)-W^R(g^L)]\geq \varepsilon
Median citizens are indifference: so each wins with prob. 1/2
Citizen L prefers running for office to letting R win
Citizen R prefers running for office to letting L win
1
2
3
Multiplicity of two-candidate equilibria
W^m(g^L) = W^m(g^R)
\frac{1}{2} [W^L(g^L)-W^L(g^R)] \geq \varepsilon
\frac{1}{2}[W^R(g^R)-W^R(g^L)]\geq \varepsilon
Median citizens are indifference: so each wins with prob. 1/2
Citizen L prefers running for office to letting R win
Citizen R prefers running for office to letting L win
1
2
3
Many pairs of citizens L and R satisfy the condition #1
W^m(g)
g
g^m
g^L
g^R
Multiple two-candidate equilibria
W^m(g^L) = W^m(g^R)
\frac{1}{2} [W^L(g^L)-W^L(g^R)] \geq \varepsilon
\frac{1}{2}[W^R(g^R)-W^R(g^L)]\geq \varepsilon
Median citizens are indifference: so each wins with prob. 1/2
Citizen L prefers running for office to letting R win
Citizen R prefers running for office to letting L win
1
2
3
Among such pairs satisfying the condition 1...
the distance between L and R's bliss point must be large enough
W^m(g)
g
g^m
g^L
g^R
Implications
Policy divergence as an equilibrium
The Downsian model can only explain policy convergence
The citizen-candidate model can also explain policy divergence
even a very large one under strategic voting
Multiple Equilibria
The citizen-candidate model doesn't yield a unique prediction
So the model cannot be tested empirically
in terms of policy outcomes
Evidence
Testing the citizen-candidate model
We cannot test the model's predictions due to multiple equilibria
But we can test the model's no-commitment assumption
Otherwise there is no reason to believe in the model
rather than in the Median Voter Theorem
Very influential paper in two senses
Provide evidence against the Downsian model and in favor of the citizen-candidate model
Pioneer regression discontinuity design in economics
(along with Pettersson-Lidbom 2008)
Lee, Moretti, and Butler (2004)
Motivation
If politicians can commit to their electoral promise...
(as assumed in the Downsian model)
More competitive election forces their policies to converge
to the median voter's bliss point, at least partially
If politicians cannot commit
(as assumed in the citizen-candidate model)
More competitive election has no impact on their policies
("Voters affect policies.")
("Voters elect policies.")
Lee, Moretti, and Butler (2004)
Empirical challenge
Competitiveness of an election: endogenous to politicians' policies
Source of exogenous variation:
Close elections in the previous election
Close elections (nearly) randomly allocate
the winning candidate's party affiliation
Due to incumbency advantage (empirically true in U.S.)
it's also random how competitive the next election is
US House Representatives' roll-call votes, 1946-1995
0
100
Liberal
Conservative
Quantify how liberal voting behaviour is (known as ADA Score)
Lee, Moretti, and Butler (2004)
Data (cont.)
The ADA Score is widely used in political science literature
But it has disadvantages
Scoring can be subjective, possibly influenced by Representatives' party affiliation
Based on about 20 "high-profile" roll-call votes, the choice of which may be arbitrary
Lee, Moretti, and Butler (2004)
Data (cont.)
The authors use several alternative measures
So they can show their findings are not driven
by the particular way of measuring the roll-call vote behavior
DW-NOMINATE data by McCarty et al. (1997)
% of votes that agree with the Democrat party leader
Scores by other interest groups than ADA
Lee, Moretti, and Butler (2004)
Why U.S. House Representatives?
Two-party system
One important assumption of the Downsian model
Democrats and Republicans have different policy positions
Each legislator's votes on the bills are observable
Lee, Moretti, and Butler (2004)
Empirical strategy
Regression discontinuity design
y_i=f(s_i)+D_ig(s_i)+\beta D_i+\varepsilon_i
i
US House constituency x Election year
s_i
Democrat's candidate vote share
D_i
Indicator for the electoral victory of Democrat's candidate
(1 if \(s_i>0.5\); otherwise 0)
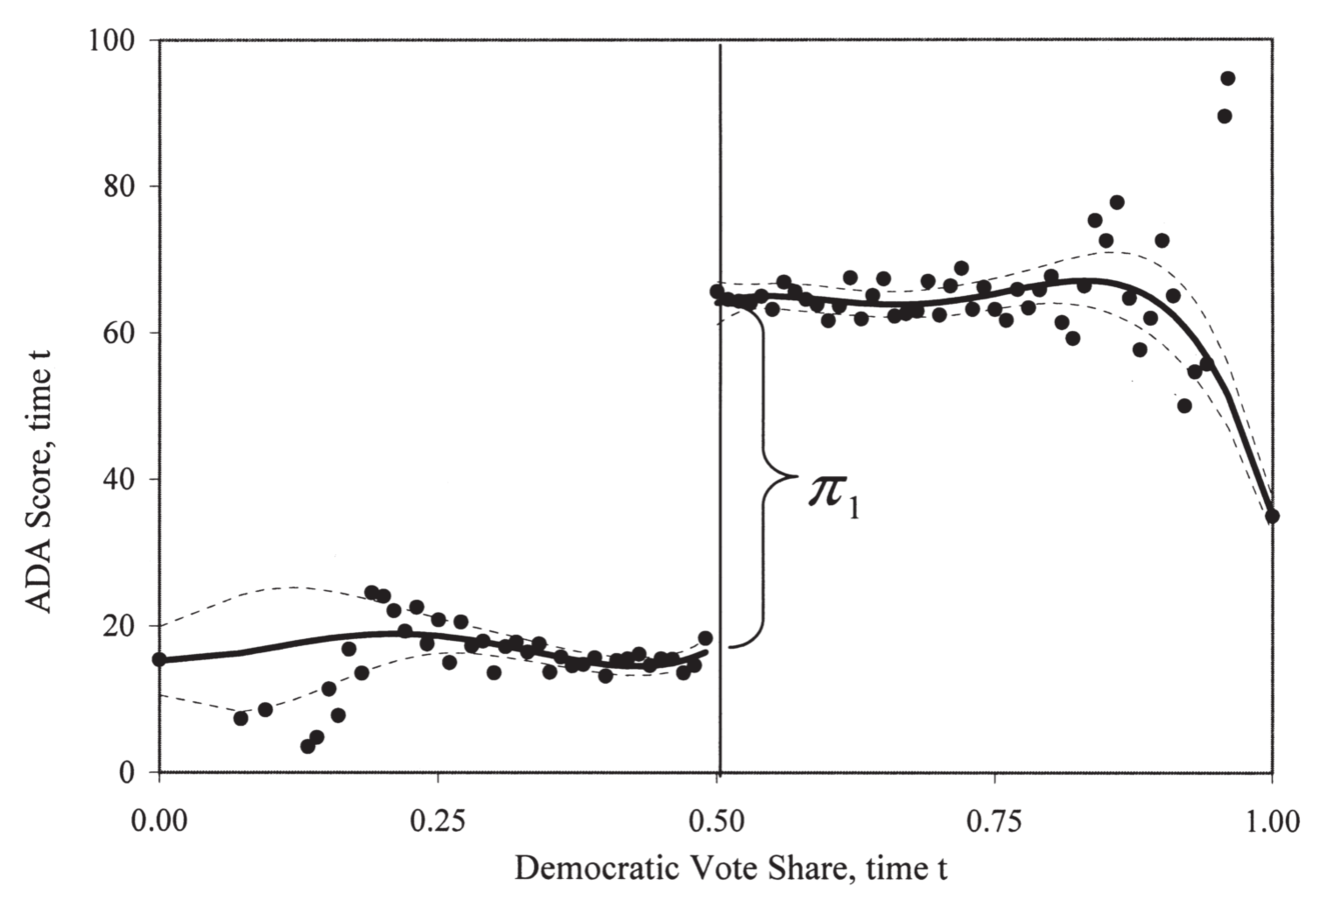
Result #1

Image source: Figure I of Lee et al. (2004)
the ADA score of the winner at time T+1 by about 20 pts
The election of a Democrat at time T increases
Interpreting Result #1
the ADA score of the winner at time T+1 by about 20 pts
This could mean two things
Democrats are more likely to win at time T+1
and vote according to their own policy preference
Representatives, whether Republican or Democrat,
are forced to promise the incumbent's policy
to win the election at time T+1
The election of a Democrat at time T increases
Source: Figure IIa of Lee et al. (2004)
Result #2
the ADA score of the winner at time T by about 45 pts
The election of a Democrat at time T increases
Interpreting Result #2
the ADA score of the winner at time T by about 45 pts
This finding is against the strict version
of the Downsian model (i.e. full convergence)
For close election districts, the median voter's preference should be similar on average between both sides of the cut-off
If politicians promise the median voter's preferred policy
we shouldn't see such a large difference in voting records
The election of a Democrat at time T increases

Source: Figure IIb of Lee et al. (2004)
Result #3
the probability of electing a Democrat at time T+1 by about 50 percentage points
The election of a Democrat at time T increases
Interpreting Result #1 (cont.)
increases the ADA score of the winner at time T+1 by about 20 pts
The election of a Democrat at time T
This could mean two things
Democrats are more likely to win at time T+1
and vote according to their own policy preference
Representatives, whether Republican or Democrat, are forced to take the incumbent's policy to win the election at time T+1
0.5 x 45 = 22.5 pts
20 - 22.5 = -2.5 pts
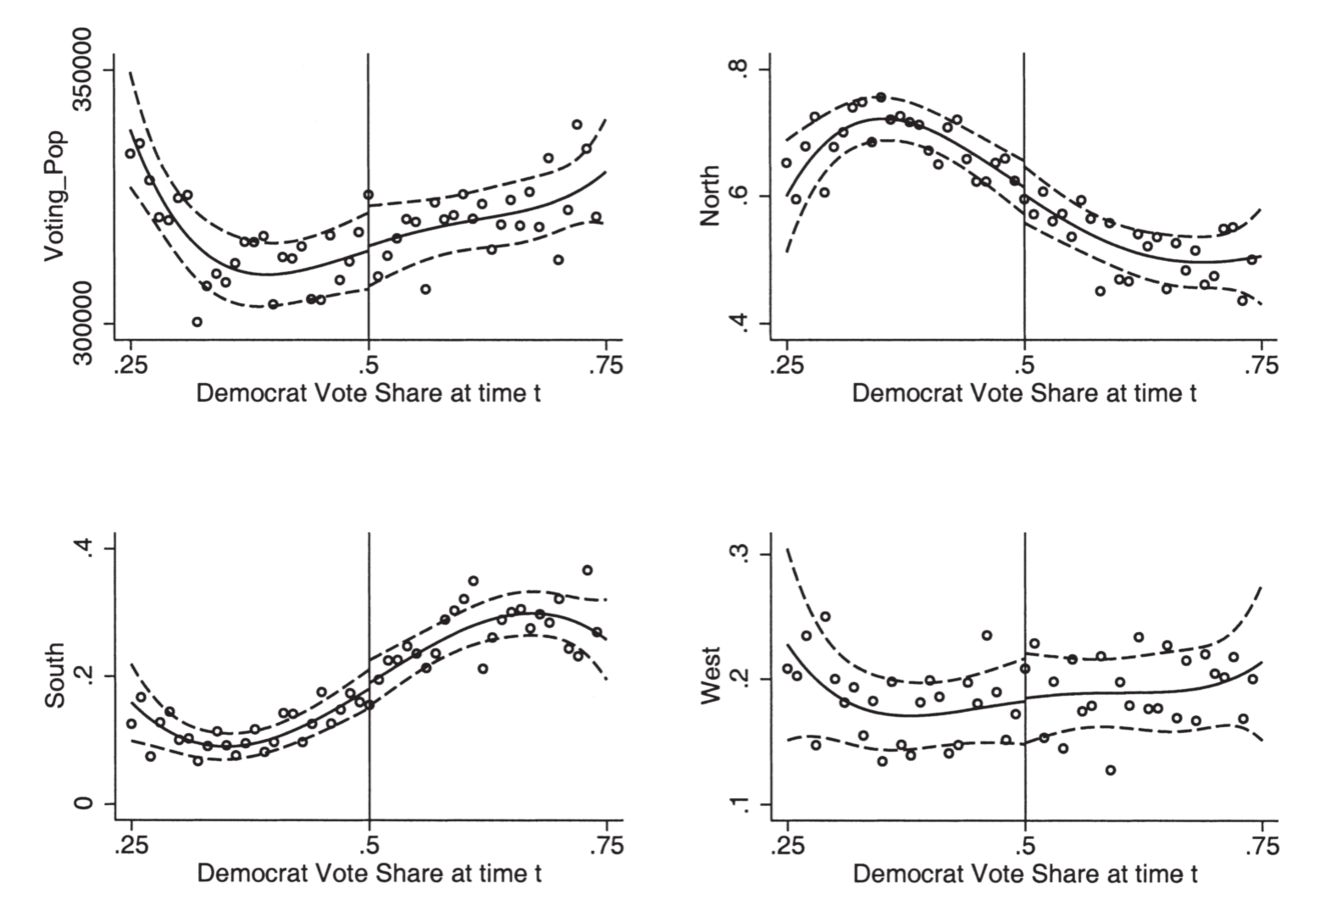
Test for random assignment
The election of a Democrat at time T in close elections
has nothing to do with constituency characteristics
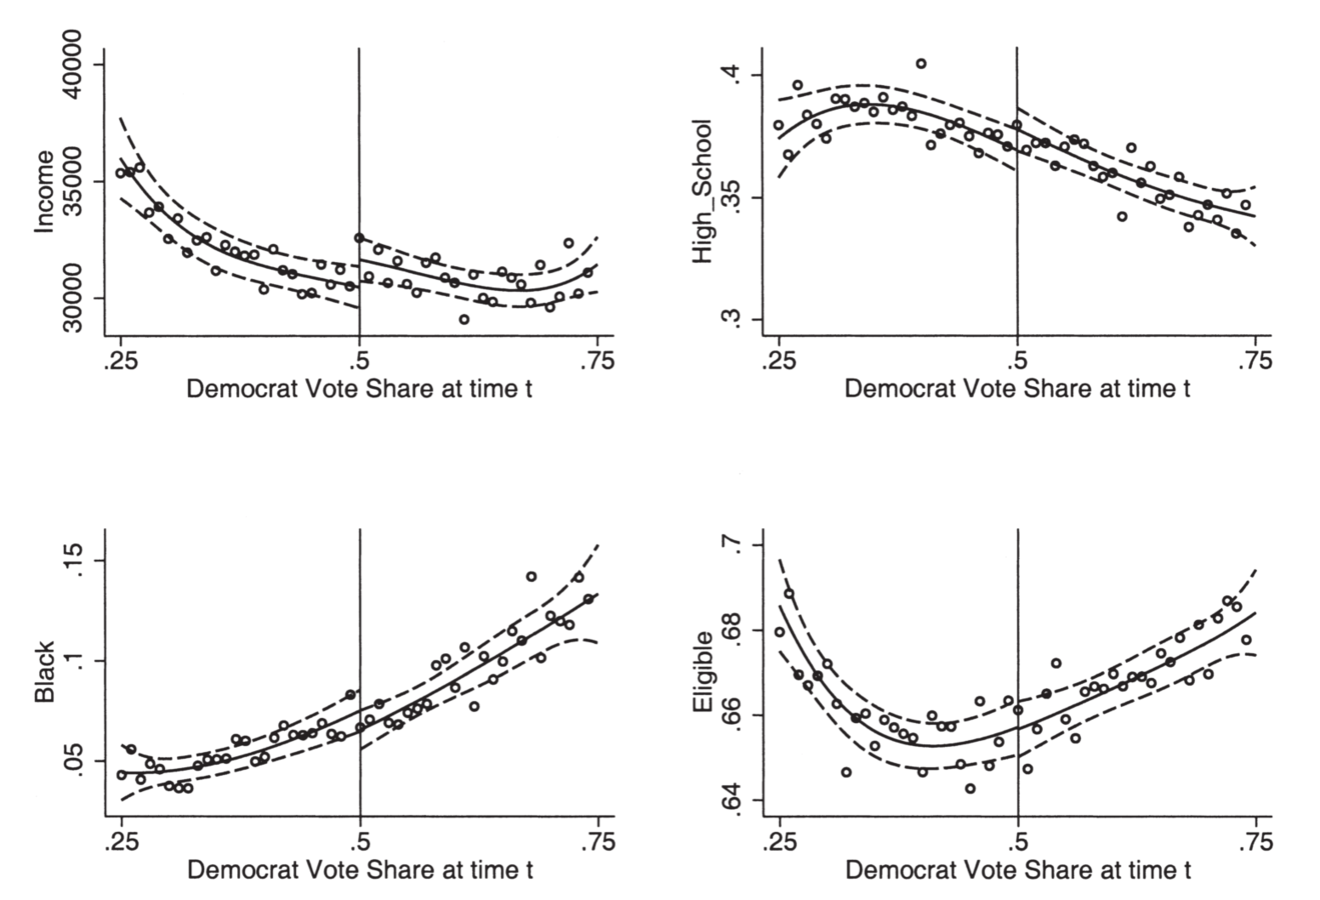
Source: Figure III of Lee et al. (2004)
Income
Education
Race
% of eligible voters
Test for random assignment (cont.)
The election of a Democrat at time T in close elections
has nothing to do with constituency characteristics
Source: Figure IV of Lee et al. (2004)
# of registered voters
% of North districts
% of South districts
% of West districts
Test for random assignment (cont.)
The election of a Democrat at time T in close elections
has nothing to do with legislators elected at time T-1
Source: Figure V of Lee et al. (2004)
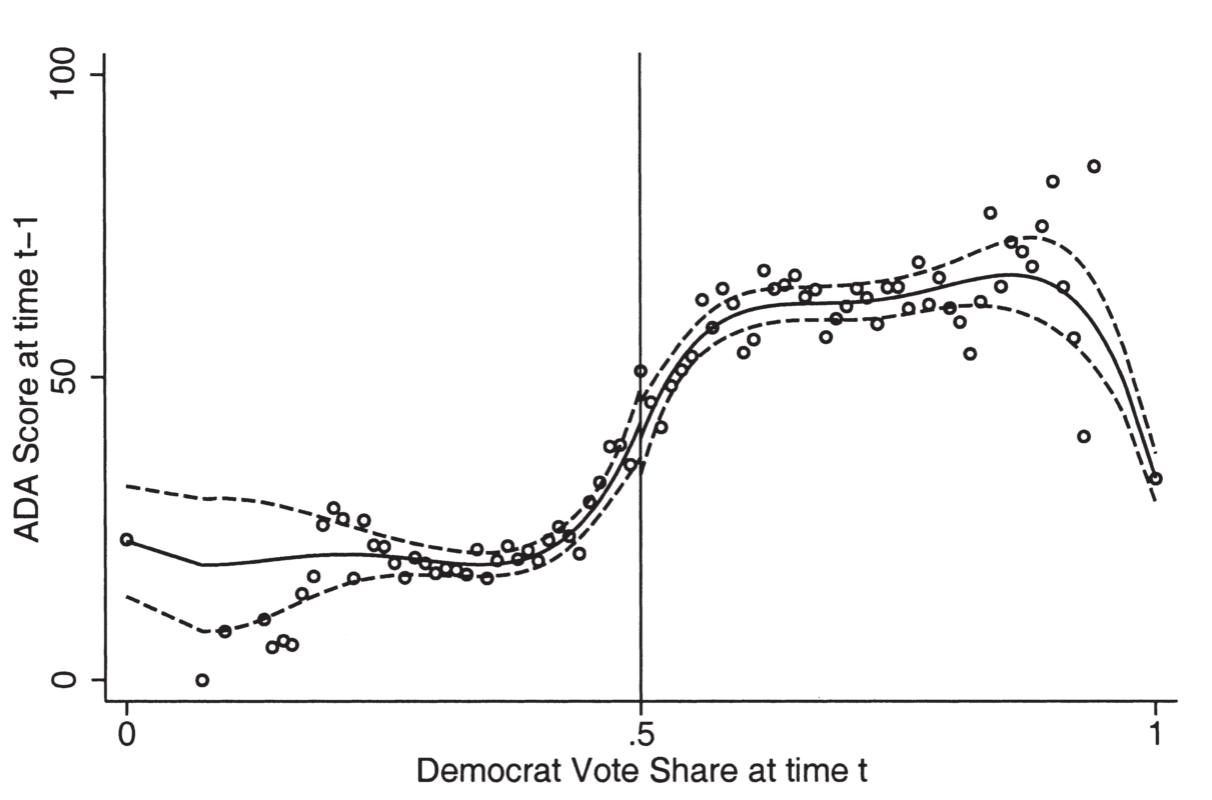
Tips for empirical studies: "Placebo tests"
To show the exogeneity of your treatment variable
Replace the dependent variable with
Pre-determined covariates
Outcomes before the treatment is assigned
This applies to any kind of causal inference
RCT
Regression Discontinuity Design
DID
IV
Other evidence for no-commitment assumption
Randomly chosen villages in India:
Village council head position reserved for women
In these treated villages,
more investment in drinking water
(about which women complain more than men)
Other evidence for no-commitment assumption (cont.)
In Indian states, some legislative seats are reserved
for scheduled caste and scheduled tribe candidates
The politician's identity changes
with no change in the electorate's preference
# of reserved seats changes in proportion to their population share according to the latest census
The arrival of new census results
exogeneously change # of reserved seats
Other evidence for no-commitment assumption (cont.)
Pande (2003) (cont.)
Panel regressions of Indian states for 1960-1992 show:
A rise in # of reserved seats in state legislature
Fiscal transfer to these disadvantaged groups
New research agenda: Political Selection
Thanks to the citizen-candidate model (and its supportive evidence)
Economists become increasingly interested in
Who becomes a politician?
This new research agenda is now known as political selection
Literature on Political Selection
Higher politicians' wage
Evidence from regression discontinuity design:
Lower federal transfer to municipalities
What attracts competent people into politics?
Party leader's incentive
How parties affect the competence of candidates
Electoral competitiveness
Electoral rules
Too much campaign contributions
What prevents voters from electing competent candidates
Relatives of re-elected politicians
Who run for office?
Runners-up in the previous election
Politicians in non-democracy: less educated than in democracy
Political selection in non-democracy
Connections and Performance in China
All ethnic groups are represented in cabinets in Africa
Data issues
Data challenges to study political selection
Information on non-elected candidates and all citizens
Who runs for office among the population?
Which candidates do voters select?
Measuring the quality of politicians
Education / pre-office income may just reflect luck
Measuring representation
Need for information on social class, not pre-office occupation
Sweden provides such data
All residents in Sweden are assigned the personal ID number
by the tax authority (since 1947)
This ID numbers allow researchers
to match any micro datasets on Swedish population

e.g.
Logging in to online banking
requires the personal ID number
Data on non-elected candidates and population
Dal Bo et al. (2017) compile the following data
All elected and non-elected candidates for national and municipal legislatures during 1982-2010 (over 200,000 in total)
Ranked by political parties as party list in PR system
Provided with personal ID number
Administrative data for the whole population on
age, sex, years of education, occupation, earnings
Linked via personal ID number to candidate lists
Information on non-elected candidates and all citizens
Municipal councilors in Sweden
72% of MPs used to be elected for a municipal council
cf. 29% for MPs in Japan (source: http://finchsuisatsu.seesaa.net/article/419477163.html)
spends 25% of GDP
employs 20% of workforce
for K-12 education, child care, elderly care, local infrastructure
by financing them from a local income tax of 20%
Municipality govt
Municipal councilors
"Leisure politicians" (except for mayors)
Election campaign cost financed by tax money (via party)
Data on competence
Dal Bo et al. (2017) compile the following data
Obtain Earnings Score as residual from Mincer regression
Information on the quality of politicians (and population)
y_{imt} = f_t(age_{it}, edu_{it},job_{it}) + \alpha_{mt} + \varepsilon_{imt}
For all men, a mandatory draft gives
Cognitive score (equivalent of the IQ test score)
Leadership score (equivalent of the Big 5 Personality Traits)
Data on competence (cont.)
Pairwise correlation of years of education with
Earnings score: 0.076
Cognitive score: 0.51
Leadership score: 0.30
Education: only one of several dimensions of competence
For all Swedish men in 2011...
Data on representation
Dal Bo et al. (2017) compile the following data
Multigenerational Register to identify
Siblings
Biological father (and mother)
Information on social class / family background
Stylized facts on Swedish politicians
In this lecture we focus on Earnings Score as the ability measure
But the findings are similar for cognitive/leadership scores
Fact #1: Politicians are smarter than population


Source: Figure I of Dal Bo et al. (2017)
Source: Figure I of Dal Bo et al. (2017)
Kolmogorov-Smirnov test (Stata command)
rejects the equality of distributions for every pair of categories
Comparison to high-status professions

Municipal councilors: similar to small-firm CEOs
Mayors: similar to medium-firm CEOs
MPs: similar to lawyers, below doctors and large-firm CEOs
Source: Table II of Dal Bo et al. (2017)
Fact #2: Politicians are smarter than their siblings


Municipal councilors
Source: Figure II of Dal Bo et al. (2017)


Mayors
Source: Figure II of Dal Bo et al. (2017)
Fact #2: Politicians are smarter than their siblings

MPs
Source: Figure II of Dal Bo et al. (2017)

Fact #2: Politicians are smarter than their siblings
Fact #2: Politicians are smarter than their siblings
It's not that
both politicians and smart individuals
come from high social class ("Elitism")
Conditional on social class (i.e. sibling fixed effects)
those smarter become politicians
Fact #3: Politicians come from families across the whole income spectrum
Source: Figure IV of Dal Bo et al. (2017)

Income distribution of fathers of each occupation
Fact #3: Politicians come from families across the whole income spectrum
It's not that
being smart to become politicians
requires being born in high social class
("Exclusive Meritocracy")
Smarter people become politicians
Politicians represent the whole spectrum of social class
How can this be possible?
Fact #4: Stronger selection for lower social class


Ability gradient across class flattens
as moving up the political career ladder
Source: Figure VII of Dal Bo et al. (2017)
Additional evidence
on the decision to become a candidate
A positive correlation across municipalities
btw. mayor's wage & candidate ability
(Appendix Figure A.5)
A negative correlation across occupations
btw. age-earnings profile steepness & candidate ability selection
(Appendix Figure A.6)
It's not purely a story of intrinsic motivation
Additional evidence on who gets elected
A positive correlation btw. party list rank & candidate ability
(Figure VIII)
Political parties screen candidates by competence
Summary
High wage to be a mayor / an MP as well as intrinsic motivation
attracts smart individuals into politics
Low cost of entry ("leisure politicians") seems also key
Political parties screen candidates by competence
Positive selection into politicians is stronger for low social class
Swedish politicians are:
(1) Smarter than the population
(2) Representative of all social classes
Applications of
Citizen-candidate Model
Incorporate lobbying
Media's role in dertermining which policy is salient in elections
Elected versus appointed regulators
Some examples
Another application: Why political parties exist?
Other theories of political parties
Political parties aggregate information on which policies are correct
Endogenize # of political parties under different electoral rules
Today's take away
The Downsian paradigm is hard to defend
given the accumulation of causal evidence.
The identify of politicians does matter for policy-making.
So we need to figure out who becomes a politician
for better-understanding of policy choice.
Political Economics lecture 2: Citizen Candidate Model
By Masayuki Kudamatsu


