


Rahul Bajaj
Data Scientist by Profession - Enjoy number crunching using Open Source Technologies. Feel free to reach out to me at rahulbajaj@hotmail.co.in
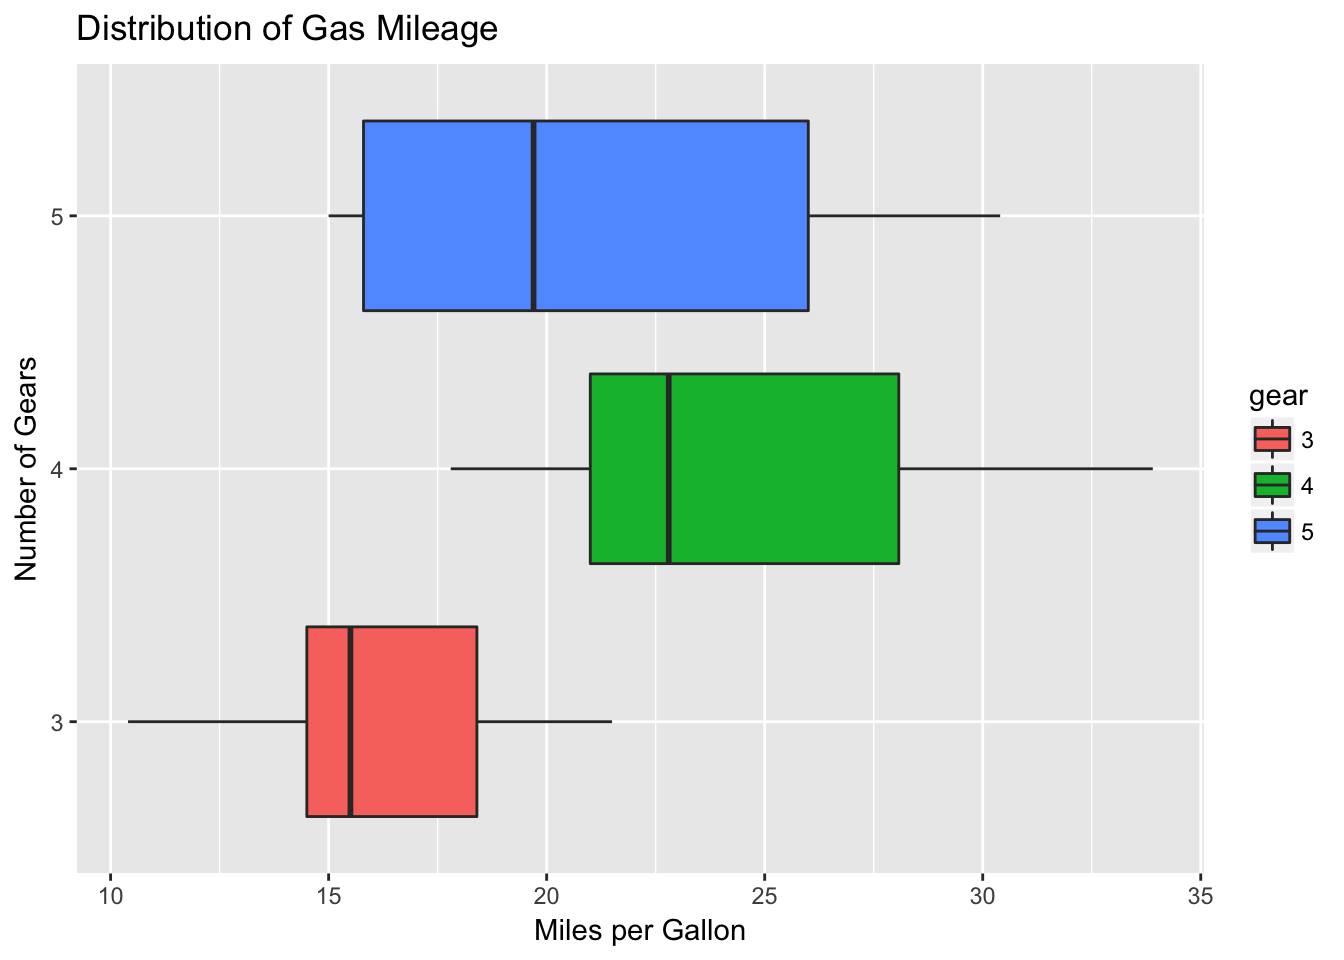
Which One is Fuel Efficient ?
How we figure it out ?
Who's more Reliable ? and why you think so ...
It's a world cup match .... Odds are in favour of ?
Left Tail
Data analysis ranges from analyses encompassing very simple summary statistics to extremely
complex multivariate analyses.
Q1
Q2
Q3
Q4
D1
D3
D4
D5
D6
D7
D8
D9
D10
D2
Measures of Central Tendency
Central tendency refers to the idea that there is one number that best summaries the entire set of measurements, a number that is in some way "central" to the set.
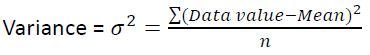
Sum of All Observation
Total Number of Observations
Total Score (Maths Test) = 6677
Students Count = 100
Average Score = 66.77
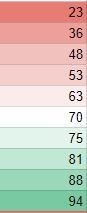
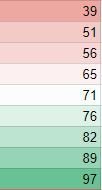
if n is odd, (n+1)/2th observation(sorted data)
else, average of n/2th and (n+2)/2th observation (sorted data)
63+70
2
66.5
71
Appears most often
Appears most often
Measures of Dispersion/Variability
Measures variation / uncertainty
Measures of Dispersion/Variability
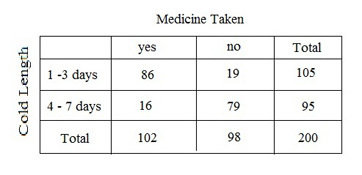
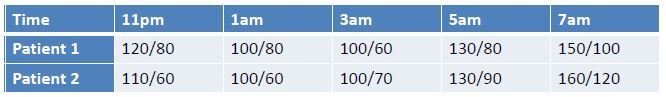
Two patients are admitted into the Intensive Care Unit of a hospital. The night before their operation, the doctor makes the last visit at 9pm and blood pressure for Patient 1 is 110/80
and for Patient 2 it is 120/70. Although they are normal, for precautionary reasons, the Doctor asks the nurse to check their blood pressure every 2 hours. At 7.30 the next morning,
the nurse reports that the average blood pressure for both the patients was normal, 120/80.
The chart of their actual blood pressures was:
What if the doctor decides to operate the patients without looking at the blood pressure chart?
What may go wrong, if you plan your vacation knowing the last weeks average temperature of the destination ?
What if you decide to join an organisation which has average annual pay hike 6%. Assuming you will perform well and would be on a higher side of pay hike. While the data is :::
6% Constant Pay Hike for all
Measures of Dispersion/Variability
Measures variation or uncertainty
Examples ::
- Variation in temperatures throughout the week
- Variation in cab hire rentals during the day
- Differences in ROI from different instruments
Need for Measures of Dispersion/Variability
- Helps determine the reliability of the measure of central tendency
- Facilitates comparison of two sets of data
- Useful for building further statistical measures
Measures of Dispersion/Variability
Maximum & Minimum Value
Useful when range of tolerance exist i.e. if values beyond a certain threshold are harmful/unacceptable.
Ignores any pattern in the data
Ignores most of the data
(+)
(-)
Measures of Dispersion/Variability
Range = Max Value - Min Value
Easy comparison of variability across datasets
Easy to compute and understand
Ignores any pattern in the data
Ignores most of the data
(+)
(-)
Measures of Dispersion/Variability
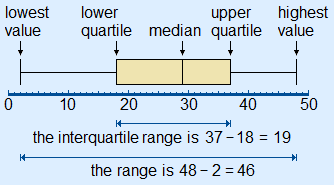
Inter-quartile Range = 3rd Quartile - 1st Quartile
Highlights the middle portion of the distribution of values
Easy to understand
More difficult to compute than Min-max and range
Ignores irregularities on the extremes
Ignores 25% data on each side
(+)
(-)
Measures of Dispersion/Variability
Distance from the Mean ?
Consider a hypothetical dataset
(1,1,2,2,3,3,4,5,5,6,6,7,7)
Mean = Median = ?
Consider
Taking absolute values or taking squares so that we are
considering only the magnitudes
Measures of Dispersion/Variability
Squared Deviation
In order to look at a measure that has unit of measurements
equivalent to the original data, we can take square root:
Measures of Dispersion/Variability
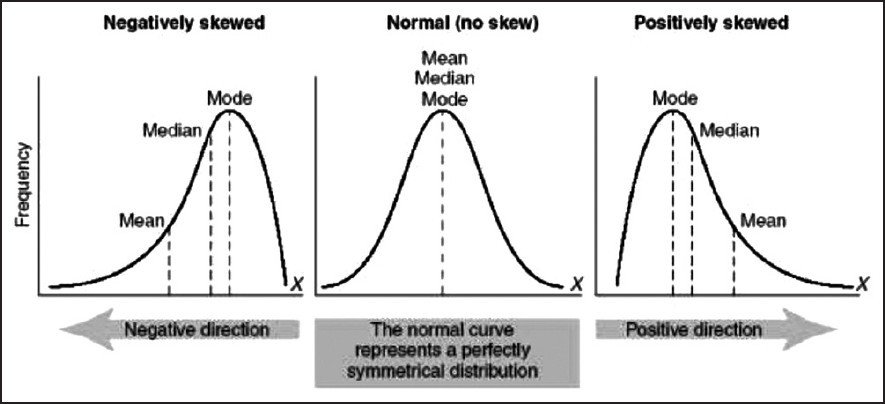
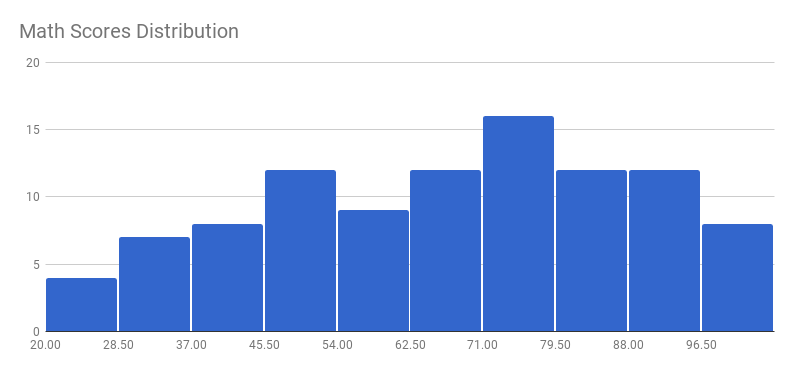
Skewness
Skewness is a measure of symmetry (or the lack of it) in a dataset
A distribution is right-skewed or positively skewed if it stretches asymmetrically to the right
It is left or negatively skewed if the asymmetric stretch is on the left
Important to note that if a distribution is perfectly symmetric, Coefficient of Skewness = 0
A ‘coefficient of skewness’ value closer to zero, indicates a highly symmetric distribution
Measures of Dispersion/Variability
Skewness
Measures of Dispersion/Variability
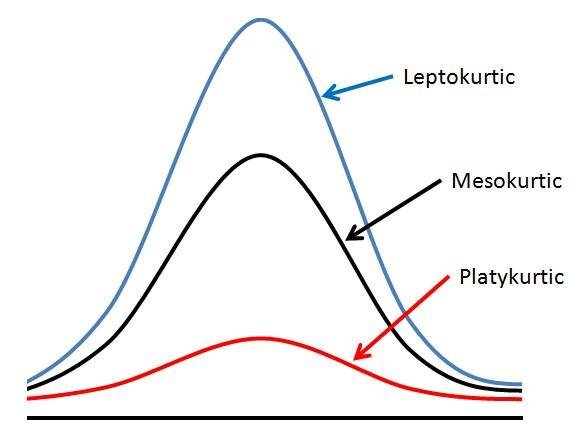
Kurtosis
Kurtosis is a measure of peakedness of a dataset
The ideal value for kurtosis is 3 and such a curve is called the Mesokurtic curve
Value larges than 3 indicates that the distribution would be peaked with shorter tails.This graph is also termed the Leptokurtic curve
Value smaller than 3 would fetch a flatter graph with longer tails and is called the Platykurtic curve
Measuring kurtosis using moments:
Measures of Dispersion/Variability
Kurtosis
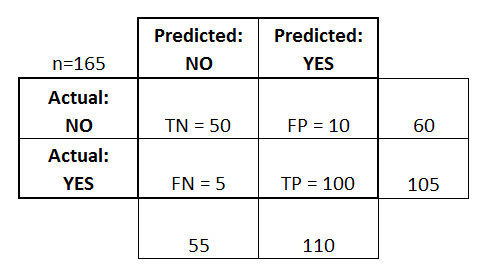
Box Plot is used as :
Useful in Studying
- The frequency with which observations are assigned to each category or point on a measurement scale.
– May be expressed as a percentage of the total sample found in each category
Cross classification of categorical variables in which rows typically represent categories of explanatory variable and columns represent the categories of response variable.
By Rahul Bajaj
Descriptive Statistics