Disco Election
A Large Data Collection Project
Chao Tianyi
Initium Lab
2015-Nov-23
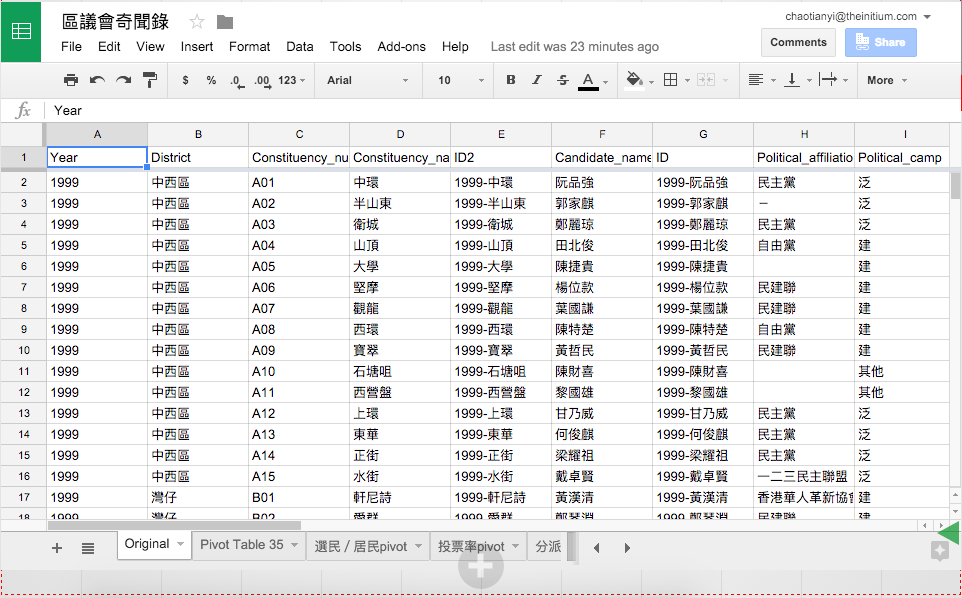
What's the data?
- 4392 candidates in 1999~2015
name, occupation, party, camp, votes-obtained
- 2039 constituencies in 1999~2015
votes in total, voting rate, count of voters, population
Our project
2 dynamic webpages
1 interactive webpage
https://theinitium.com/project/20151012-hk-district-council-elections/
https://theinitium.com/project/20151012-hk-district-council-elections/
https://theinitium.com/project/20151029-hk-district-council-elections-3/desktop.html
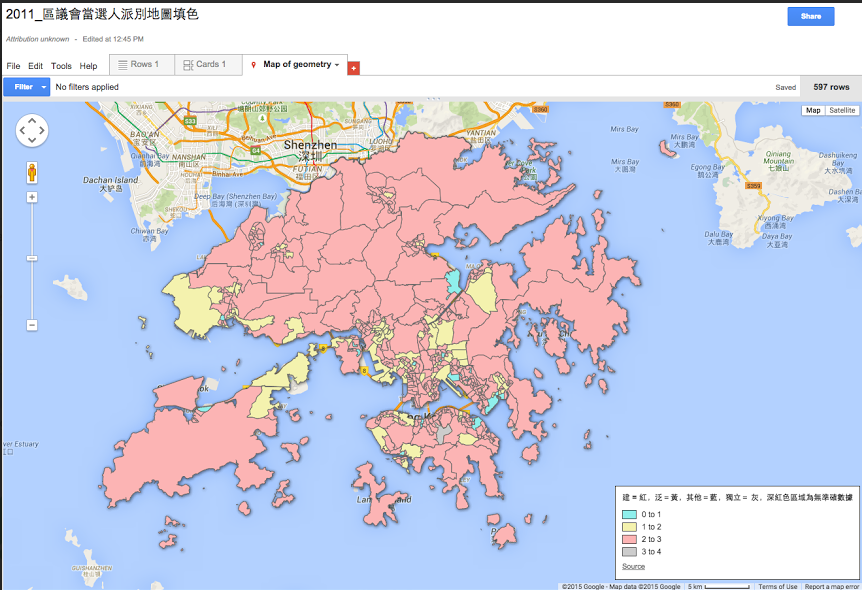
Idea
Collect
Visualize
Analyze

Data
Data
Data
Idea
Collect
Visualize
Analyze
Data
Data
Data
We live in a cruel world.
You always cannot get the data you want easily.
4+ weeks 5 people
Disaster #1
Missing data
The government has already deleted
- 1999 disco election website
- 2003 disco election website
- candidate profiles before 2011
(for privacy protection concern)
Solution #1.1
Use Wayback Machine to find out old and deleted webpages.
Solution #1.2
Use other credible source, like....book.

Disaster #2
Messy data
- different Chinese used in different year
- short name VS full name
- parties are changing names
This is Solution #2
Disaster #3
Are "Independent" candidates really independent?
- over 60% of the candidates in 1999~2011 claimed as "independent"
Solution #3
- dig out their background
- find a standard to label them
- ask Professor Ma Ngok in CUHK for suggestions
What we have got...
What we have got...
25%
25%
Copy and paste info on official website
Input
manually
50%
Generated by table functions, based on raw data on official website
Idea
Collect
Visualize
Analyze
Data
Data
Data
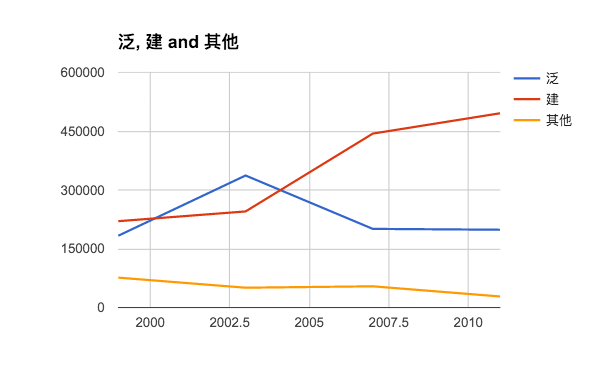
- list a bunch of questions
- answer them with basic calculation
Function: pivot table, sorting, sum, division
Tool: fusion tables, google sheet
Idea
Collect
Visualize
Analyze
Data
Data
Data
Takeaways
for journalists
working in a data team
Mindset
-
Large DJ project is always teamwork
-
Idea makes you irreplaceable
Skills
-
Collect information
-
Writing
-
Organize and analyze data with table
-
Visualization
infographic, interactive webpage, animation, ...
wise
As for this part,
Visualization
infographic, interactive webpage, animation, ...
- You can always turn to programmers and designers
- Learn some jargon
- Get to the point, avoid using vague descriptions
- Make prototypes
Tool list: Google Sheets, Fusion Tables, Tableau, Baidu Echarts, Kumu,..., sketches!
Don't be afraid of messy data.
Don't be afraid of maths or coding.
Don't be afraid of learning new things.
Disco Election
By Tianyi Chao