Data Visualization
epistemic, ethical and representational problems
interpretative traditions
culture history
art history
philosophy
truth
evidence
Aristotle: diagram = evidence (mathematics, logic)
Senders Peirce: diagram = logic
diagrammatics: logical reasoning
Latour: diagrams make facts "harder"
epistemic images / images of knowledge
useful/informational/operational
Information graphics and data visualization not only play a mediating role in the production of knowledge, but knowledge is created by being made visible for cognition.
epistemic problems
if our knowledge is based on understanding diagrams, data graphics, data maps and visualizations, we should ask: what is the source of knowledge
Greeks: philosophy/logic/math
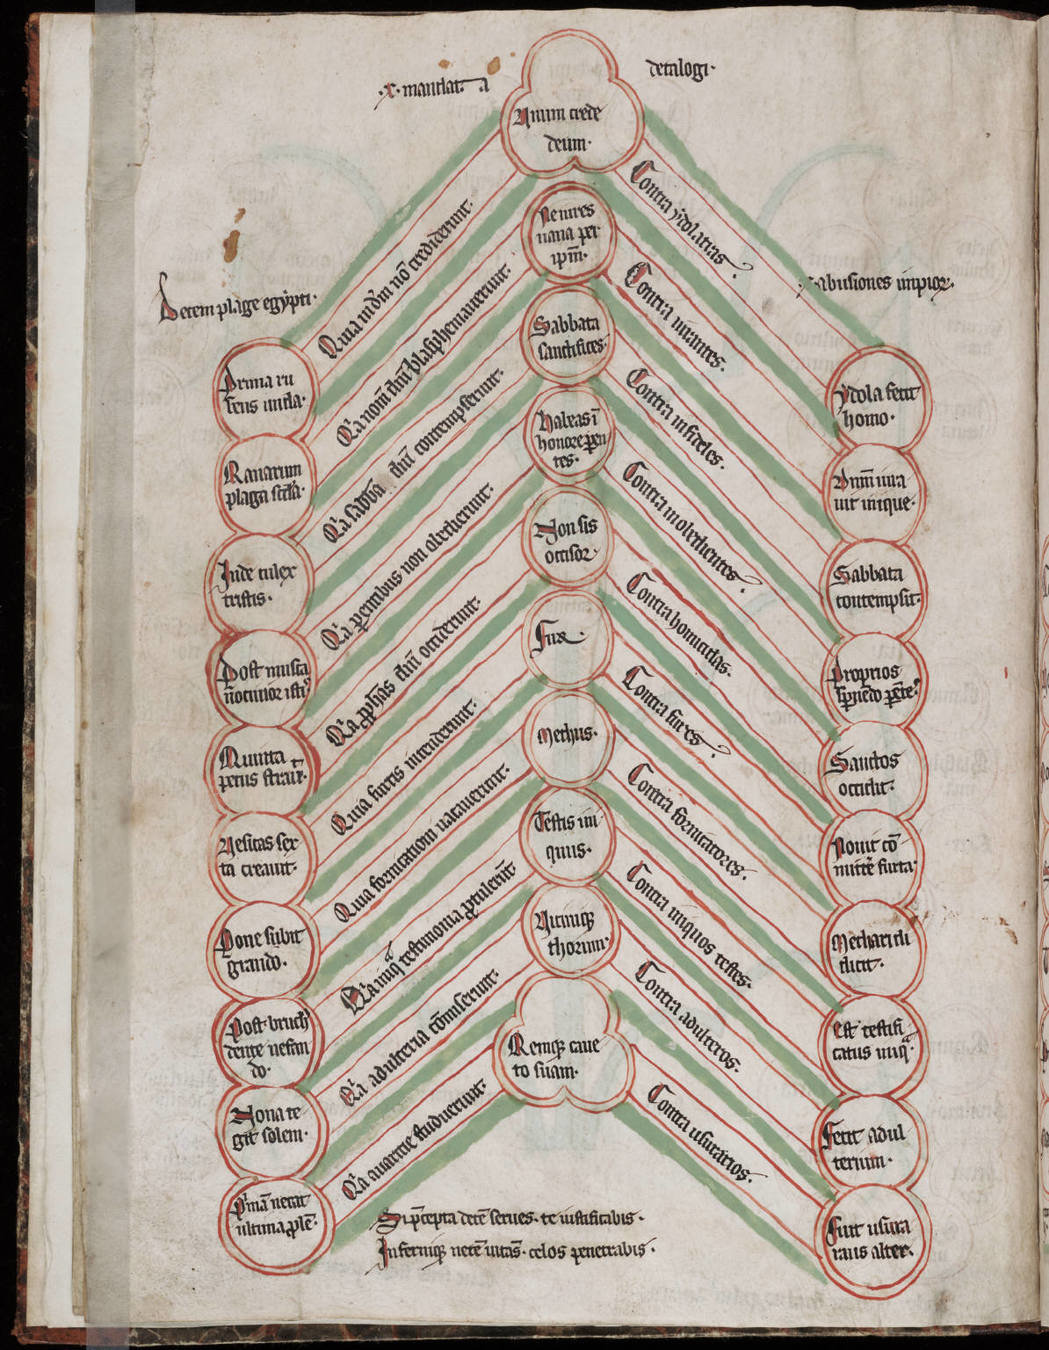
Christianity (and other religions): God - logic
Enlightenment/modernism: God/Science/Capitalism
Postmodernism/contemporary thought: Science/Interpretation/Narrative
see: "data is a construction"

using data visualizations
exploratory
explanatory
(re)search
finding
questioning
understanding
learning
explain
persuade
educate
inform
enlight
prove
debunk
propaganda
Oxford Dictionary: explaining = "make an idea or situation clear to someone by describing it in more detail or revealing relevant facts"
Explanation is never neutral
diagrammatics: visual rhetoric, visual argumentation
rhetorical formulae / logical fallacies
hyperbole, false balance, cherrypicking, ad nauseam, false correlations


- criticism
ethical norms
normative rules
don't lie
don't mislead
don't do harm
be transparent
be accountable
graphical excellence
critical data studies and data visualization
The graphic presentation of the data proclaims the ideology of capitalism
the graphical presentation of data can contribute to the perpetuation of existing power structures, social inequalities and stereotypes.
Susan Buck-Morss, Catherine D'Ignazio, Lauren Klein
critical data studies and data visualization
counterdata
missing data
data accessibility
Examples


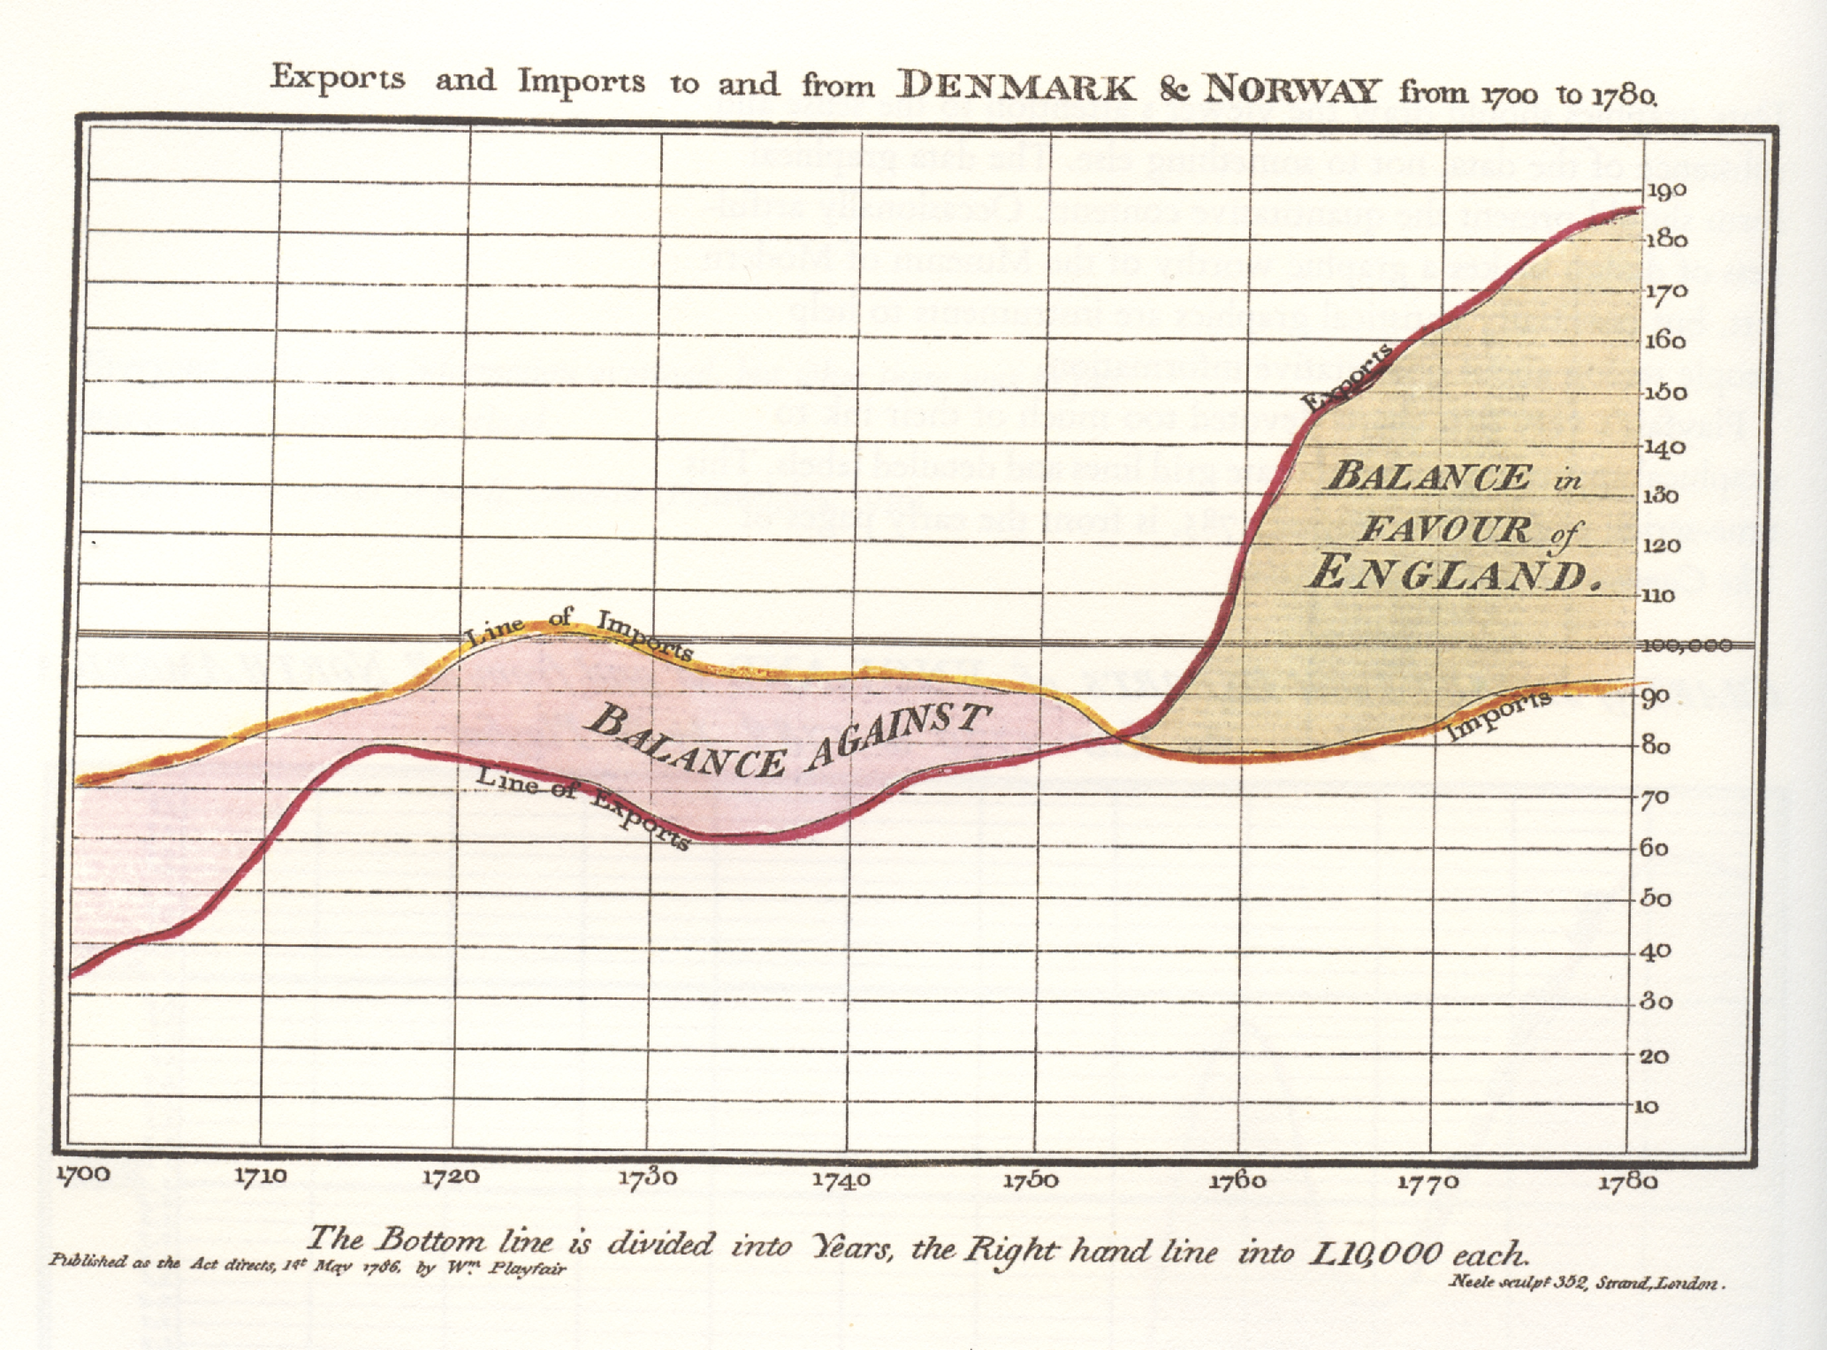
William Playfair: Political and Commercial Atlas 1786, 1801


Communist propaganda


Right wing propaganda
Trump


Trump


Joe Biden

Anthony Hearsey
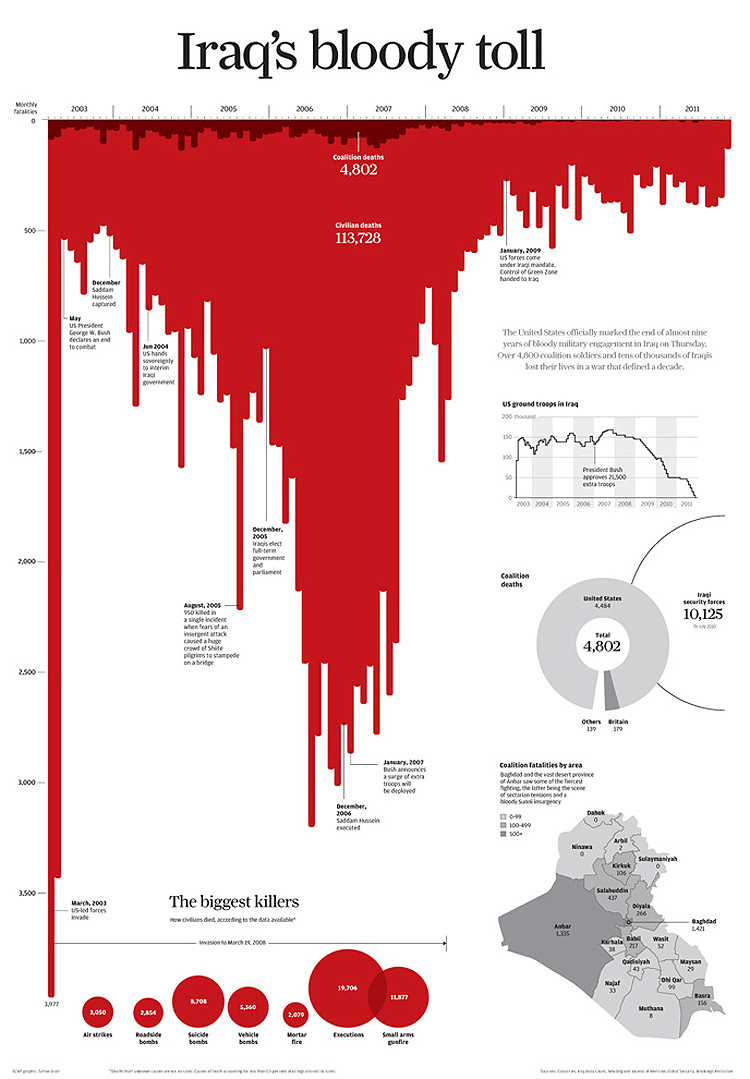
Simon Scarr
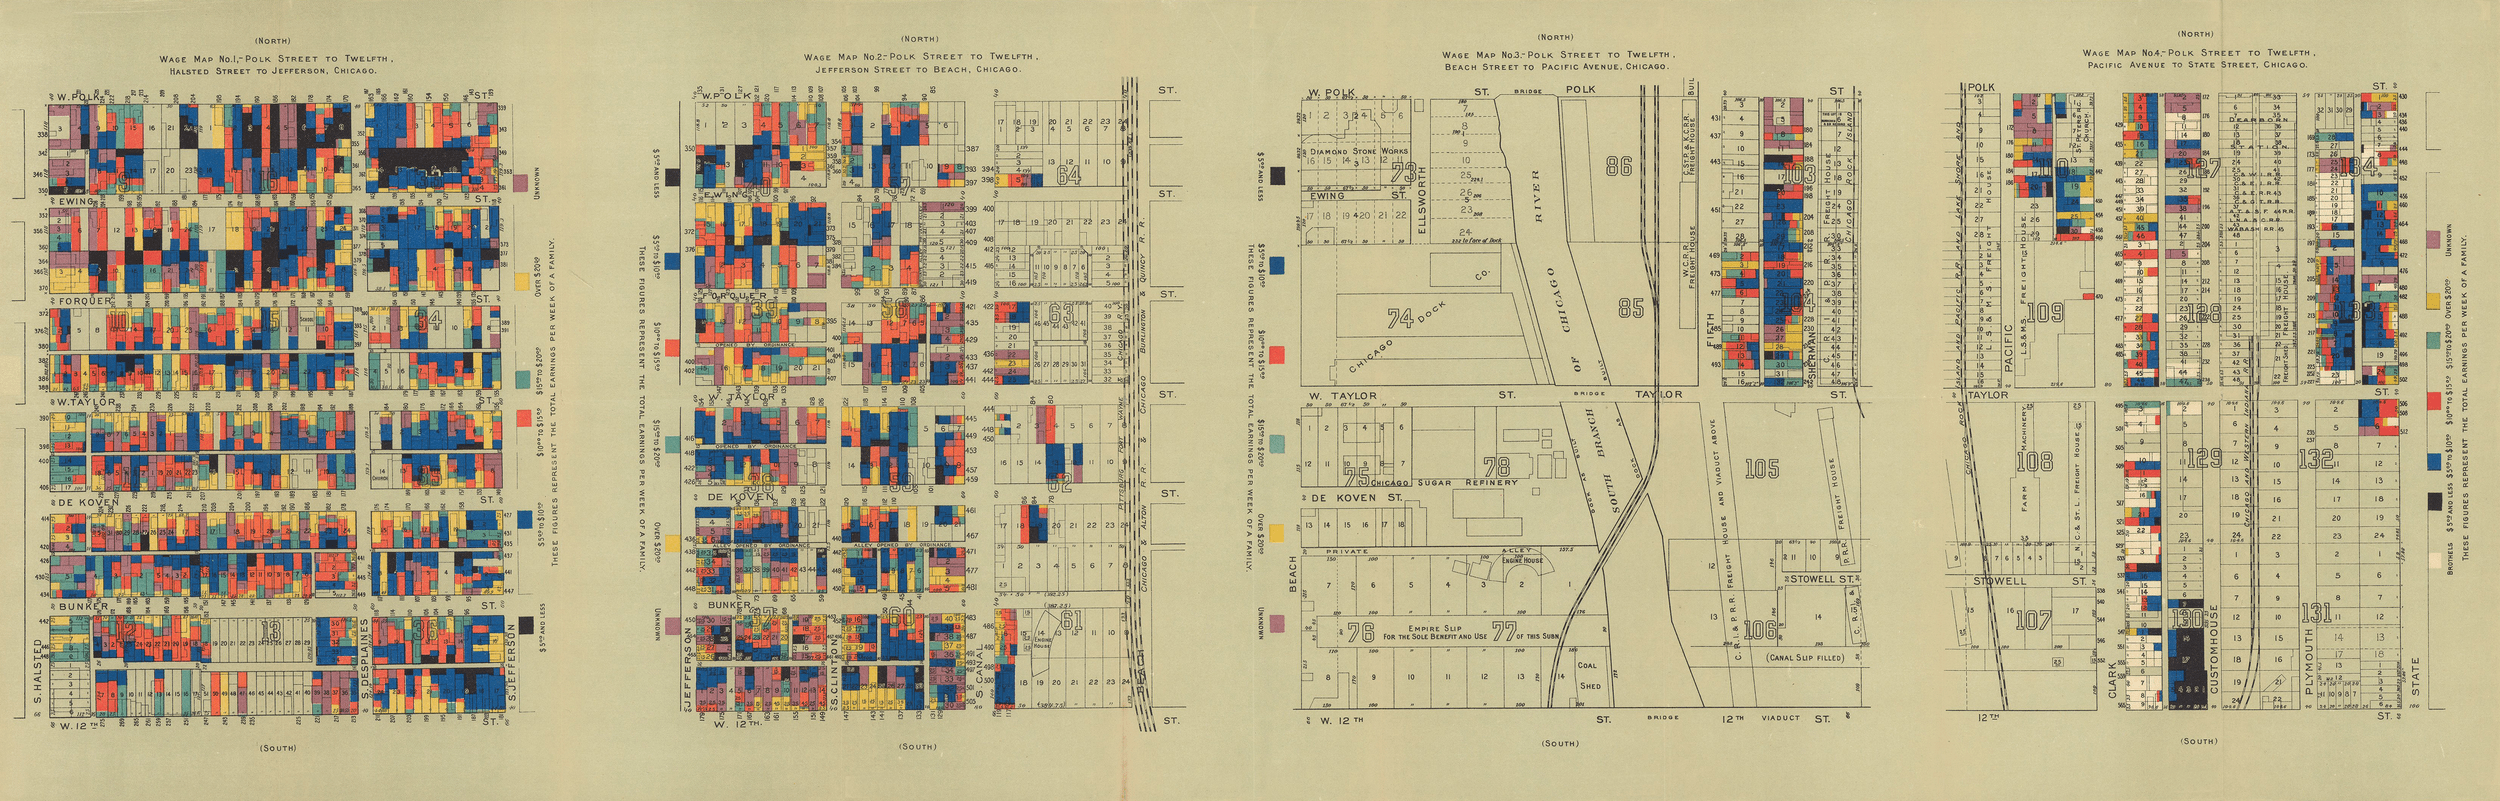
Florence Kelley, Jane Addams: Hull House Project, 1895


WEB DuBois: The American/Georgia Negro, 1901
WEB DuBois: The American/Georgia Negro, 1901


Ferenc Jahn: The Sociography of Kispest, 1937


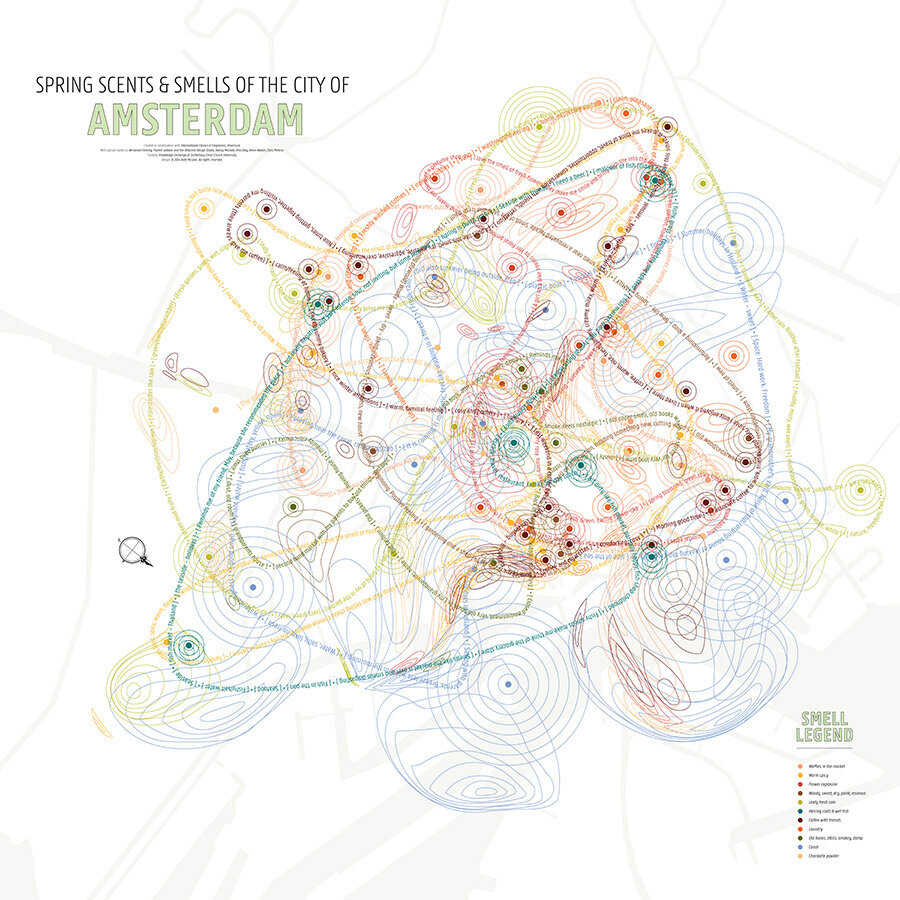
Kate McLean: Sensory Maps, 2014
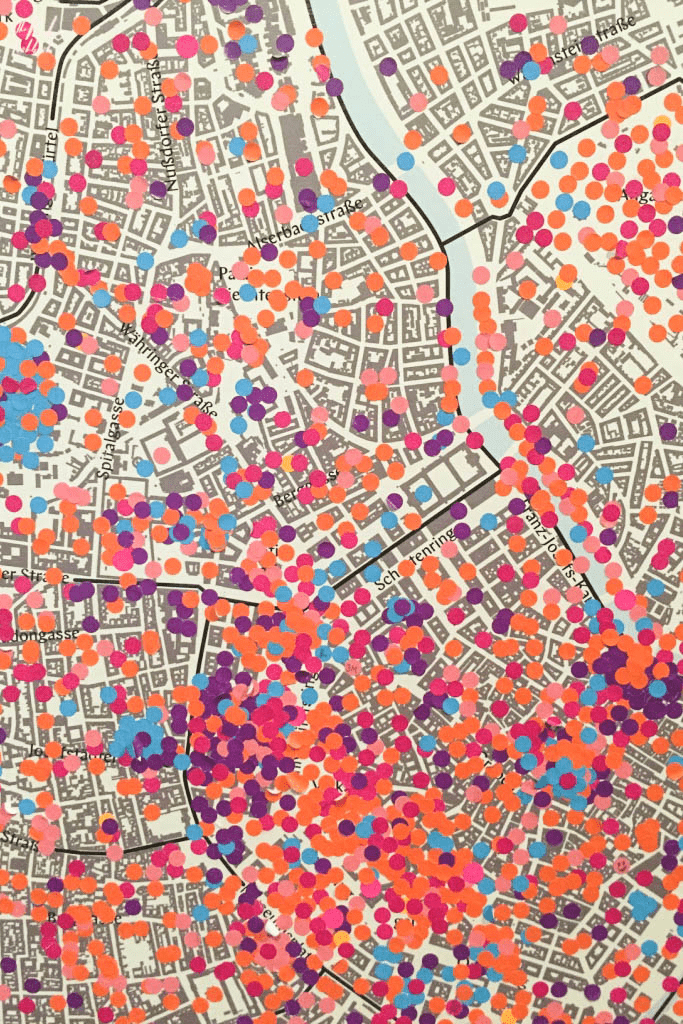

Vienna Map of Feelings and Emotions, 2017
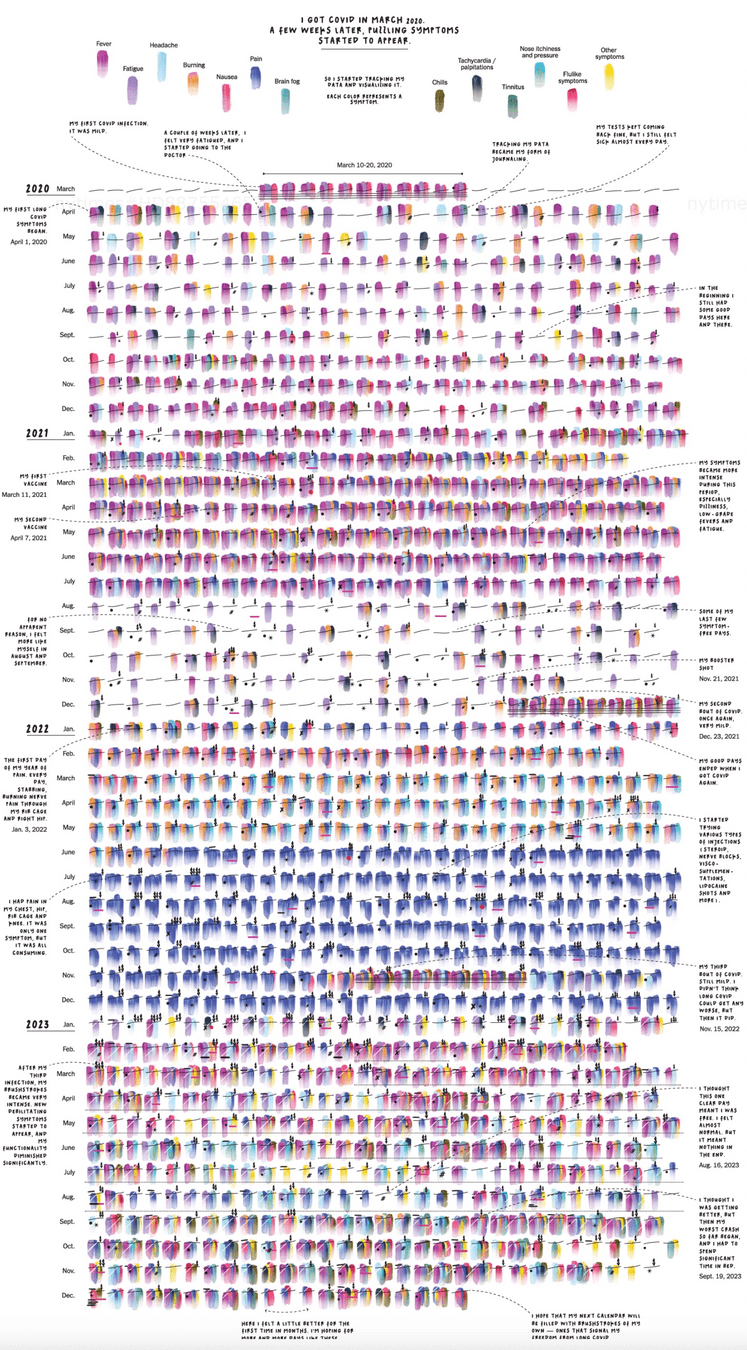
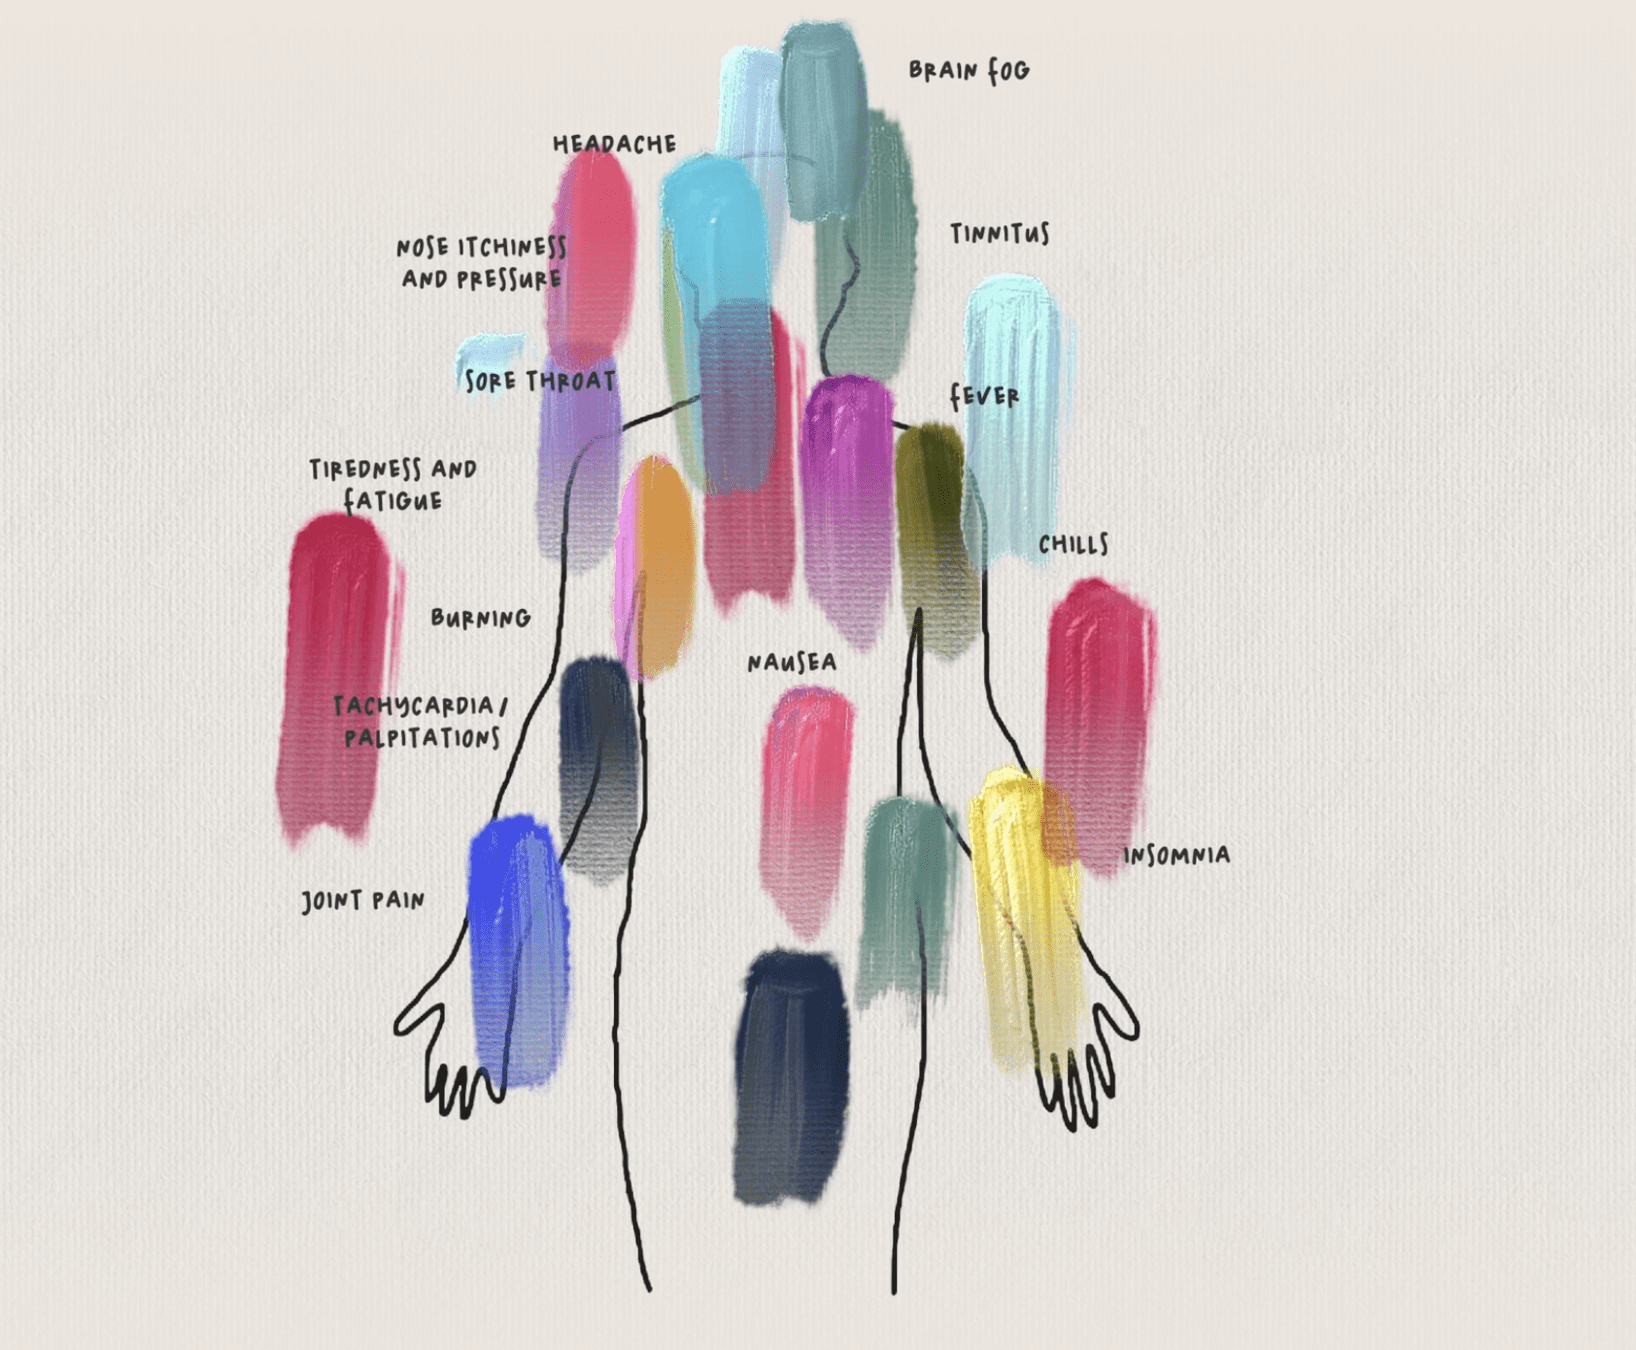
Giorgia Lupi: My Life with Long Covid, NYT 2023
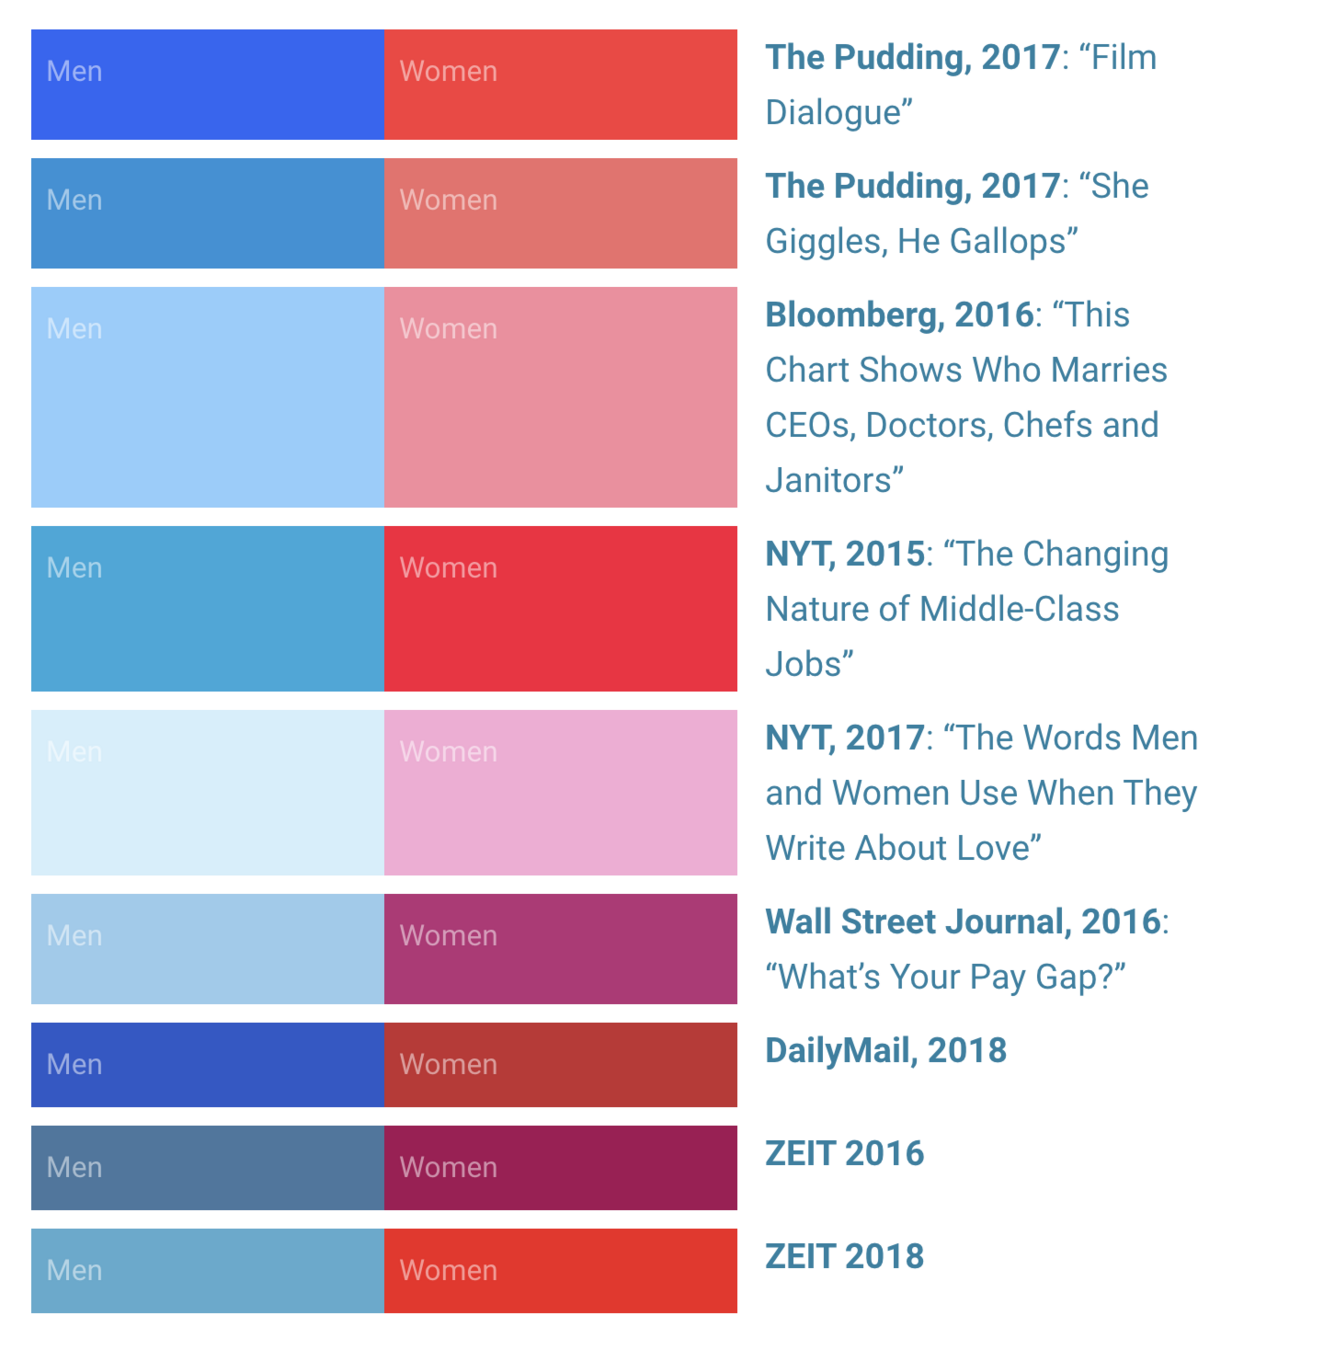

Lisa-Charlotte Muth, 2018
Federico Simeoni, 2023


Schwabish, Feng

ESRI, 2021


Frank Elavsky, 2023


Göttli, Bekefi, Korompai 2023


history of information graphics
Critiques of the practice data visualization
By Attila Bátorfy


