Brief introduction to
data visualization and data design
What is data visualization?
visual representation of information
visual reasoning
Purpose?
- seeing
- searching
- telling
- understanding
- learning
- processing
- memorizing
- arguing
Process?
- questioning
- finding the answers
- finding the right visual forms
- finding the right visual signs
- finding the right tools
- finding the right design
Definition
Every data visualization is information graphic
but
not every information graphic is data visualization

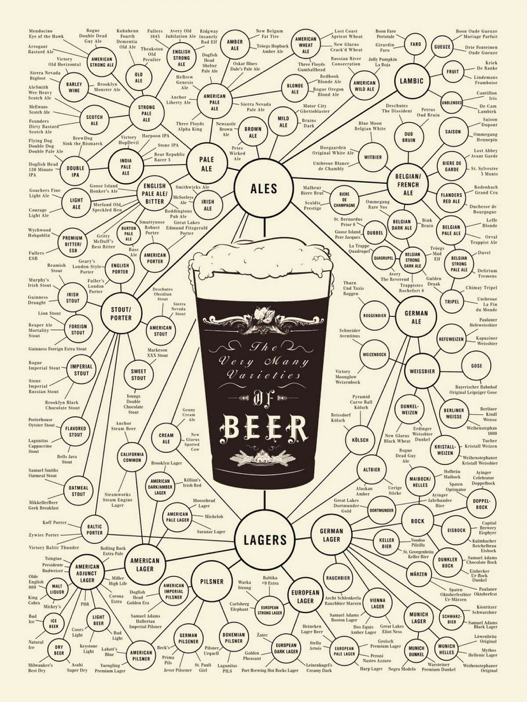
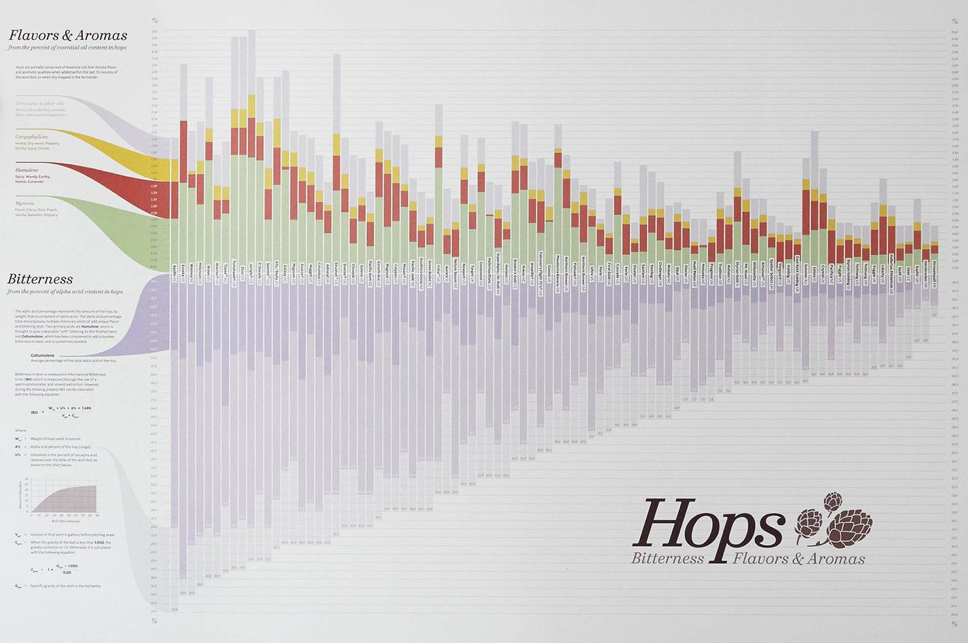
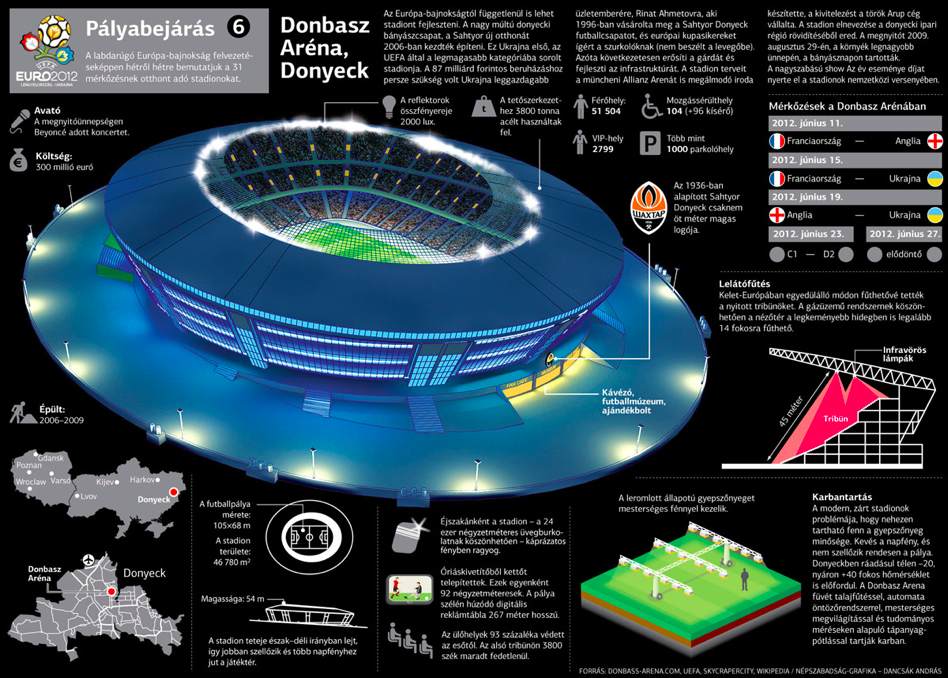
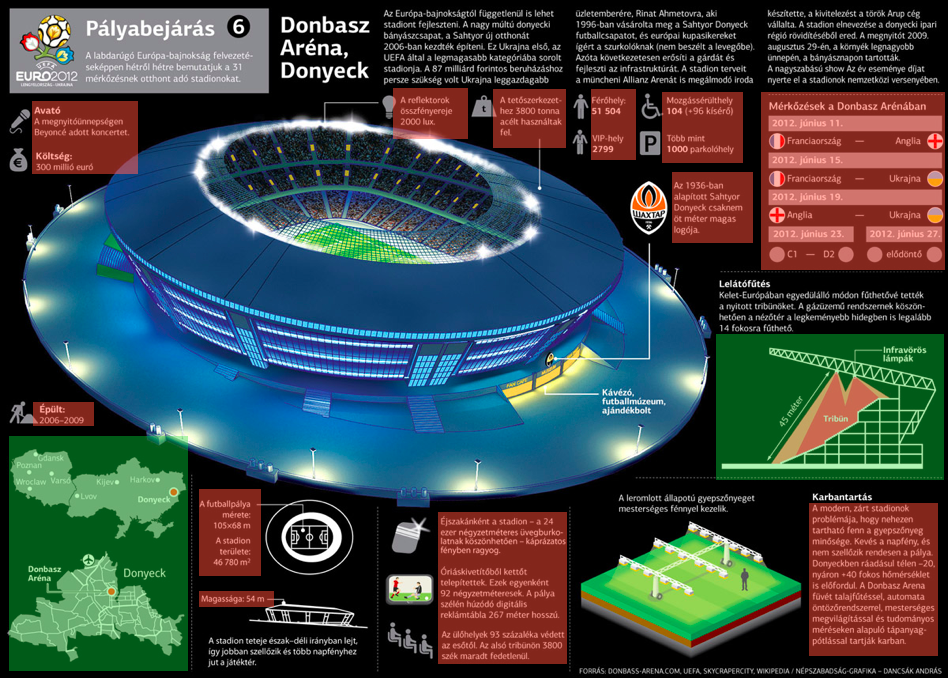
Pseudo
PopChartLab 2013
TypeCode 2017
Dancsák András
Dancsák András
hard to find anything
Why we visualize data?
- highlights the important
- shows the hidden
- shows patterns and outliers
- helps understanding complexity
- helps the learning process

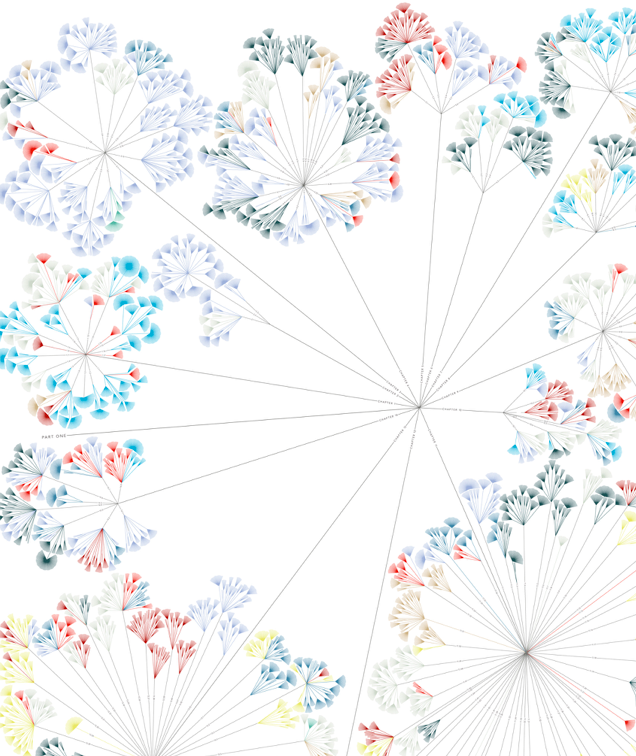
Stefanie Posavec 2008

Alessandro Coco 2007
Szűcs Krisztina 2015
Principles
- Useful and usable
- Aesthetic
- Understandable
- Unobtrusive
- Honest
- Long-lasting
- Detalied
- Shows less "design"
Principles
-
Shows the data clearly
-
Argues clearly
-
Shows the important
-
Does not show unnecessary graphic elements
-
Makes complexity understandable
-
Does not simplify complexity
-
Planned, designed, detailed
-
Does not despise the public
Gestalt-principles


Similarity
Closedness
Proximity
Common fate
Continuity
Max Wertheimer
Optical illusions

Moiré-effect
dense or overlaying lines, dots can show a third pattern

Hermann-grid

Hering-illusion
the two horizontal lines are not convex but paralells

Jastraw-illusion
Blue-Green illusion

the importance of colour pairing
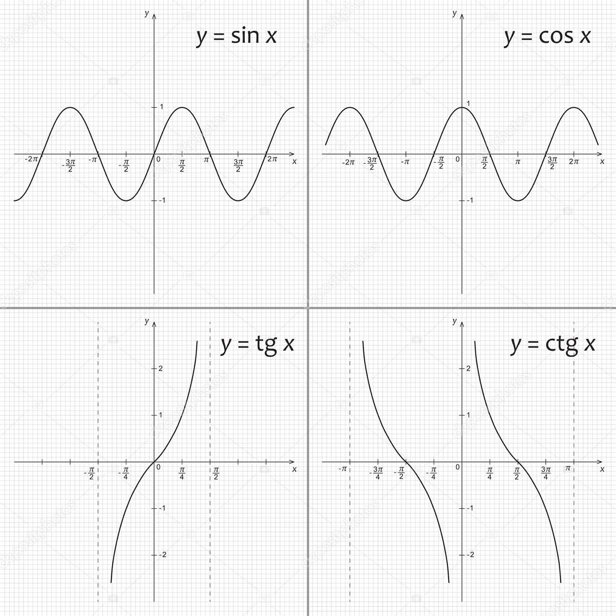
Graphic elements

point
line
shape
form
Attributes

position
length
angle
direction
shape
size
colour
Accuracy

more accurate
length
angle
direction
shape
size
colour
less accurate
position
accuracy does not mean effectiveness!
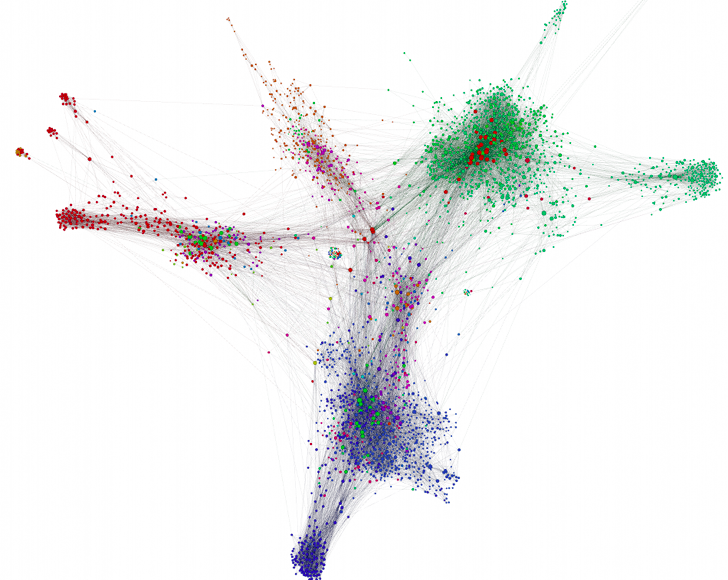
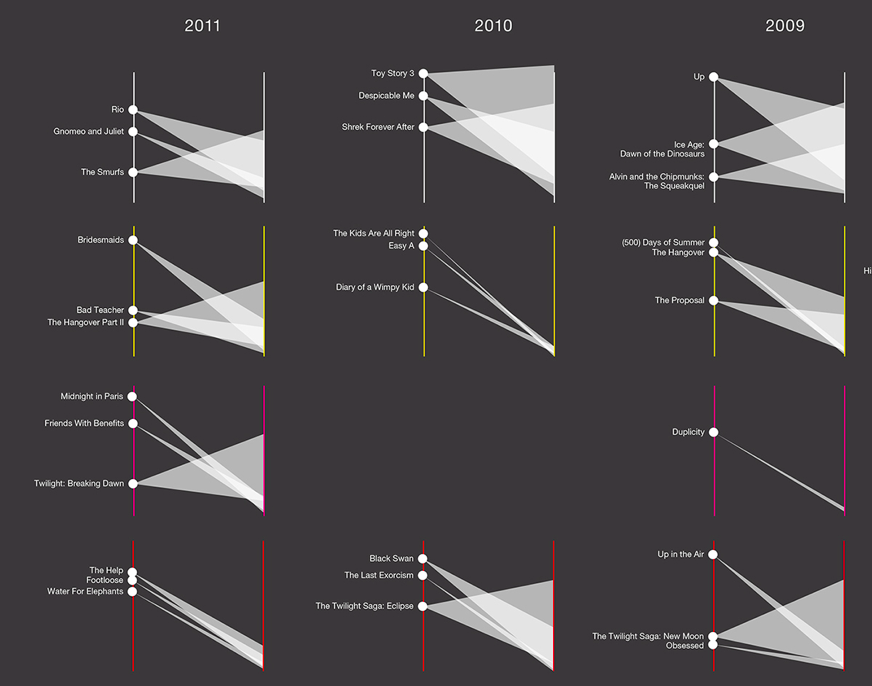
Patterns

position
length
angle
direction
increasement
size
colour
decreasement
pattern
outlier
noise
System

length
angle
direction
shape
size
colour
position
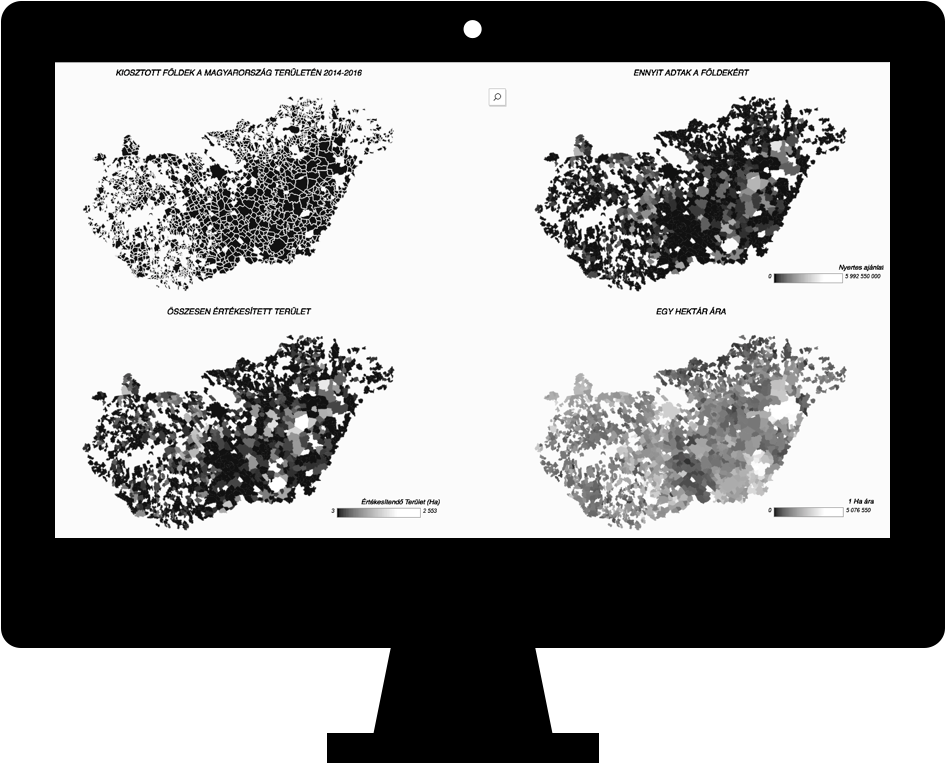
carthesian
polar
cartographic
Anatomy
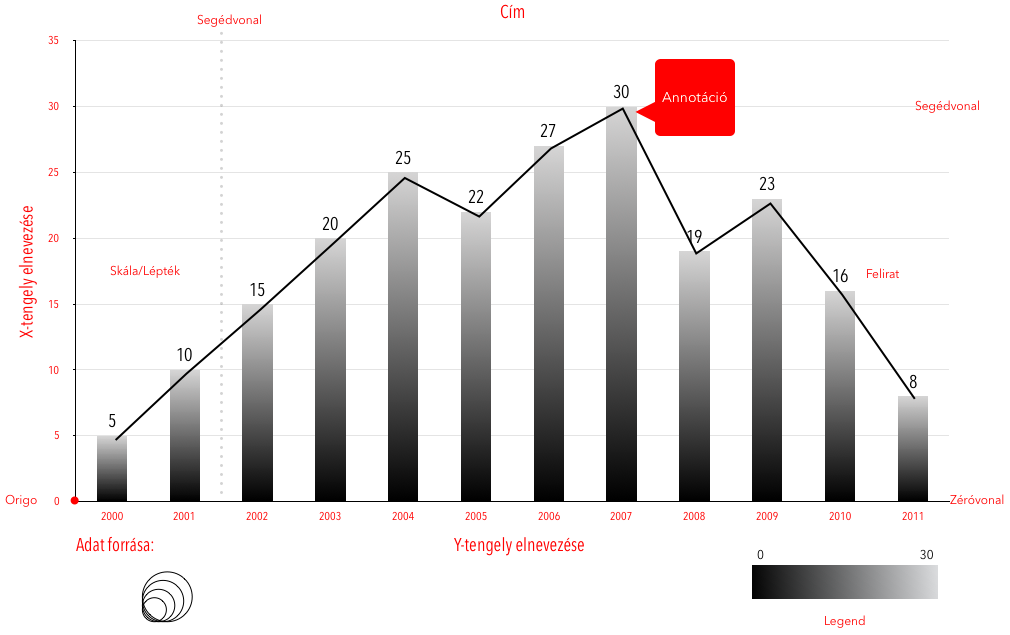
axis y
data source:
scale
axis x
grid
title
Annotation
grid
zero line
label
Data/Ink ratio

frame?
sequential colouring?
fonttype difficult to read?
contour?
jailhouse grid?
pictorial background?
Data/Ink ratio

Colours

hue
saturation
luminance

warm
cool
saturation

category
grouping
highlighting
ordering
distribution
Display
Display

Introduction to data visualization and data design
By Attila Bátorfy


