Urban energy vulnerability index assessment at building level
2025


Presenter: G. Mor
Collaborators: J.M. Broto, M. Sellart, A. Pariente, A. Deserteaux, A. Comas, A. Marí, J. Cipriano
Urban energy vulnerability index assessment at building level
Introduction
Urban energy vulnerability index assessment at building level
Energy vulnerability is a subjective combination of risk factors
in homes that can lead to energy poverty:
- Technological
- Social
- Economical
- Physical
What is energy vulnerability?
/ Introduction
Urban energy vulnerability index assessment at building level
Technological factors:
Issues related to outdated or inefficient technology within households, such as old appliances or inadequate insulation, contribute to energy poverty.
(Typology of the HVAC systems, domestic appliances, and their usage)
What is energy vulnerability?
/ Introduction
Urban energy vulnerability index assessment at building level
Social Factors:
Socioeconomic circumstances, including income levels, household size, and social support networks, play a significant role in determining vulnerability to energy poverty.
(Population and households characteristics, health conditions)
What is energy vulnerability?
/ Introduction
Urban energy vulnerability index assessment at building level
Economic Factors:
Financial constraints, such as high energy costs relative to income or inability to afford energy-efficient upgrades, exacerbate the risk of energy poverty for households.
(Household prices, salary indexes, energy costs, CPI)
What is energy vulnerability?
/ Introduction
Urban energy vulnerability index assessment at building level
Physical Factors:
Extreme weather events, seasonal variations in energy demand, and inadequate climate control measures can increase vulnerability to energy poverty, especially in regions prone to harsh climates.
Physical attributes of the building, such as its age, construction quality, and energy efficiency features, influence energy consumption and vulnerability to energy poverty among occupants.
(Building envelope characteristics, weather conditions, air conditions)
What is energy vulnerability?
/ Introduction
/ Introduction
How to assess the vulnerability of citizens?
-
Through the implementation of a methodology that integrates:
- Energy thermal building-stock modelling
- Weather model to upscale mesoscale resolution to microlocal
- Integration of interdisciplinary and highly heterogeneous data sources
- Harmonisation of the datasets in a common database framework
- Calculation and estimation of Key Performance Indicators (KPIs) related to each building
- Visualization of KPIs over a web interface
Urban energy vulnerability index assessment at building level
/ Introduction
What is CLIMATE READY BARCELONA?
- ICLEI Action Fund 2.0 project (Budget: 1,000,000 €)
- Support citizens and public authorities to anticipate and adapt to climate-change effects and the energy crisis
- Implemented from July 2023 to June 2025
- Partners: Ecoserveis, ABD, BitGenoma, CIMNE, Barcelona City Council


Urban energy vulnerability index assessment at building level
Urban energy vulnerability index assessment at building level
General architecture
Urban energy vulnerability index assessment at building level
Data platform for the vulnerability map
/ General architecture

Urban energy vulnerability index assessment at building level
Data
Urban energy vulnerability index assessment at building level
Cadaster:
- Attributes: Geometry, built areas, number of floors, number of dwellings, main usage
- Geolocation level: Building
- Source: National Cadaster datasets harmonised to INSPIRE (link) and CAT file (link)
- Format: Vectorial file (GML)
Datasets considered
/ Data
- Attributes: Energy demand, consumption, performance qualification, thermal systems and envelope characteristics
- Geolocation level: Dweling/Building
- Source: Catalonia Open Data Platform (link)
- Format: Parquet
Energy Performance Certificates:
Urban energy vulnerability index assessment at building level
- Attributes: 2017 consumption, number of metering devices, street name and street number
- Geolocation level: Building (when more than 3 metering devices)
- Source: Barcelona Metropolitan Area
- Format: Excel file (XLSX)
Datasets considered
/ Data
- Attributes: 2022-2023 monthly consumption, number of metering devices, street name and street number
- Geolocation level: Building (when more than 3 metering devices) located in specific postal codes. (~7000/69000 buildings)
- Source: e-distribución
- Format: Excel file (XLSX)
Annual electricity consumption:
Monthly electricity consumption:
Urban energy vulnerability index assessment at building level
- Attributes: 2017-2023 annual consumption, number of metering devices, street name and street number
- Geolocation level: Building
- Source: Barcelona Metropolitan Area and Nedgia
- Format: Excel file (XLSX)
Datasets considered
/ Data
- Attributes: 2019-2024 average hourly consumption, economic sector, tariff
- Geolocation level: postal code
- Source: Datadis
- Format: JSON through API
Annual gas consumption:
Aggregated daily load pattern of electricity consumption:
Urban energy vulnerability index assessment at building level
- Attributes: 2008-2024 temperature, humidity, wind speed, GHI...
- Geolocation level: ~10 km grid
- Source: COPERNICUS (Dataset: ERA5Land)
- Format: GRIB
Datasets considered
/ Data
- Attributes: 2008-2024 temperature, humidity, wind speed, GHI...
- Geolocation level: ~5 km grid
- Source: MeteoGalicia (Thredds server)
- Format: NetCDF
Mesoscale historical weather data:
Mesoscale forecasted weather data:
Urban energy vulnerability index assessment at building level
- Attributes: 2008-2017 temperature, humidity, wind speed
- Geolocation level: 100m grid
- Source: COPERNICUS (Dataset: UrbClim)
- Format: NetCDF
Datasets considered
/ Data
- Attributes: incomes, incomes sources, demography stats, population, ...
- Geolocation level: Census tract, district or municipal
- Source: INE (Spanish National Statistics Institute)
- Format: Parquet
Hyper-detailed historical weather data:
Socio-economic indicators:
Urban energy vulnerability index assessment at building level
Climate Shelters:
- Attributes: name, type of building, time schedule, creation date...
- Geolocation level: Building
- Source: OpenDataBCN (link)
- Format: Comma-separated Values file (CSV)
Datasets considered
/ Data
Postal code administrative layer:
- Attributes: Geometry, postal code
- Geolocation level: postal code
- Source: Spanish postal codes (link)
- Format: Vectorial file (KML)
Urban energy vulnerability index assessment at building level
Census tracts administrative layer:
- Attributes: Geometry, census tract code
- Geolocation level: Census tract
- Source: INE (link)
- Format: Vectorial file (GPKG)
Datasets considered
/ Data
Districts administrative layer:
- Attributes: Geometry, district names and code
- Geolocation level: District
- Source: INE (link)
- Format: Vectorial file (SHP)
Urban energy vulnerability index assessment at building level
Municipalities administrative layer:
- Attributes: Municipality name and code
- Geolocation level: Municipality
- Source: INE (link)
- Format: Vectorial file (SHP)
Datasets considered
/ Data
Neighbourhood administrative layer:
- Attributes: Neighbourhood name and code
- Geolocation level: Neighbourhood
- Source: OpenDataBCN (link)
- Format: Comma-separated Values file (CSV)
Urban energy vulnerability index assessment at building level
- Attributes: Vegetation Index
- Geolocation level: 1m-grid
- Source: ICGC (link)
- Format: Raster File (TIFF)
Datasets considered
/ Data
Tourism-related establishments:
- Attributes: Location, type of establishment, category, total capacity and stat
- Geolocation level: Building
- Source: Catalan Government
- Format: Excel file (XLSX)
Normalised Difference Vegetation Index (NDVI):
Urban energy vulnerability index assessment at building level
Digital Elevation Model (DEM):
- Attributes: Average sea-level
- Geolocation level: 30m-grid
- Source: COPERNICUS
- Format: Raster File (TIFF)
Datasets considered
/ Data
- Attributes: Type of establishment, activity and status
- Geolocation level: Building
- Source: OpenDataBCN (link)
- Format: JSON through API
Ground-floor premises census for economic activity:
Urban energy vulnerability index assessment at building level
Buildings Technical Inspections:
- Attributes: Description of the building, equipment, defects and deficiencies
- Geolocation level: Building
- Source: Gencat
- Format: XML file
Datasets considered
/ Data
Mortality and morbidity due to extreme heat events:
- Attributes: 2018-2023 mortality indexes, number of people attended in primary care...
- Geolocation level: Health basic area (Similar to districts)
- Source: PADRIS office of the Catalan Government
- Format: Comma-separated Values file (CSV)
Urban energy vulnerability index assessment at building level
Datasets considered
/ Data
- Attributes: Information gathered through the vulnerability surveys in LaMevaEnergia APP
- Geolocation level: Building
- Source: La Meva Energia APP
- Format: JSON file through API
Building-aggregated vulnerability surveys:
Urban energy vulnerability index assessment at building level
All these highly heterogenous datasets conform the Knowledge Graph of the project.
Ingestion processes
Manually or periodically executed
Reading from webs, files, external databases or APIs
Implemented in Python scripts
Harmonisation processes
All ingested datasets go through a transformation process to align them to the BIGG ontology
Store the data to the databases
Implemented in Python and using RML.io functionalities.
Ingestion to Database
/ Data
Urban energy vulnerability index assessment at building level
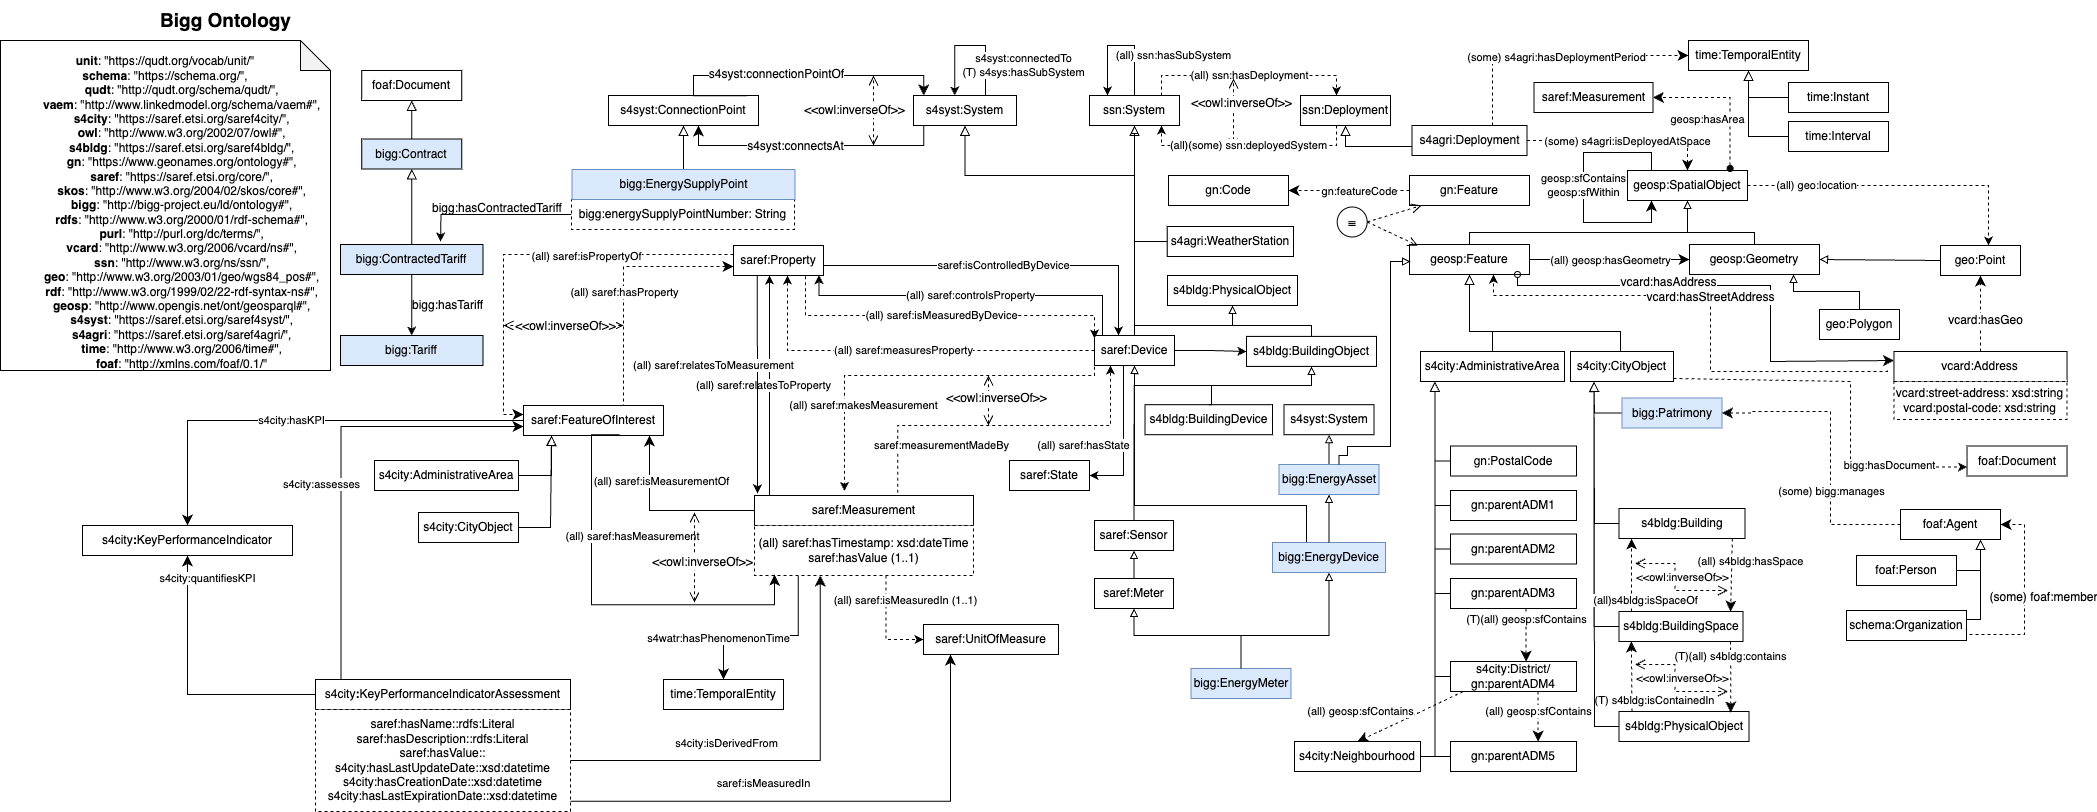
BIGG: an ontology to rule them all
/ Data
Urban energy vulnerability index assessment at building level
BIGG: Reusing Ontologies
/ Data
- saref, s4blg, s4city, s4agri:
- buildings, devices
- ssn:
- systems, deployments
- geosp:
- geolocation
- qudt:
- units
Challenges and Benefits of Reusability and Inference in the Urban Modeling Context
Urban energy vulnerability index assessment at building level
BIGG: Reusability
/ Data
Challenges and Benefits of Reusability and Inference in the Urban Modeling Context
- We realized that we need reused ontology to take profit of the advantages that offer ontologies.
- It also allow us to use it in many projects like: Bigg, Entrack, Eplanet, ClimateReady, Dedalus, Climres, infraestructuras, SIME... thanks to the flexibility of a well defined ontology.

Urban energy vulnerability index assessment at building level
Graph databases are not inherently mandatory when using data ontologies, but they can be highly beneficial in certain scenarios.
- Ontologies represent structured knowledge, emphasizing relationships between entities.
- Graph databases excel in modeling and querying complex relationships, making them a natural fit for ontological data.
Graph database
/ Data
Urban energy vulnerability index assessment at building level
Flexible Schema:
Graph databases allow for adaptable data models, accommodating evolving ontologies.
Efficient Relationship Representation:
Graph databases naturally model complex relationships, facilitating querying and traversal.
Scalability:
Graph databases efficiently handle large-scale ontologies, offering scalability as data grows.
Powerful Querying:
Graph databases provide robust querying capabilities, including traversing relationships effectively.
Semantic Reasoning:
Some graph databases support semantic reasoning, enabling inference and deduction based on
ontological data.
Graph database
/ Data
Urban energy vulnerability index assessment at building level
Neo4J for graph database management:
- It offers a flexible schema, efficient relationship representation
- Scalable and powerful querying capabilities
- It aligns perfectly with ontological requirements.
SHACL for data validation:
-
It enables us to specify constraints on our ontological data, ensuring
- Integrity
- Consistency
- Compliance with predefined rules.
Graph database
/ Data


Urban energy vulnerability index assessment at building level
Our research adopts a specialized time series database instead of integrating time series data directly into the graph database
Time series database
/ Data
Performance:
Finely tuned for storing and querying time-stamped data
They have indexing strategies for time-based queries, optimizing storage and retrieval.
Scalability:
Designed for handling massive time series data volumes efficiently, ensuring future scalability.
Build-in Functionalities:
Offers built-in functionalities like downsampling, aggregation, and windowing operations
Urban energy vulnerability index assessment at building level
Apache Druid for storing time series data:
- Open-source distributed data store for real-time analytics.
- Specialized for handling large volumes of time-stamped data.
- Features include real-time ingestion, columnar storage, and scalability.
- Provides fast query performance with SQL-like query language.
- Widely used for monitoring, ad hoc analysis, and operational intelligence.
Time series database
/ Data

Urban energy vulnerability index assessment at building level
- By segregating time series from other type of data, we maintain the graph database's focus on managing ontological relationships and complex network structures.
- This architectural choice ensures optimal performance, scalability, and maintainability, harnessing each database technology's strengths for its intended role.
Combination of graph and time series databases
/ Data
Urban energy vulnerability index assessment at building level
Modelling
Urban energy vulnerability index assessment at building level
Buildings Thermal Energy model
Simulation of the energy demand of buildings in the urban area, based on archetypes, construction types, local weather data and user behaviour patterns.
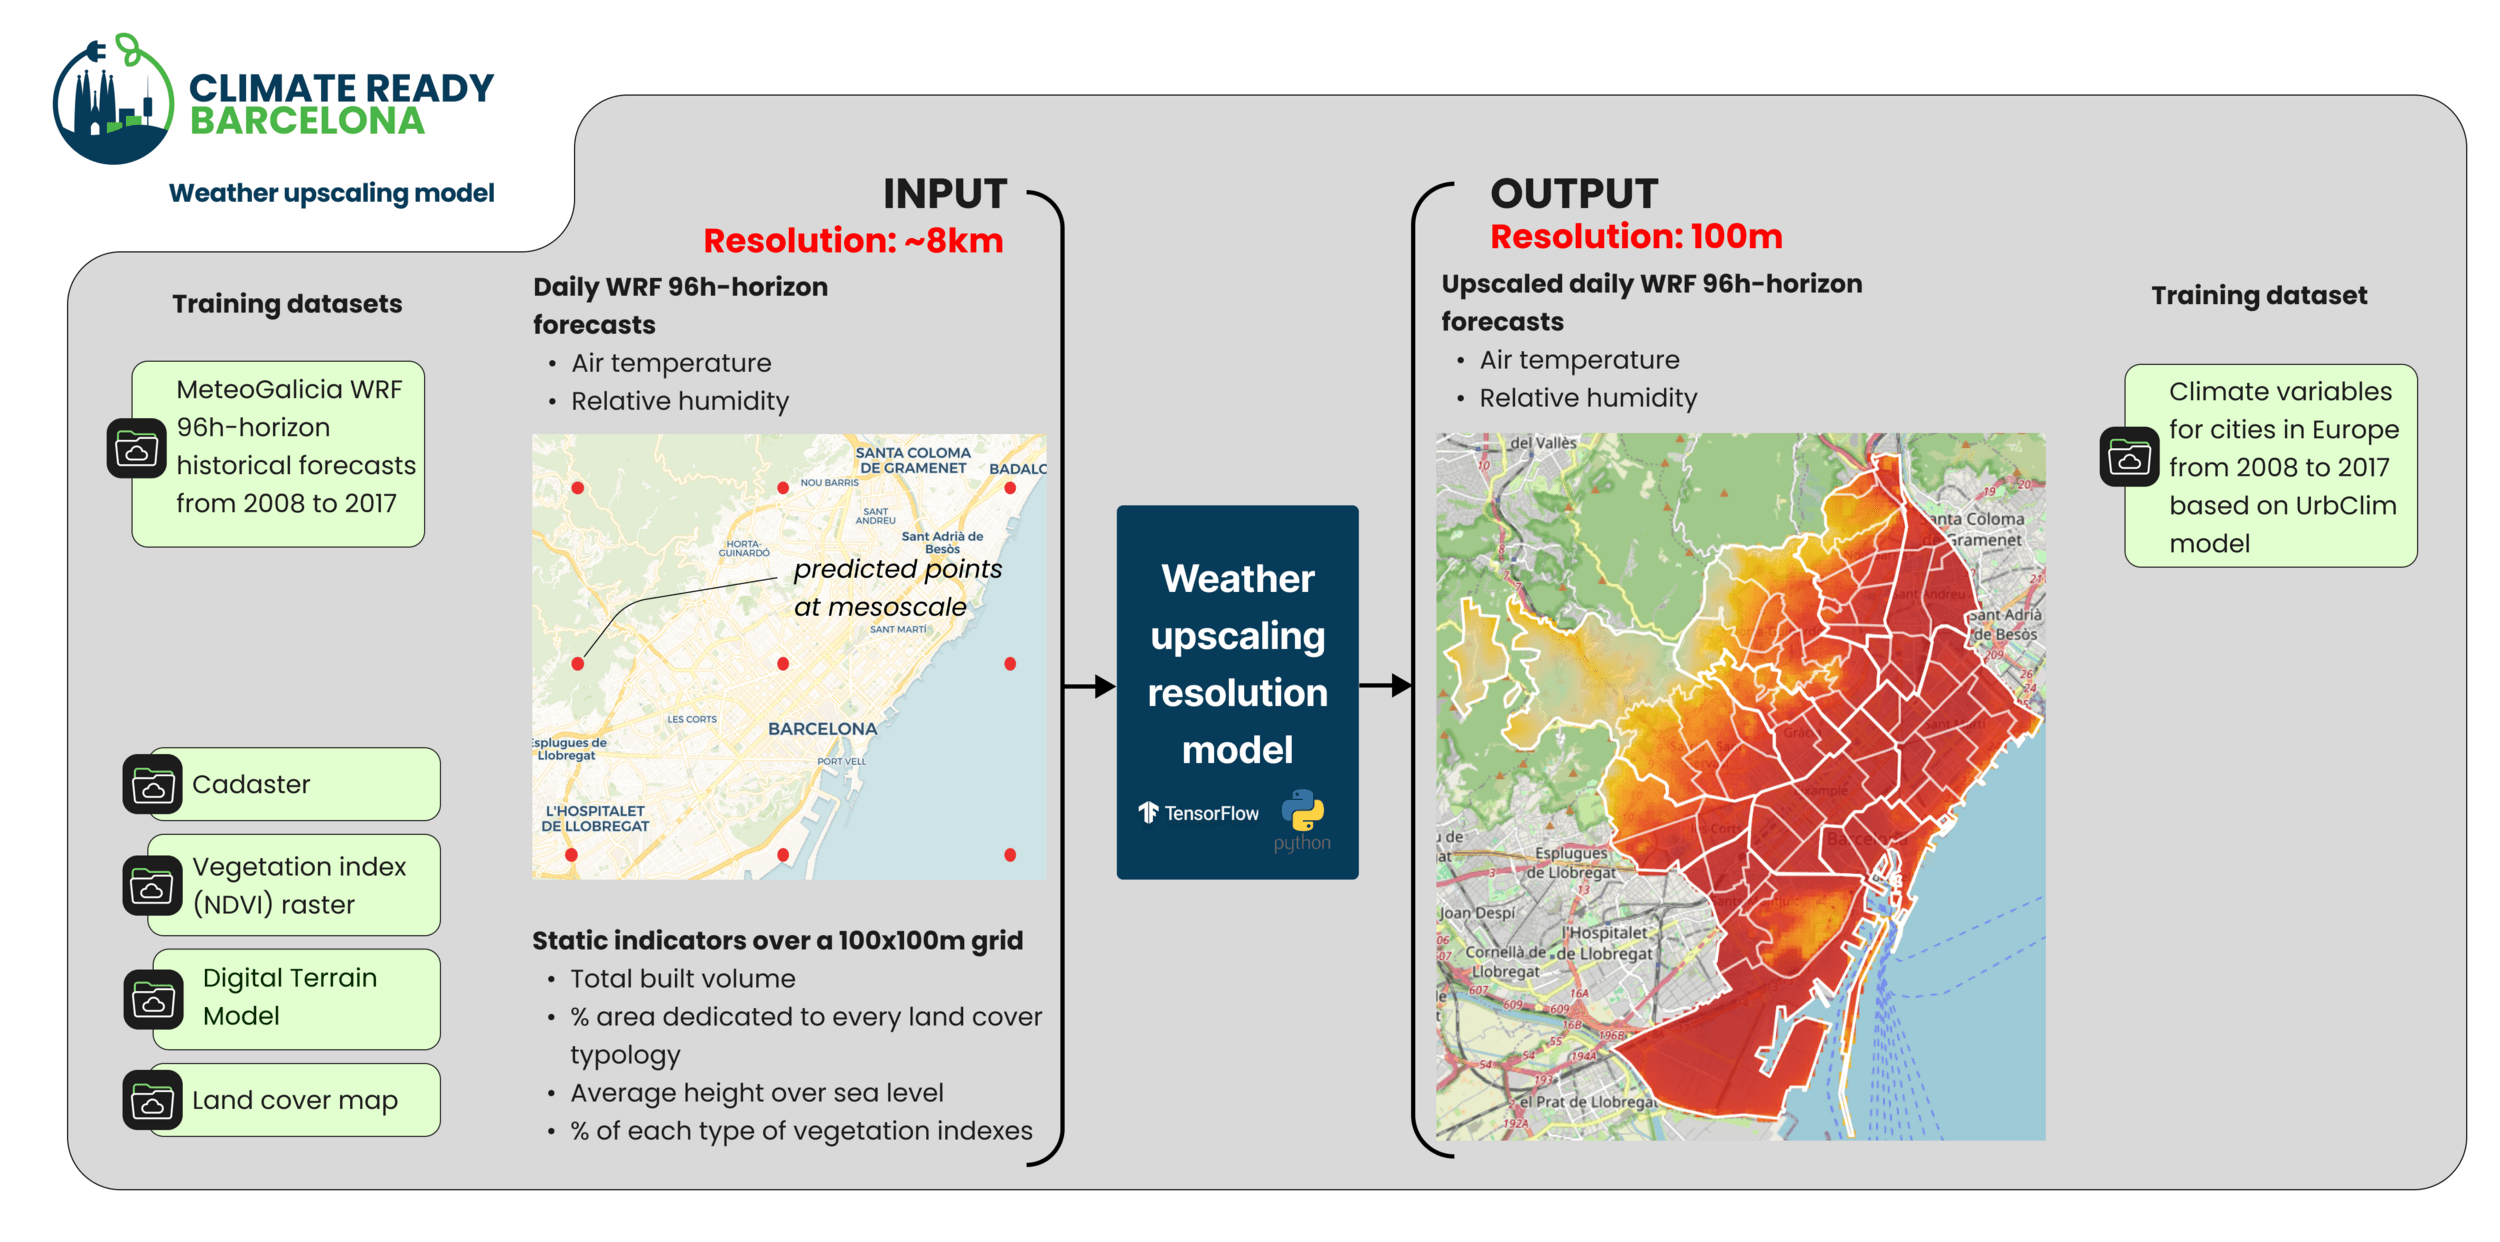
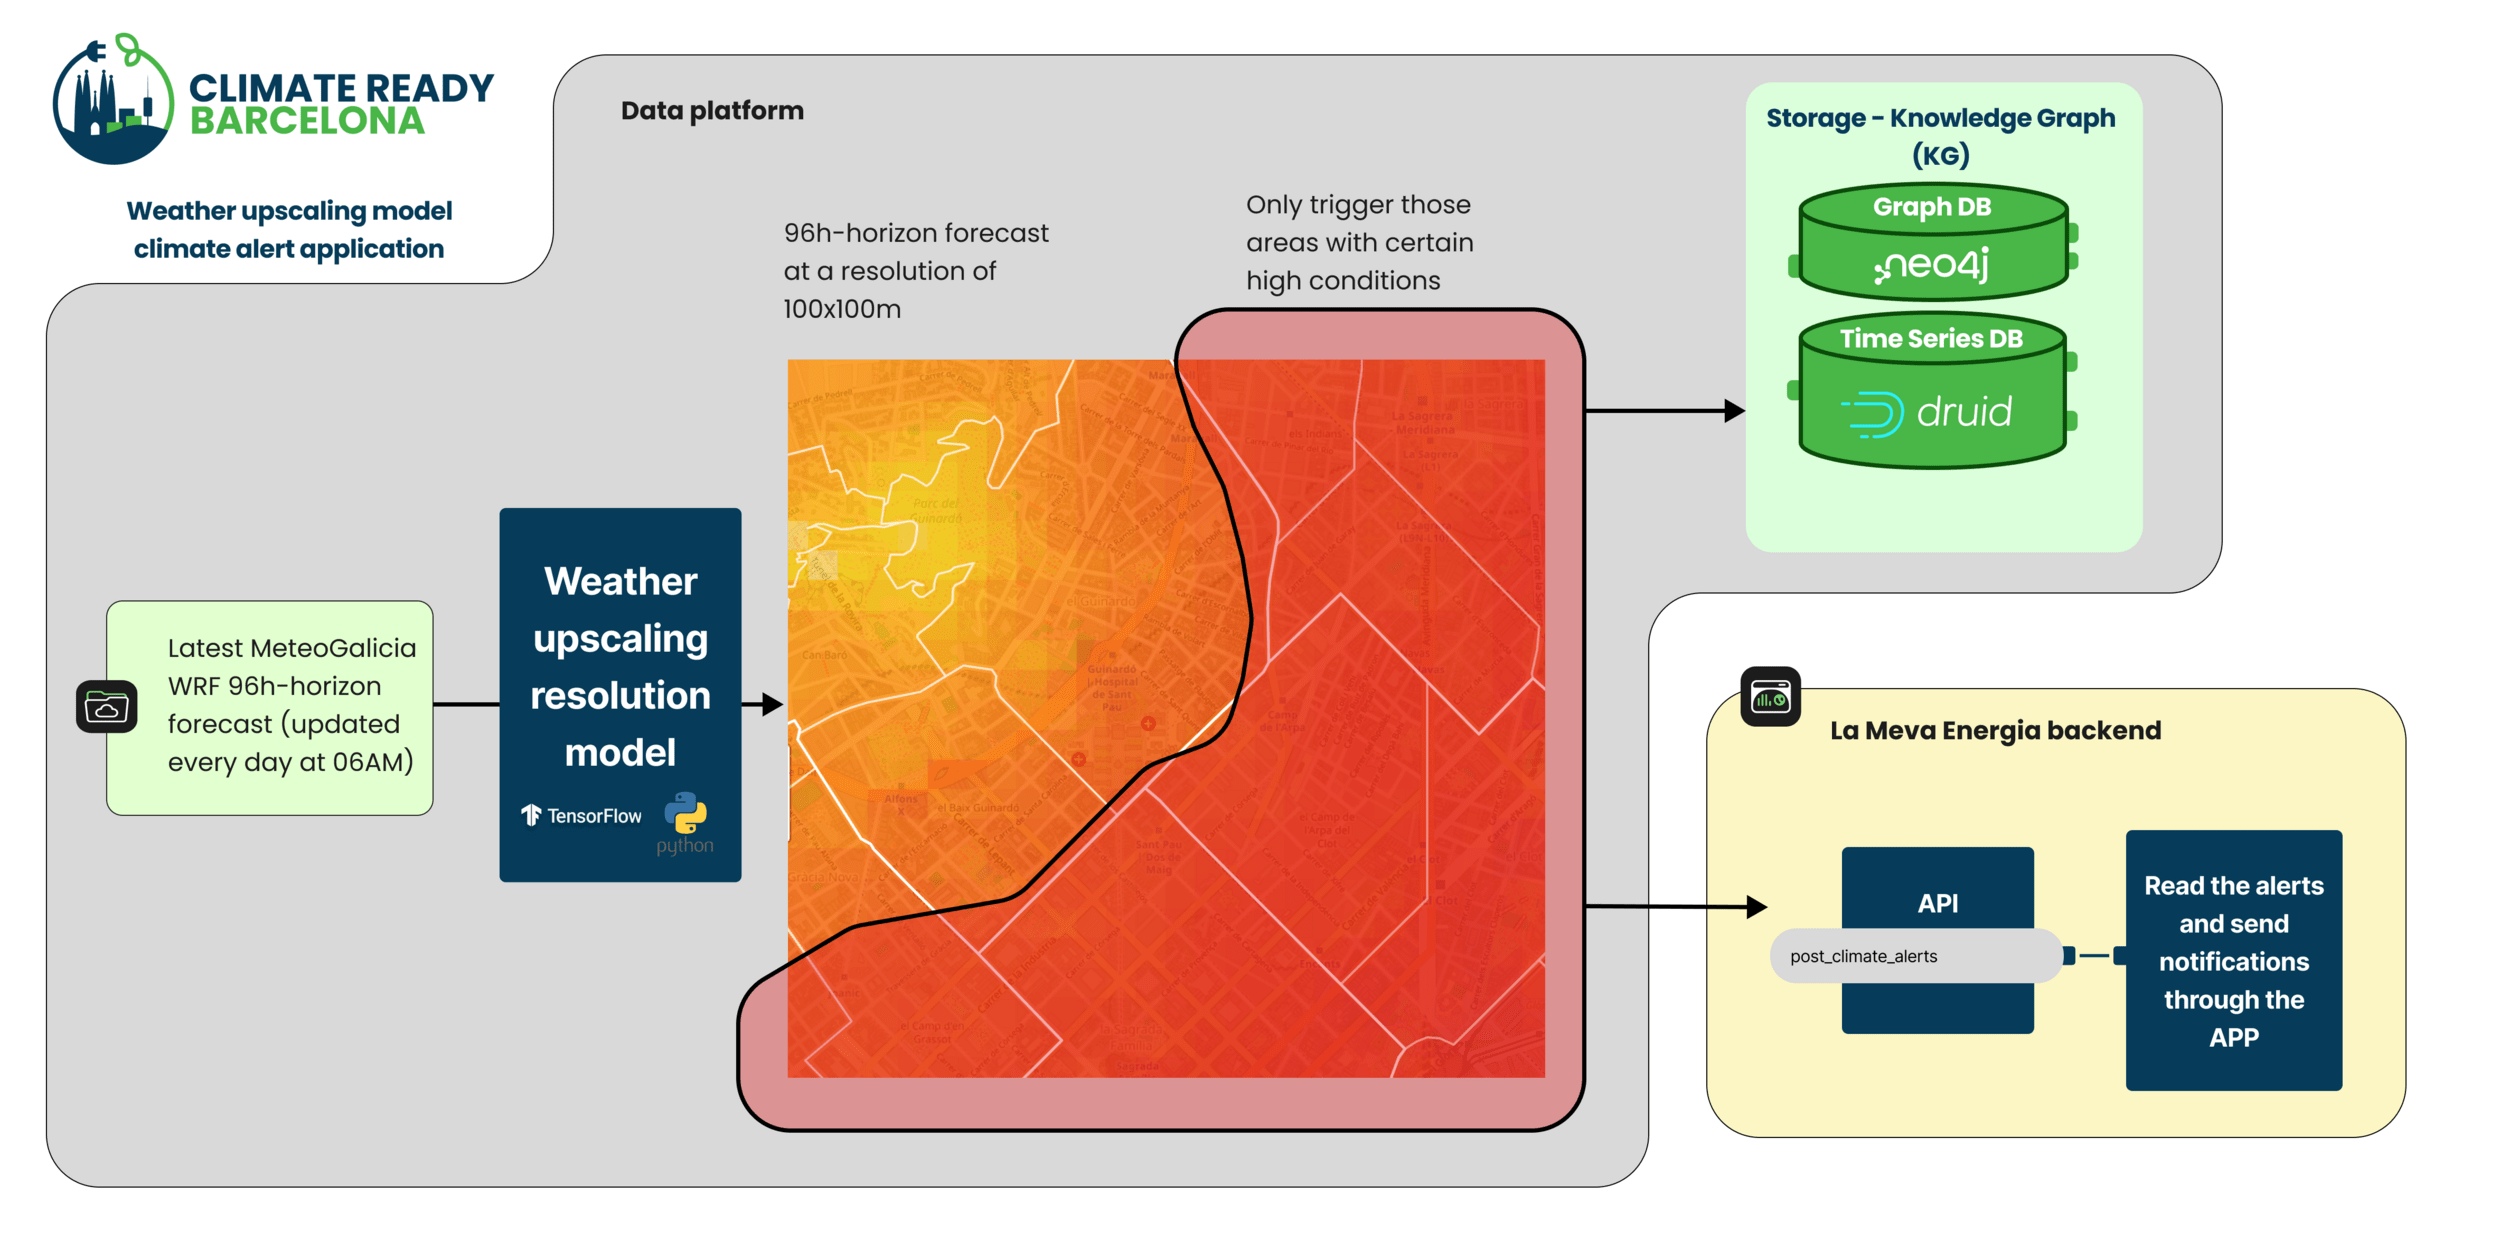
Weather upscaling resolution model
Prediction model to upscale meteorological data from mesoscale to microscale.
Graph Neural Network
General model to predict indicators at building level based on real measurements, location of buildings and their relation among several aggregation layers.
Multifaceted Models: Diverse Objectives
/ Modelling
Urban energy vulnerability index assessment at building level
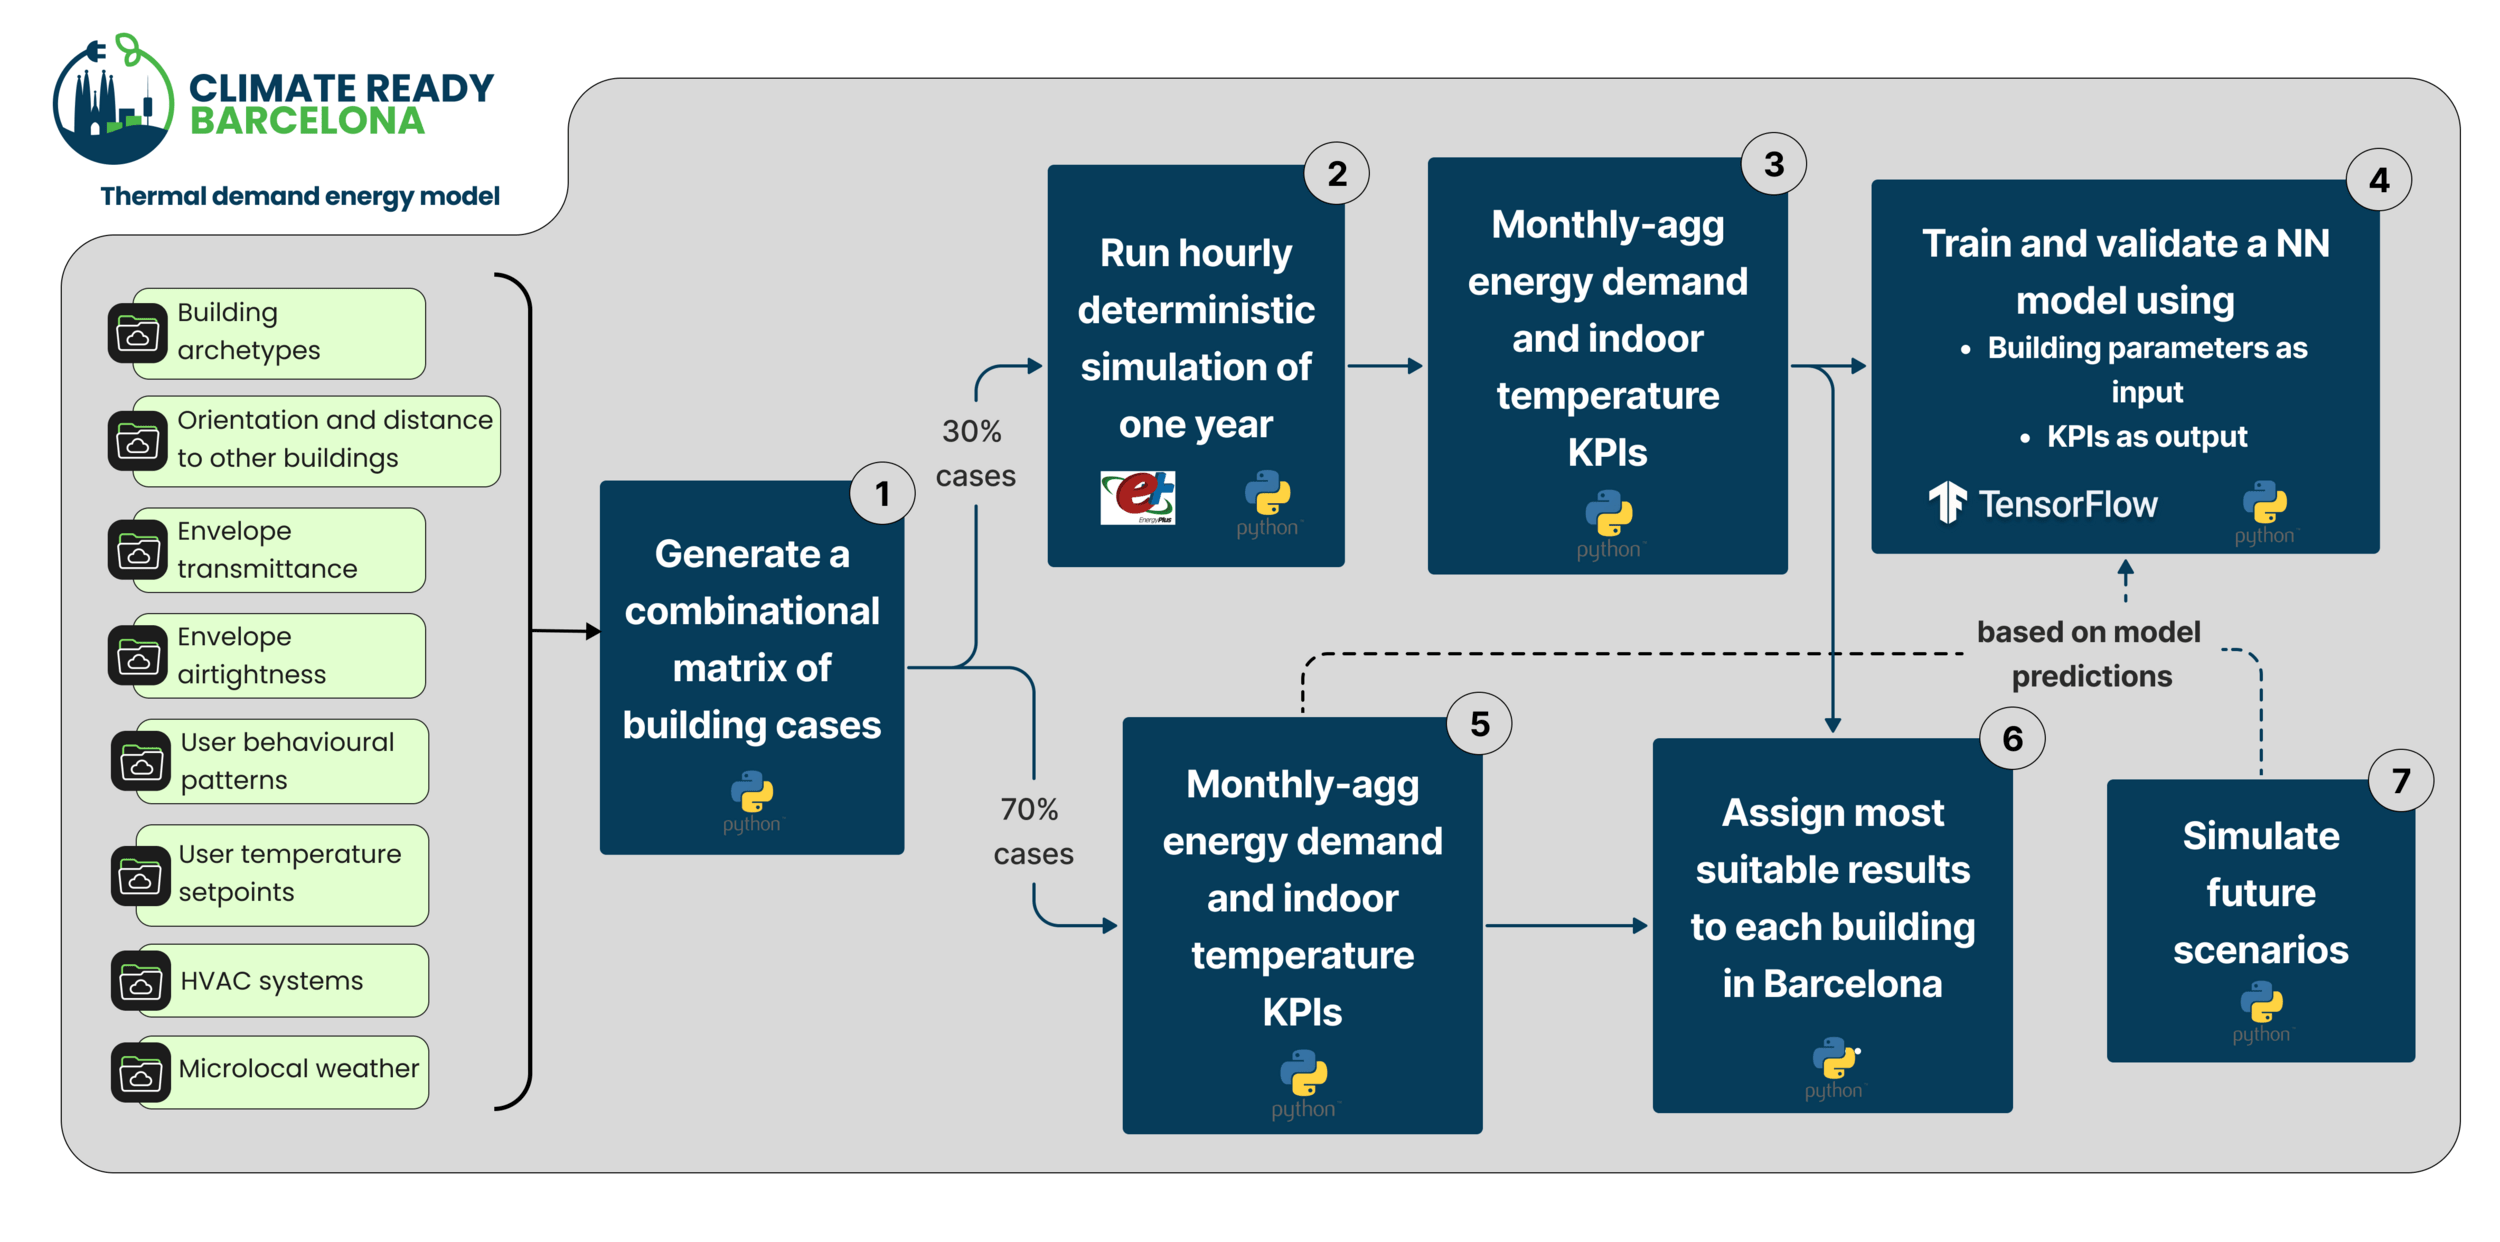
Thermal demand energy model (using IREC's RC models)
/ Modelling
- 61670 buildings with main or partial residential use (88.7% all BCN buildings)
- Buildings with only residential use:
- Plurifamiliar ≥ 32 dwellings: 1512 (2.45%)
- Plurifamiliar when 32 > dwellings ≥ 12: 8474 (13.75%)
- Plurifamiliar when dwellings < 12: 23345 (37.85%)
- Unifamiliar: 2694 (4.37%)
- Buildings with partial residential use:
- Plurifamiliar ≥ 32 dwellings: 4278 (6.93%)
- Plurifamiliar when 32 > dwellings ≥ 12: 11418 (18.51%)
- Plurifamiliar when dwellings < 12: 9781 (15.87%)
- Unifamiliar: 168 (0.27%)
- Buildings with only residential use:
SHORT TERM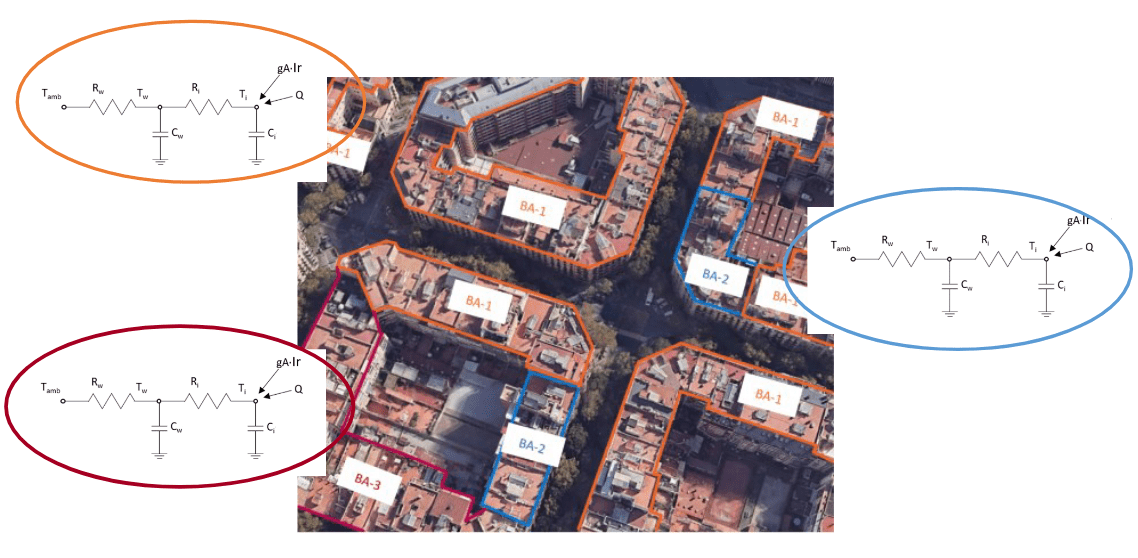
Cooling and heating demand simulation based on a calibrated Resistance and Capacitance Model per each building archetype, which is an electric circuit that imitates in a simplified manner the thermal dynamics of a building.
Urban energy vulnerability index assessment at building level
Thermal demand energy model (using IREC's RC models)
/ Modelling
- Building characteristics:
-
Context of nearby buildings
-
Number of dwellings
-
Built area per uses
-
Effective year of construction
-
Category / economic value
-
Typology
-
-
Thermal energy systems
- Most feasible system
- Weather conditions:
- Microlocal weather file
- Demographics and socioeconomics*:
- People per household
- Incomes (sources and annual amount)
- Age range
- Rental Housing Price Index
(*aggregated to census tract or district)
SHORT TERMAlign each building to one of RC model archetypes
Urban energy vulnerability index assessment at building level
Thermal demand energy model (using IREC's RC models)
/ Modelling
-
Model objective
- Characterise actual situation of buildings,
- Any retrofitting scenario will be evaluated
- Calculate Monthly KPIs:
-
Energy demand
- Set-point heating temperatures: 19, 20, 21, 22ºC.
- Set-points cooling temperatures: 26, 27, 28, 29ºC
-
Final energy consumption (assuming most feasible HVAC system)
- Energy demand * System performance
- % Indoor Overheating Hours (during summer in FF conditions, natural ventilating during nights)
-
Energy demand
- Characterise actual situation of buildings,
SHORT TERMUrban energy vulnerability index assessment at building level
Thermal demand energy model (using UConcordia simulation framework)
/ Modelling
1 - Select a subset of real buildings and their context
2 - Define building envelopes archetypes according to building code
3 - Define user behaviour patterns according to demographics and socioeconomic profiles
4 - Define building systems archetypes according to EPC and cadastral data
5 - Define microlocal weather input files
LONG TERMUrban energy vulnerability index assessment at building level
Weather upscaling model
/ Modelling
Urban energy vulnerability index assessment at building level
Weather upscaling model
/ Modelling
Urban energy vulnerability index assessment at building level
SKG: Simplified Knowledge Graph
/ Modelling
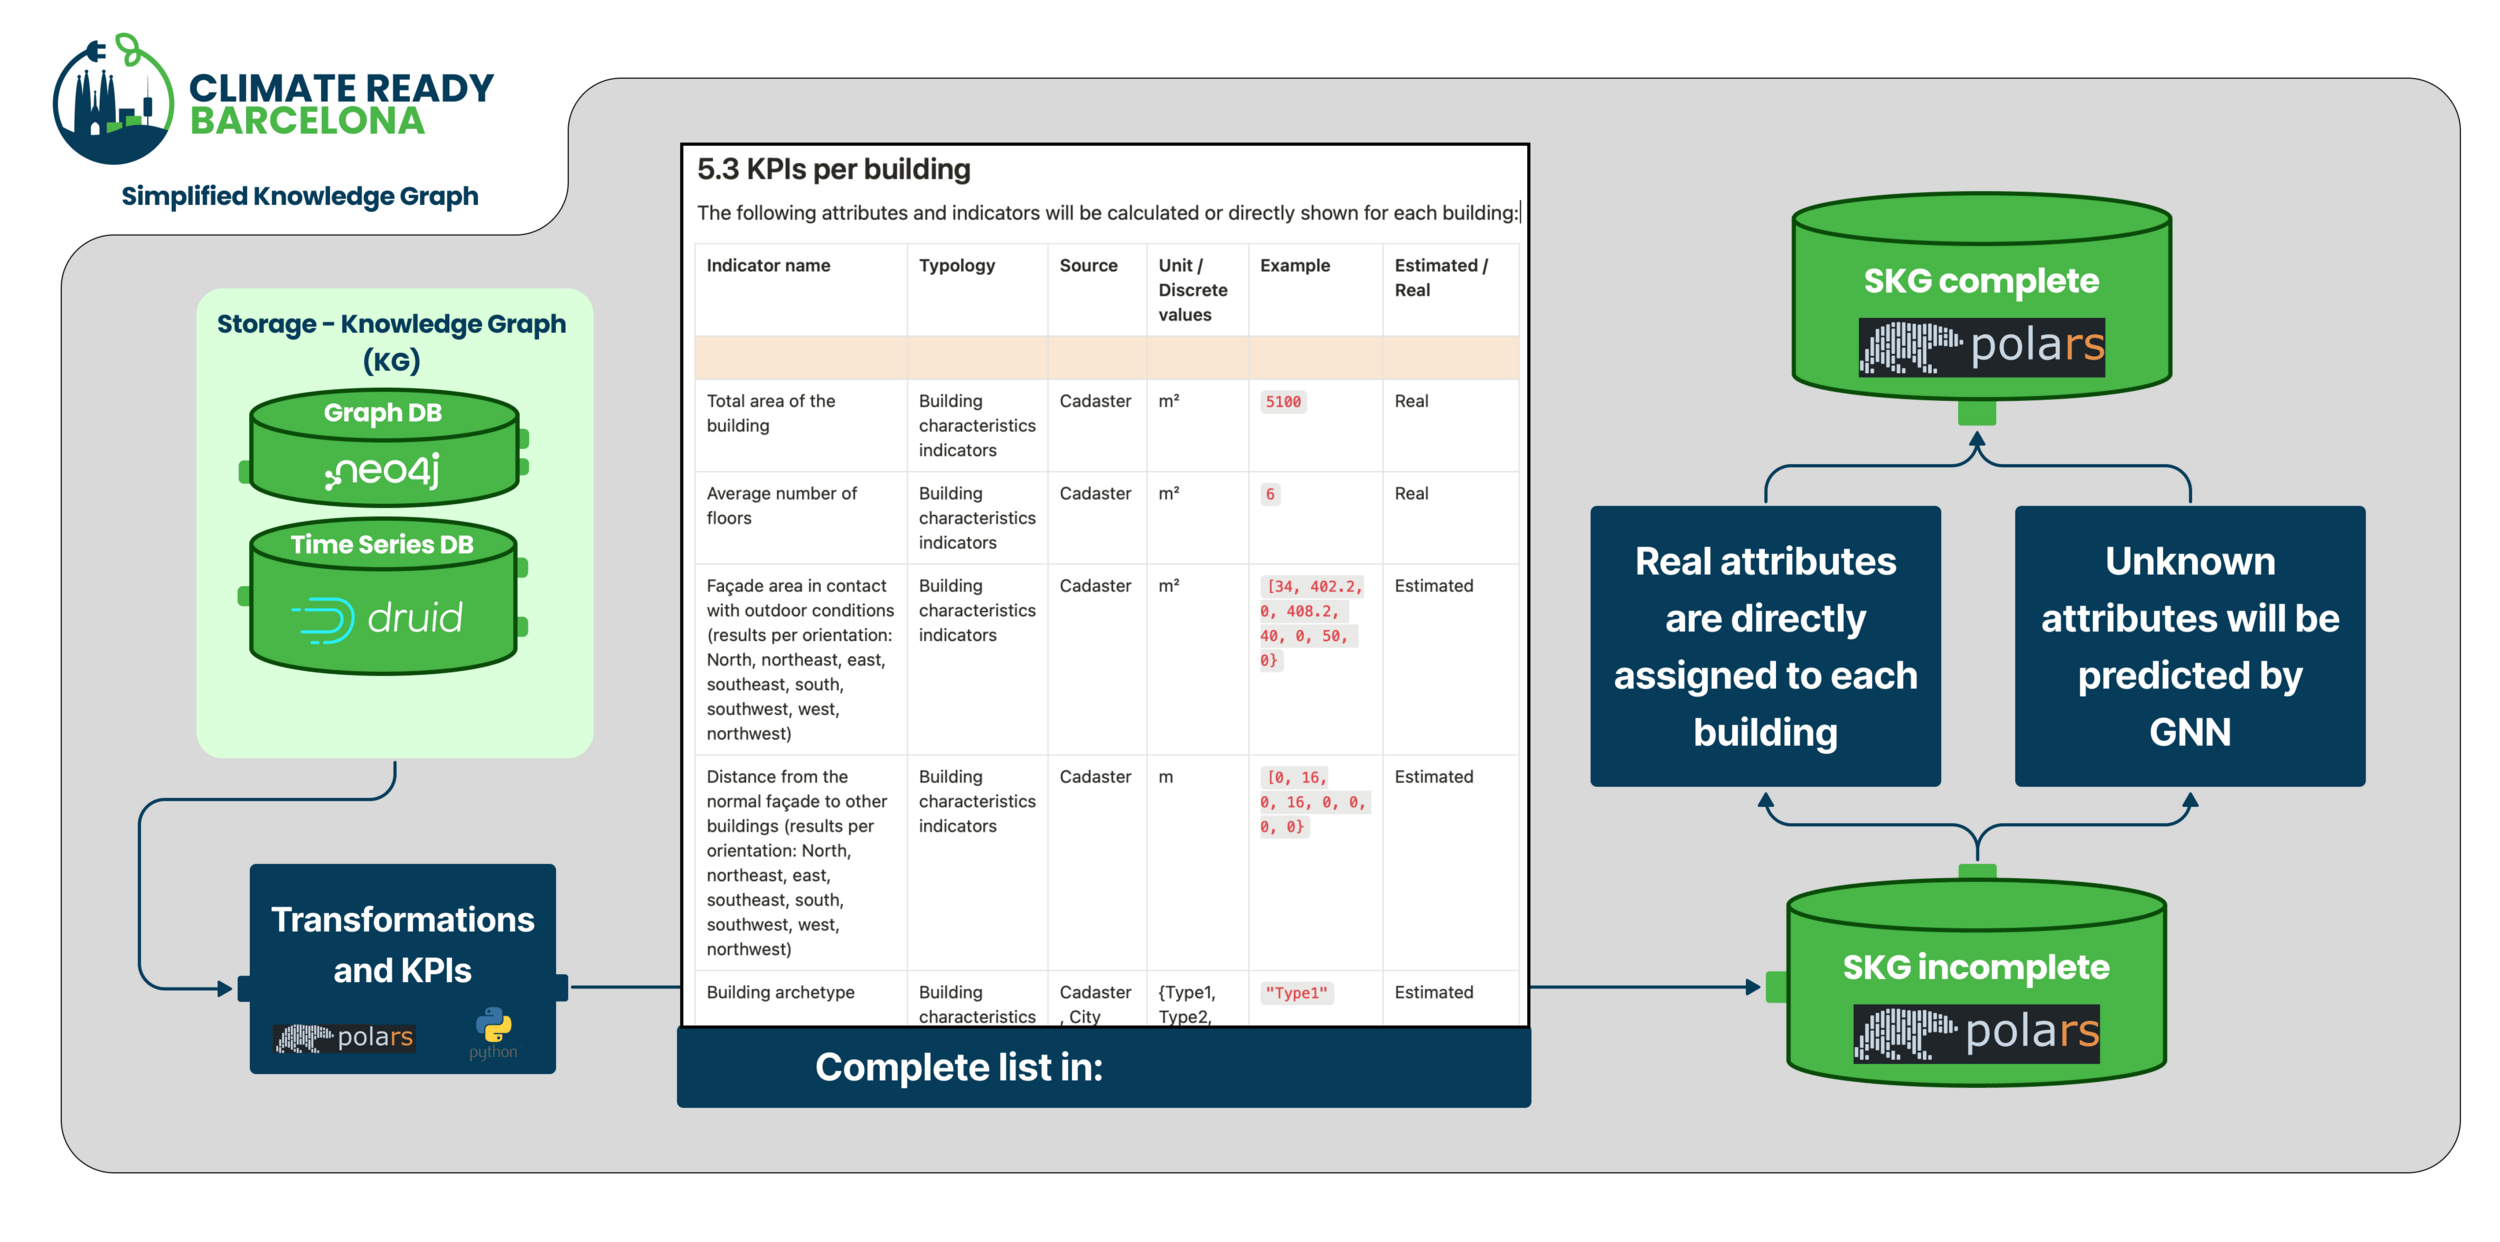
Link (section 5.3)
Urban energy vulnerability index assessment at building level
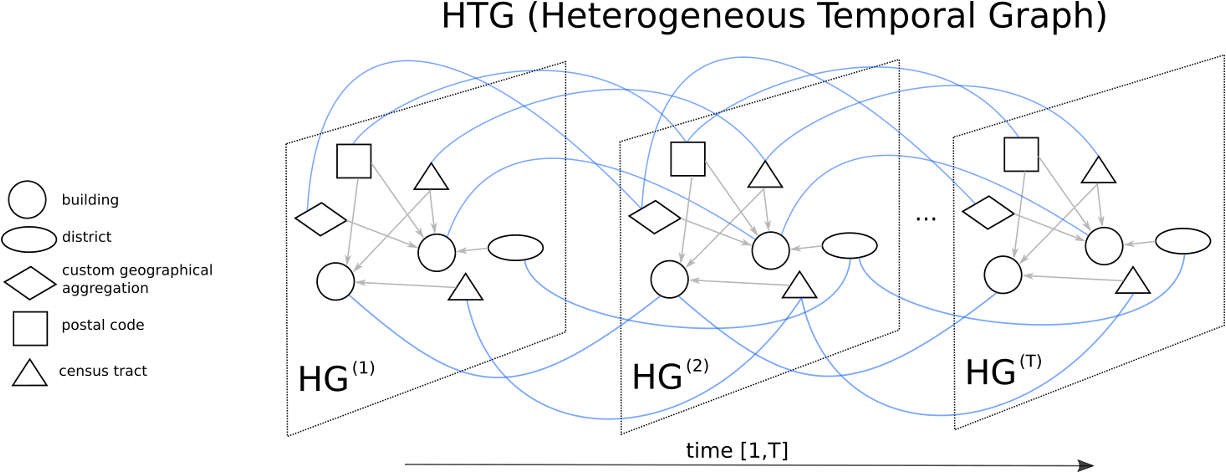
Graph Neural Network: prediction and simulation
/ Modelling
Data communication and visualisation
Urban energy vulnerability index assessment at building level
Interoperability: DataAPI
/ Data communication and visualisation
Urban energy vulnerability index assessment at building level


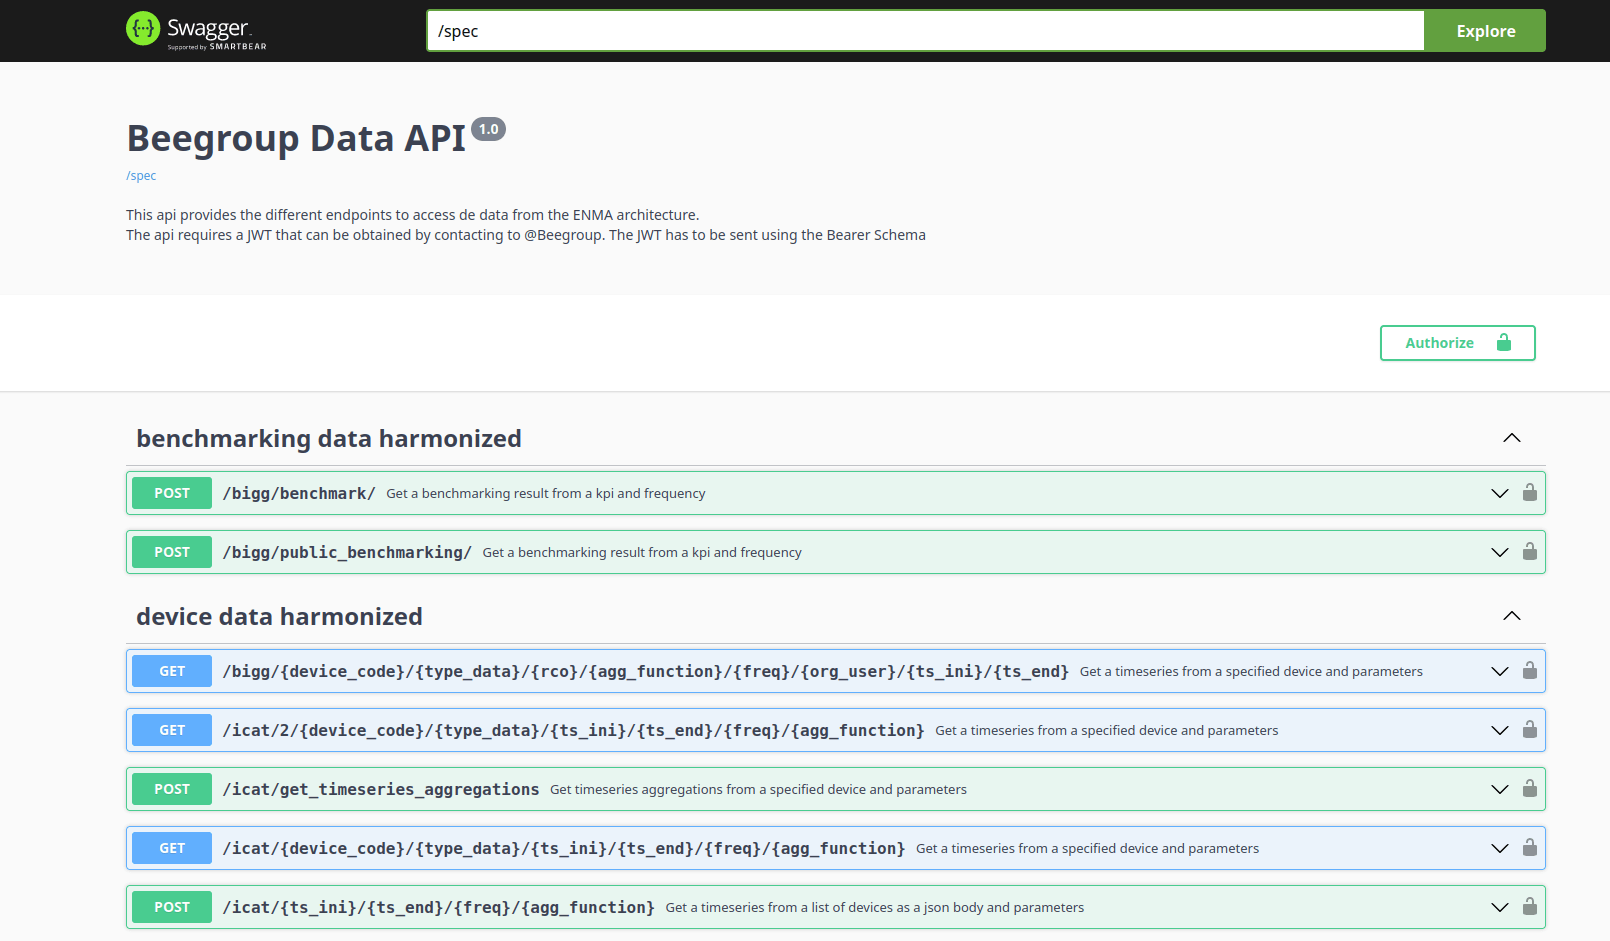

- Tailored endpoints for adaptation to wide-range of application use cases
- Authenticated access
- Optimized for quick and reliable data access.
- It runs on kubernetes:
- DataAPI diagram endpoints:
- get_all_indicators
- get_indicator
- post_model_request
- get_model_request
- get_model_request_predictions
- login
Interoperability: DataAPI
/ Data communication and visualisation
Urban energy vulnerability index assessment at building level
- A Python library (streetmaps_ES) was developed to easily update a database with the Spanish municipalities street maps.
- Based on the latest street map version of the national cadaster (Link).
- Adding interesting metadata to each address: related postal code, census tract, neighborhood, district, parcel island, main usage of the building, and number of dwellings and floors in the building.
- This library is used across several project implementations:
- La Meva Energia: Geolocation of the buildings related to app users.
- Vulnerability map: In harmonisation processes that need to geolocate data
Interoperability: Common geolocation format
/ Data communication and visualisation
Urban energy vulnerability index assessment at building level
Urban energy vulnerability index assessment at building level
Data sharing with La Meva Energia
/ Data communication and visualisation

Urban energy vulnerability index assessment at building level
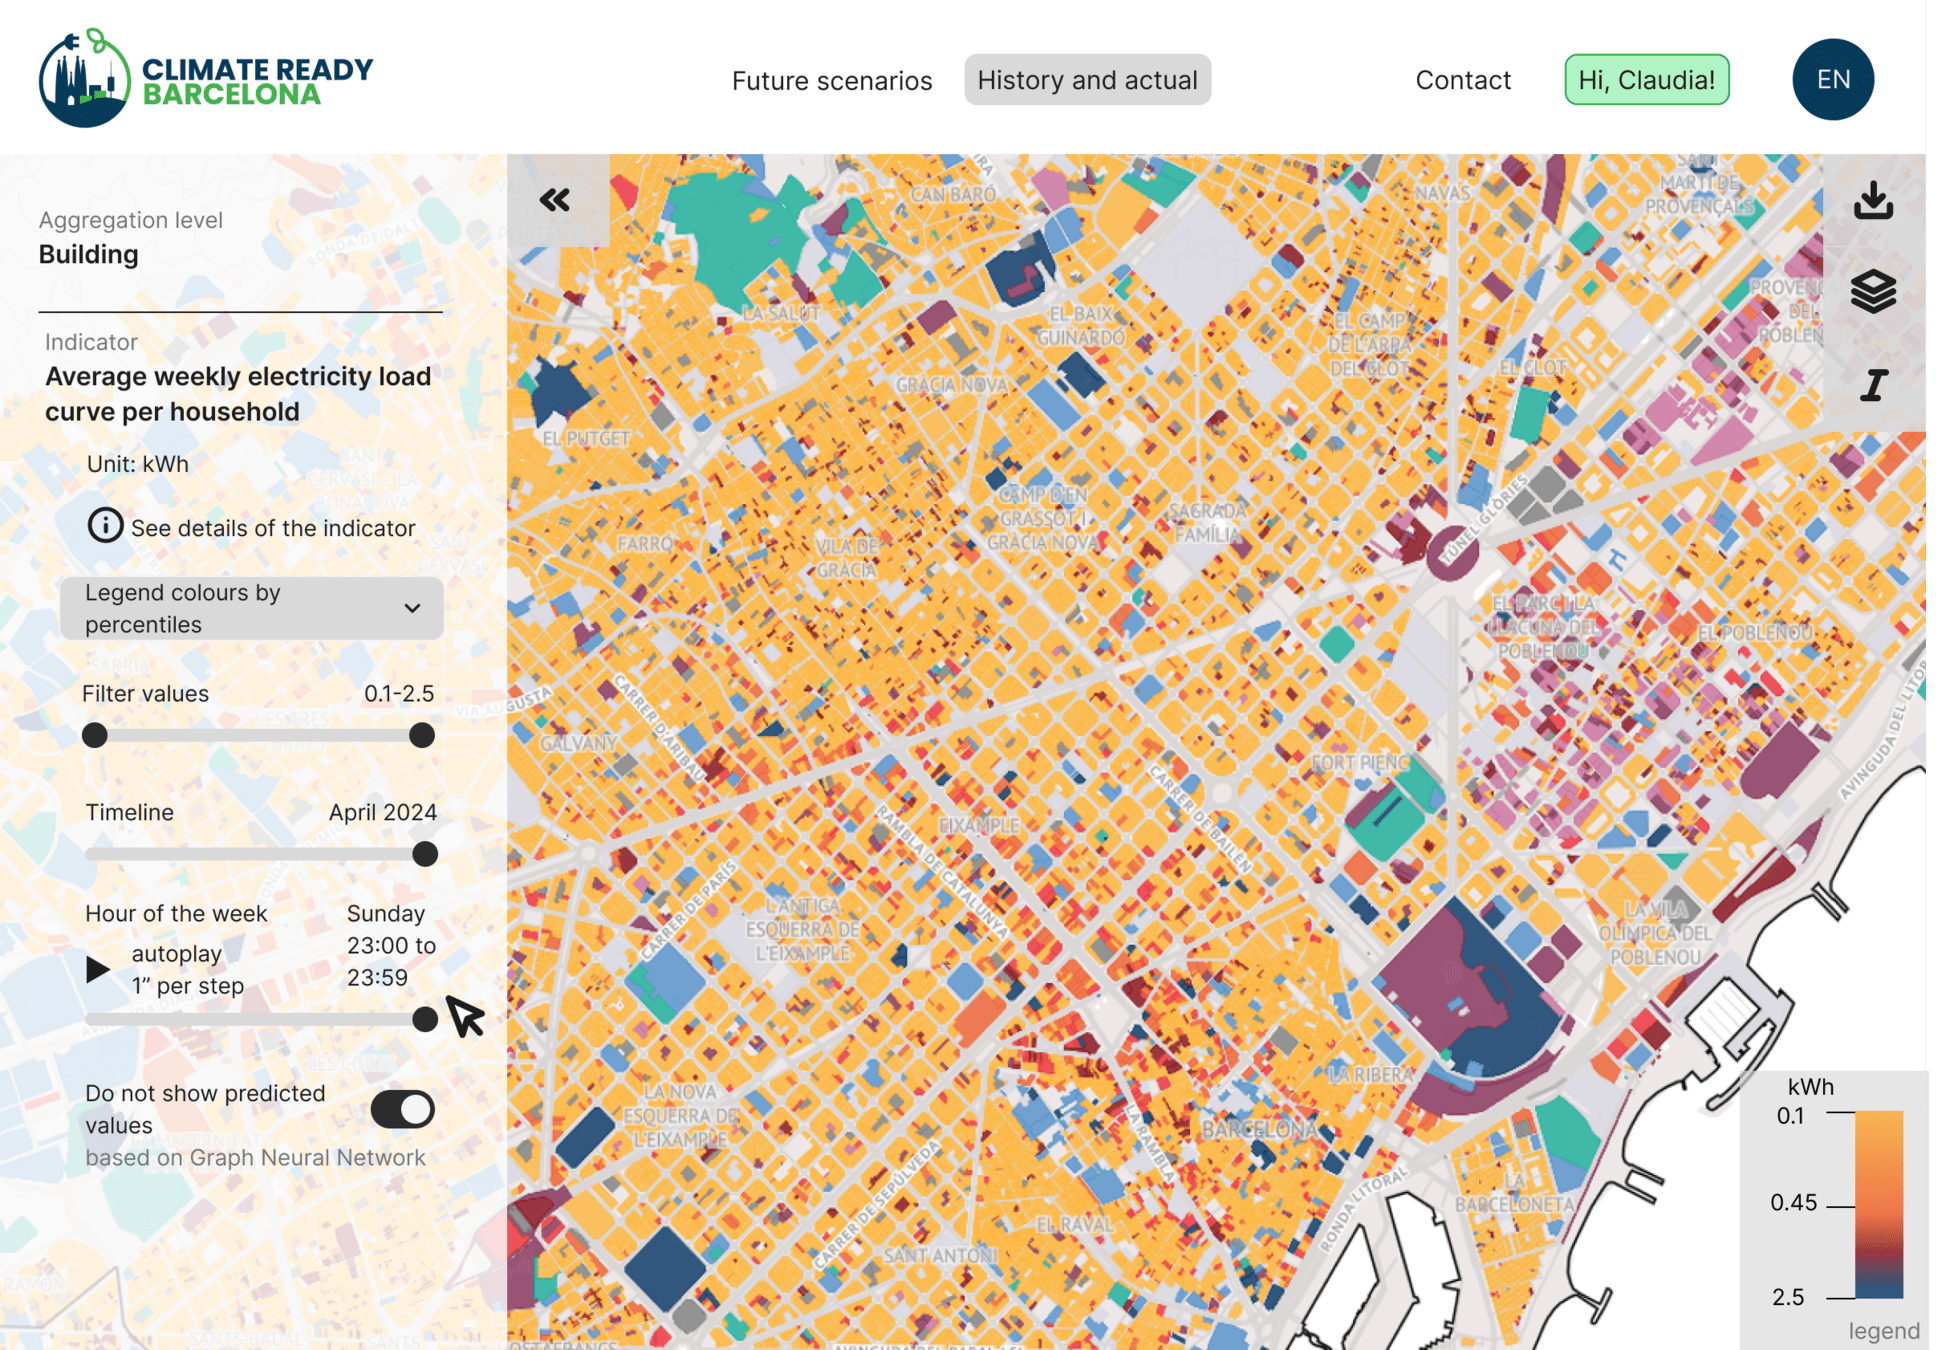
User interface
/ Data communication and visualisation
Urban energy vulnerability index assessment at building level
User interface
/ Data communication and visualisation
Urban energy vulnerability index assessment at building level
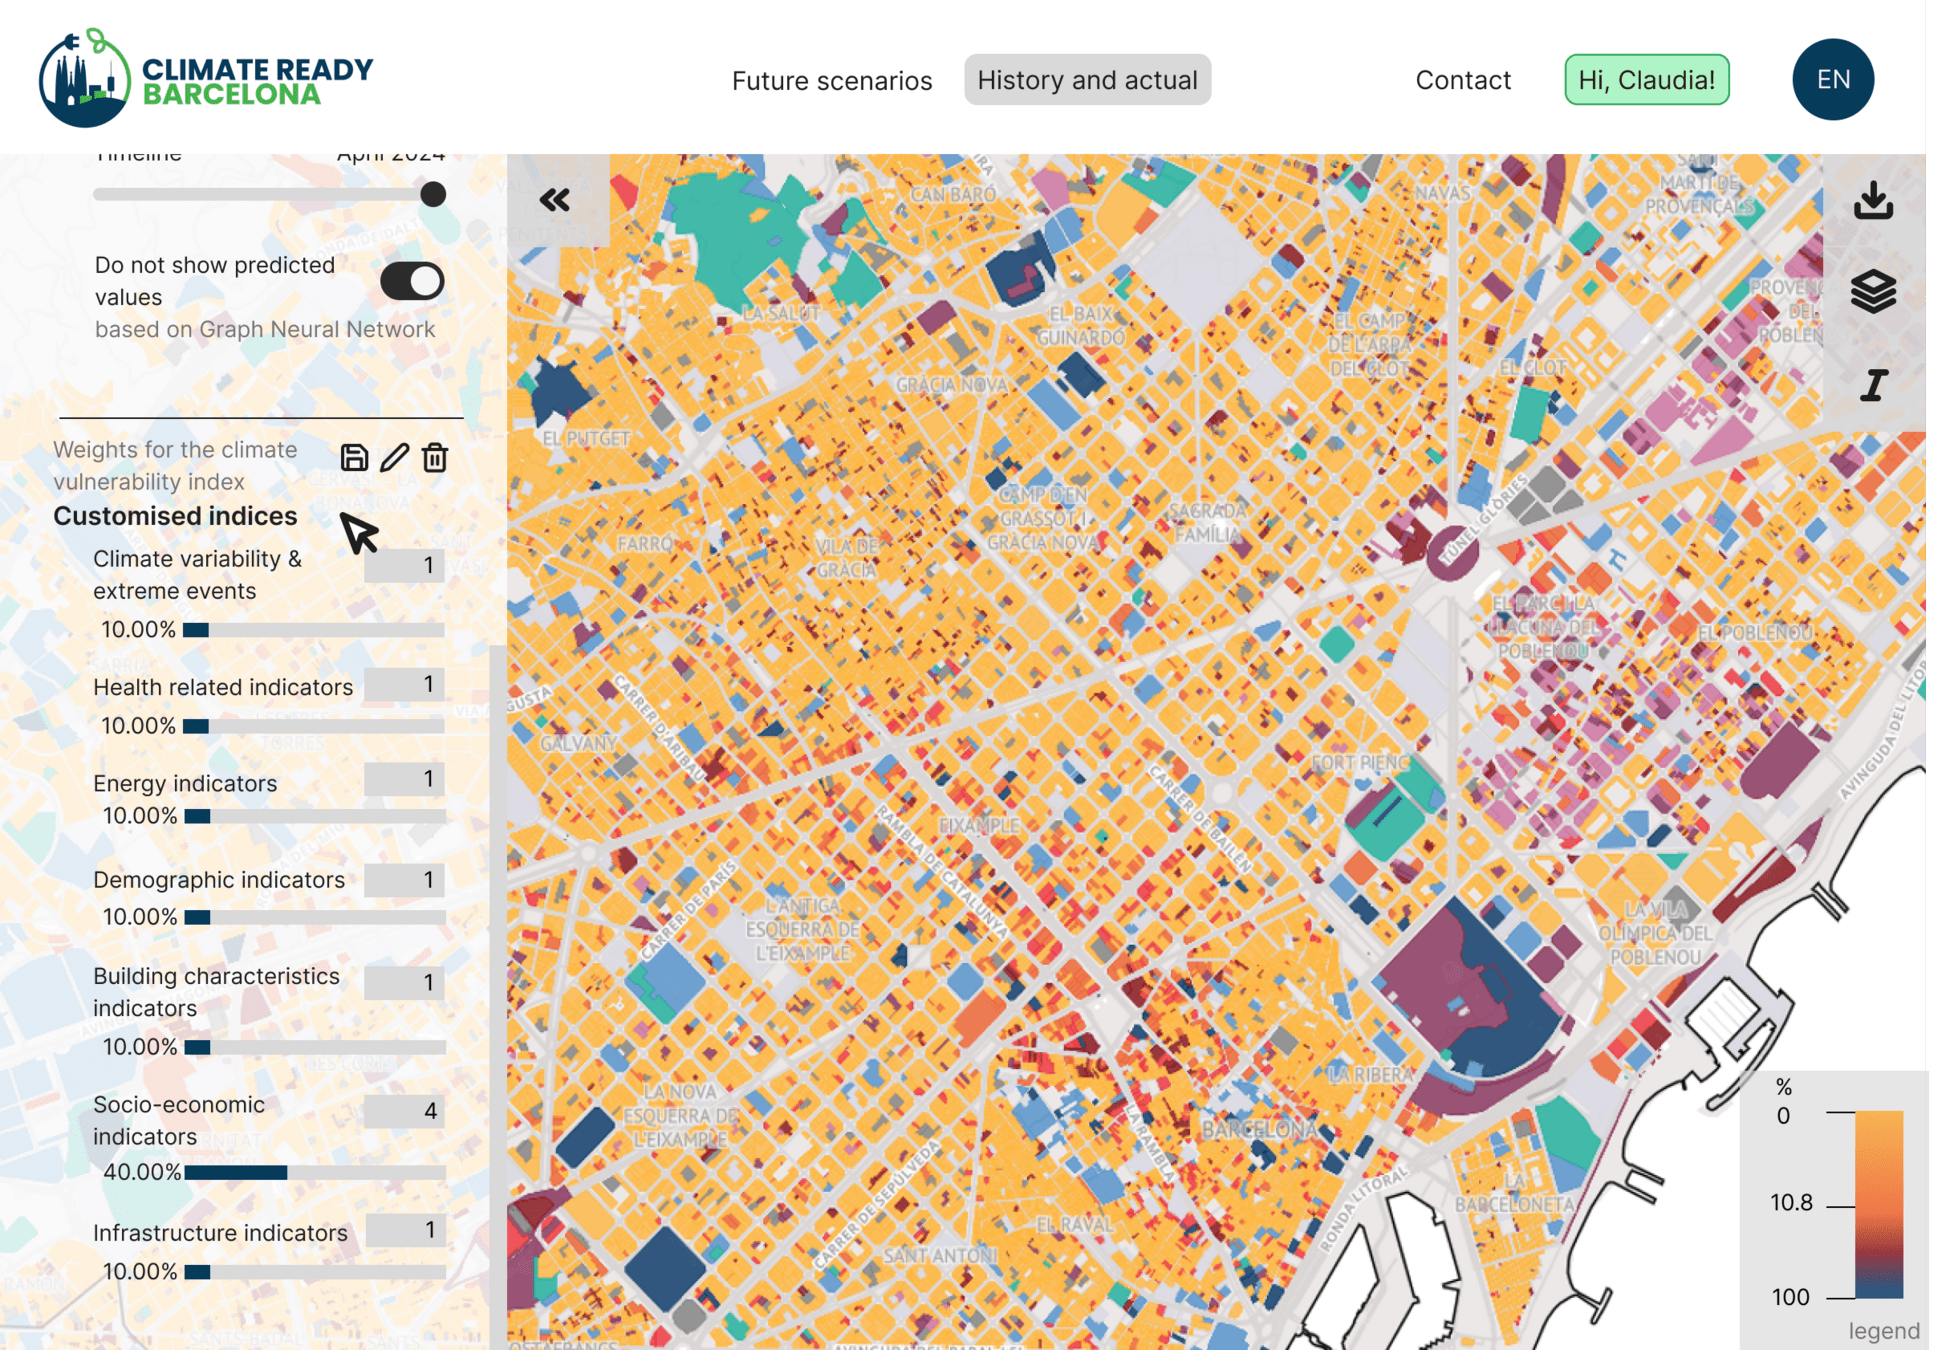
User interface
/ Data communication and visualisation
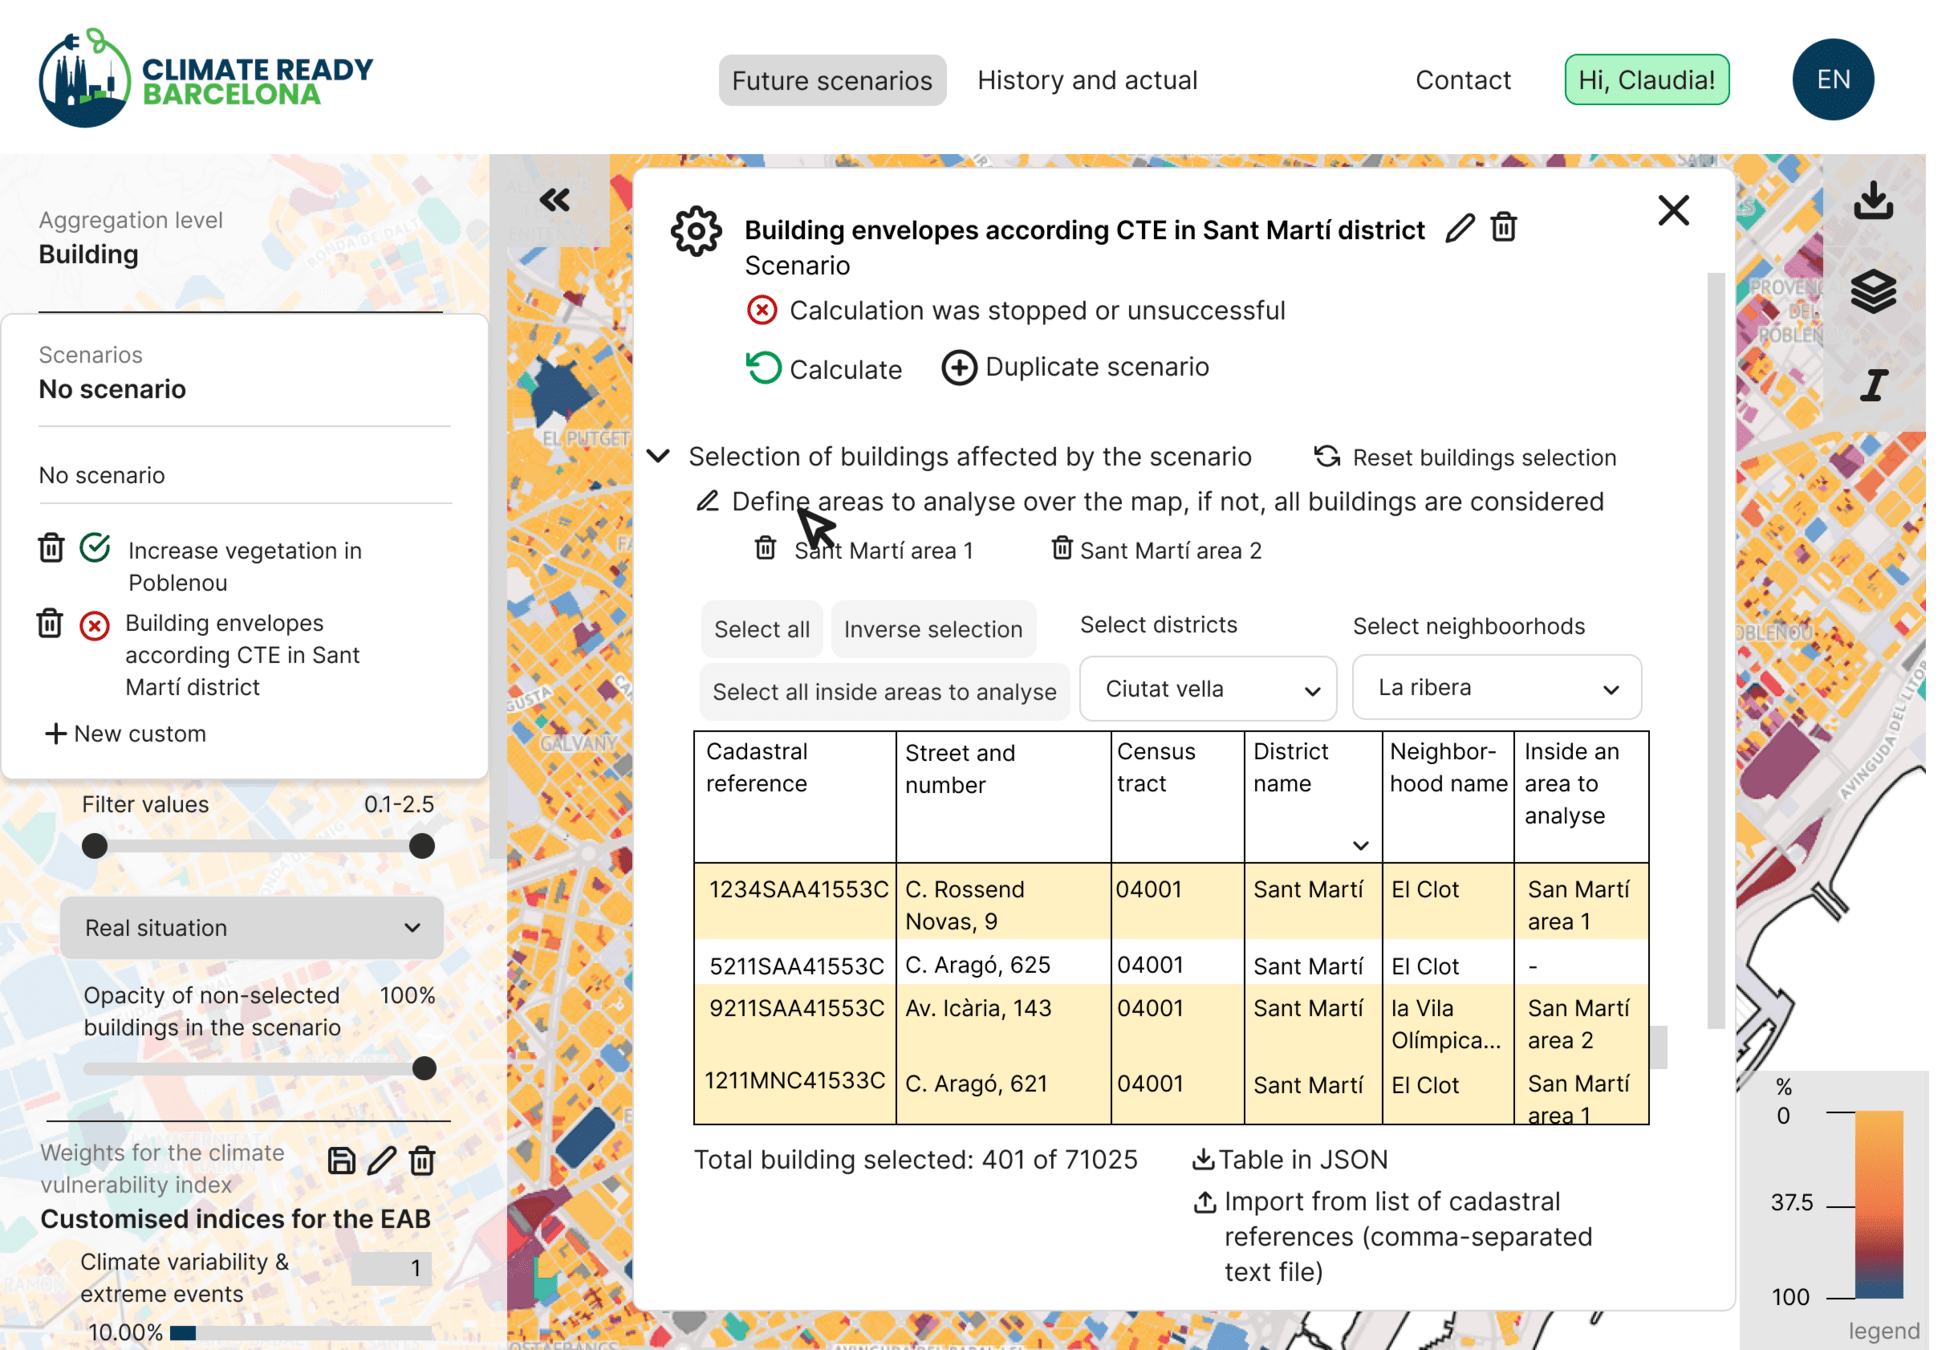
Urban energy vulnerability index assessment at building level
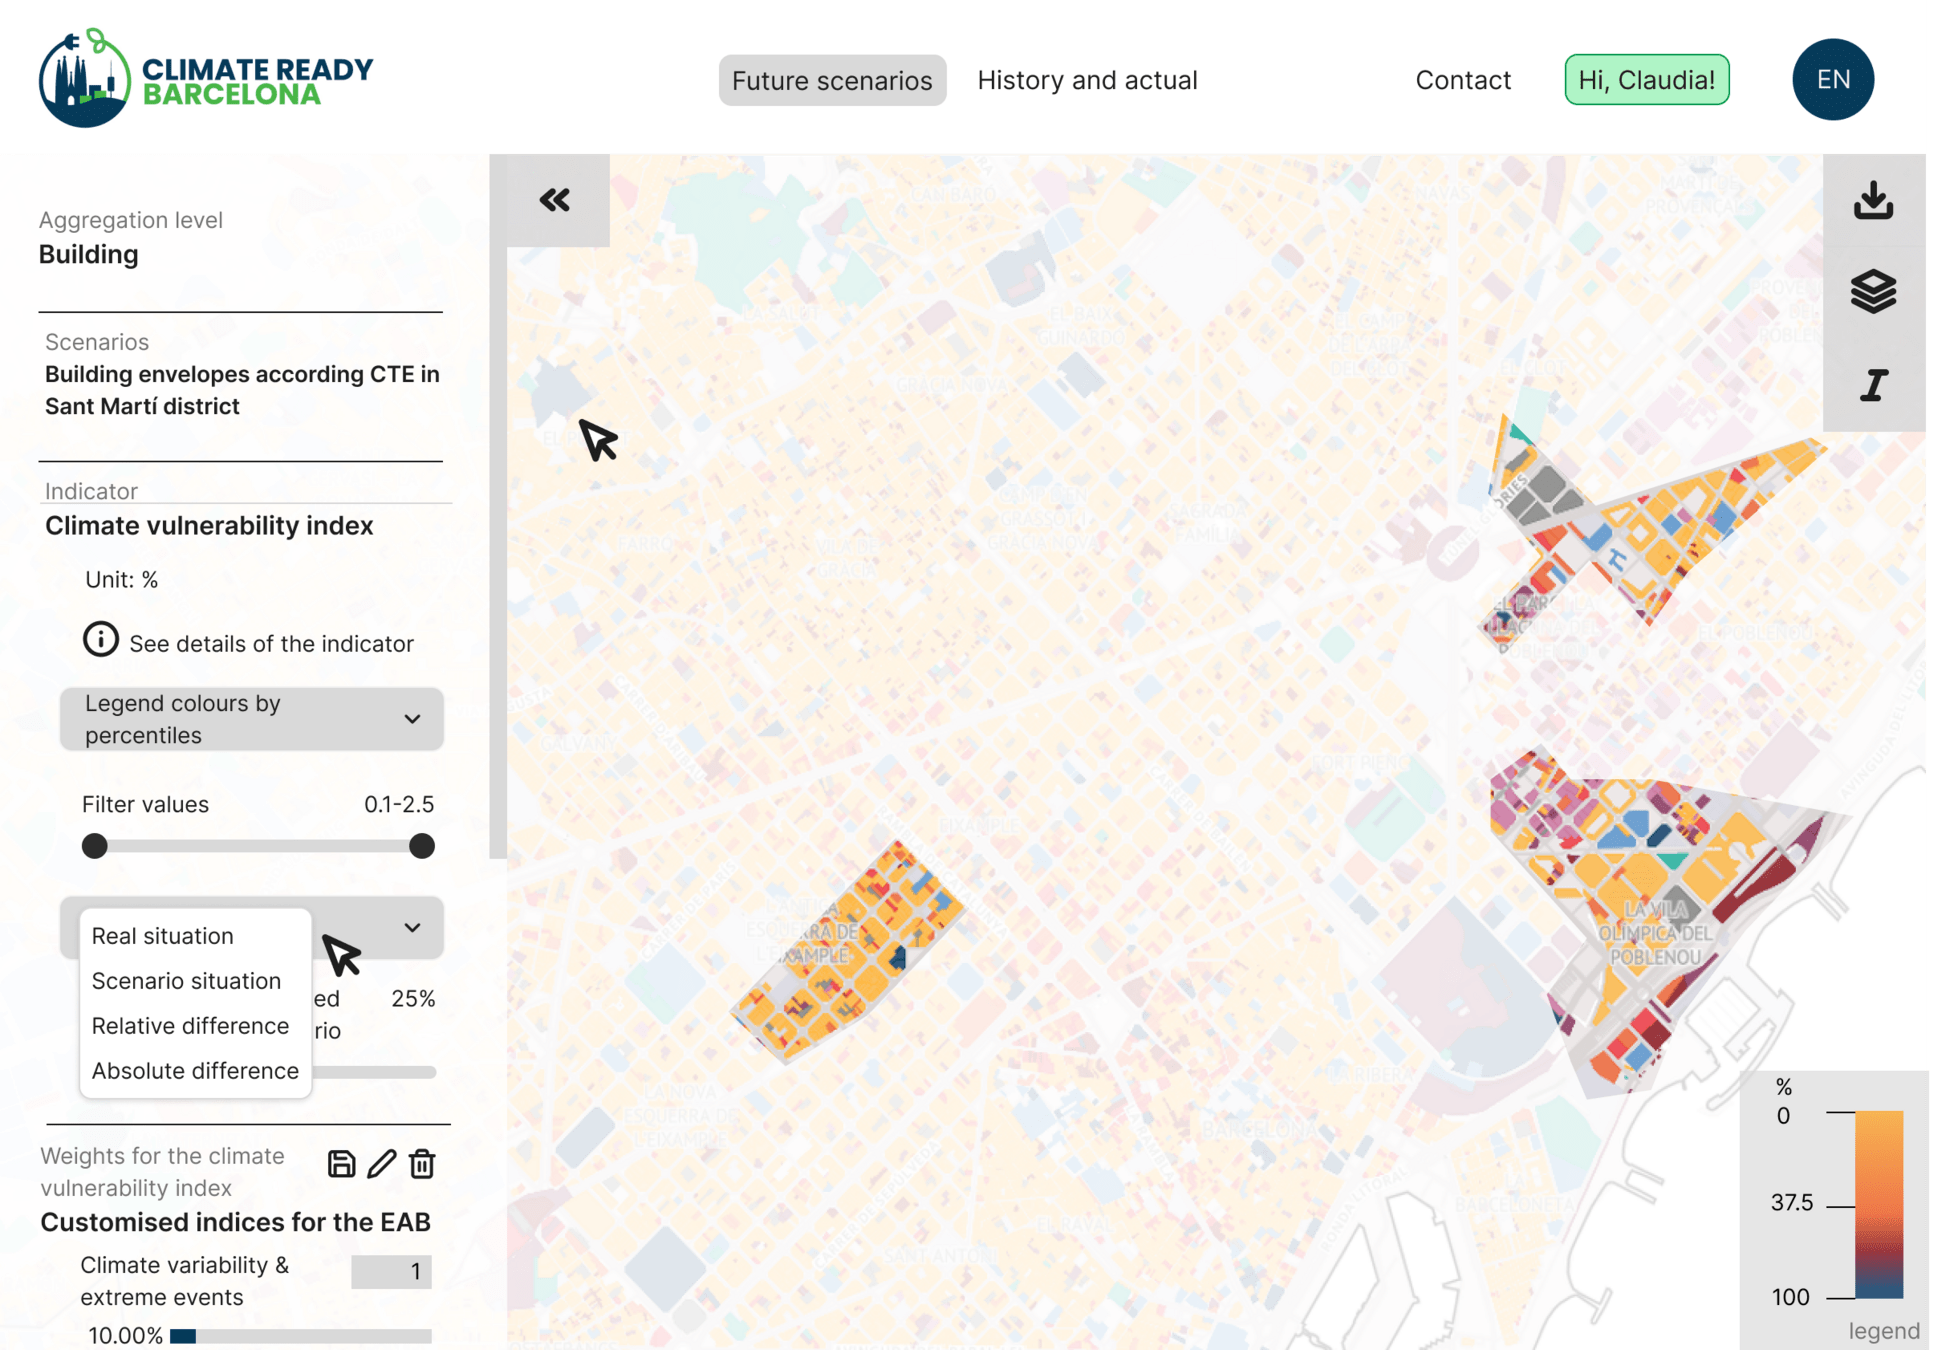
User interface
/ Data communication and visualisation
Thanks for your attention
Jose Manuel Broto, Antonio Pariente, Arnau Comas, Maite Sellart, Jordi Cipriano, Gerard Mor
Urban energy vulnerability index assessment at building level
Urban energy vulnerability index assessment at building level
By CIMNE BEE Group
Urban energy vulnerability index assessment at building level
Urban energy vulnerability index assessment at the building level is crucial for understanding and addressing climate challenges in cities, particularly in Barcelona. This study, conducted as part of the Climate Ready Barcelona project (funded by ICLEI and Google), focuses on integrating diverse data sources specific to Barcelona, harmonizing them to an ontology framework, and utilizing Graph Neural Networks (GNNs) for data modeling. Data ingestors collect heterogeneous datasets, including cadaster, weather, energy consumption, simulated energy demand, vulnerability surveys, and socio-economic data, which are then harmonized to a standardized ontology, facilitating interoperability and consistency. GNNs are employed to impute gaps and detect anomalies in the data, producing a comprehensive dataset for vulnerability index computation. Key Performance Indicators (KPIs) such as energy consumption, building age, and socio-economic status will assess vulnerability in Barcelona. The results will be accessible via a user interface catering to various roles (citizens, urban planners, administrators), fostering informed decision-making and sustainable urban development in Barcelona.


