Barcelona's Climate Vulnerability Map
March 7th 2025


Barcelona's Climate Vulnerability Map
Project overview

/ Project overview
Climate Ready Barcelona project
Barcelona's Climate Vulnerability Map
-
Fund: ICLEI Action Fund 2.0
-
Budget: 1M€
-
Objective: Support citizens and public authorities to anticipate and adapt to climate-change effects and the energy crisis
-
Implemented from July 2023 to June 2025


/ Project overview
Climate Ready Barcelona project
Barcelona's Climate Vulnerability Map
Two services has been implemented:
La Meva Energia
-
A new digital access channel to Energy Advisory Centers (EACs).
- Universal and useful for all citizens.
- Complements existing accessibility channels.
- Increase the scope of energy poverty prevention.
- Raise awareness and guarantee the right to energy for all citizens.
- Provide EACs advisors with an advanced management tool to deliver faster and better service to citizens.
/ Project overview
Climate Ready Barcelona project
Barcelona's Climate Vulnerability Map
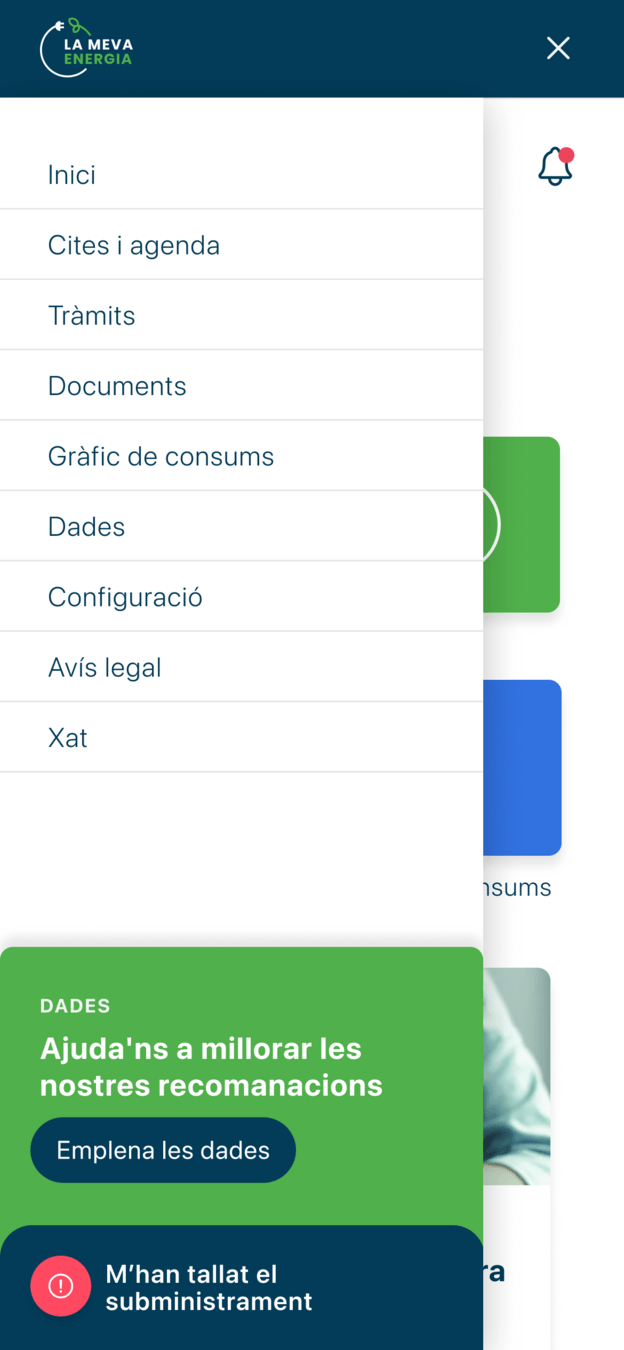
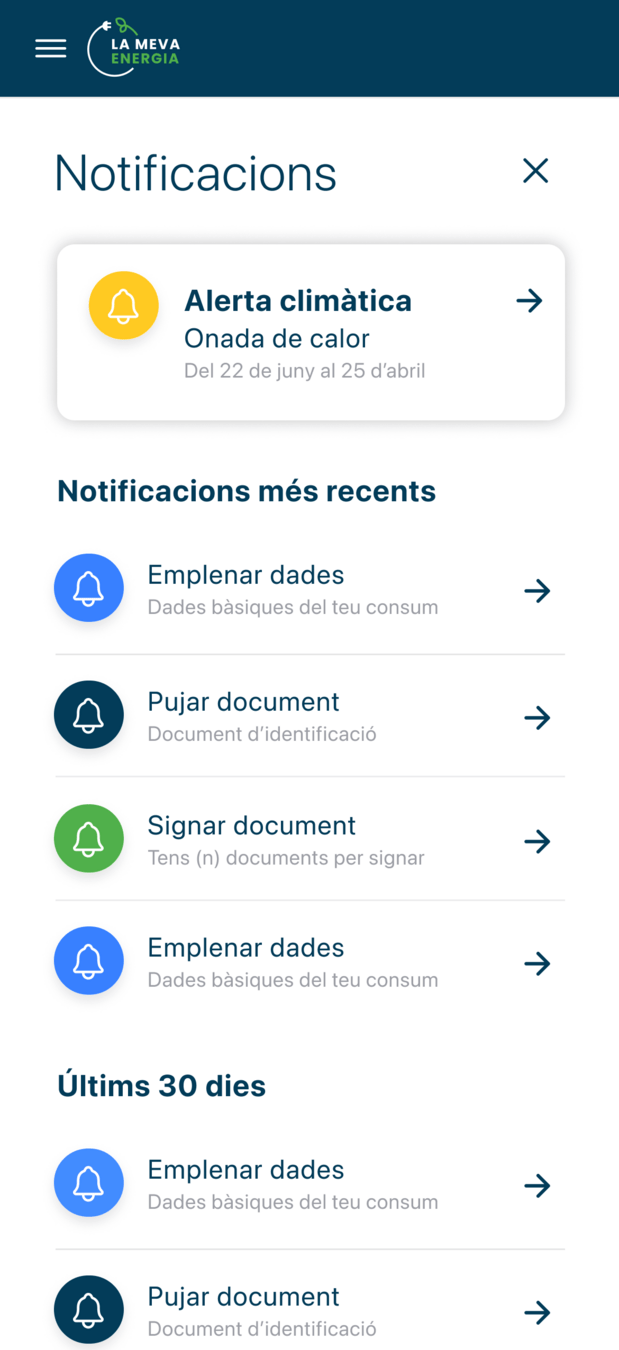
La Meva Energia - Mobile application for citizens access
La Meva Energia APP
- Increase the scope of energy poverty prevention.
- Raise awareness and guarantee the right to energy for all citizens.

/ Project overview
Climate Ready Barcelona project
Barcelona's Climate Vulnerability Map
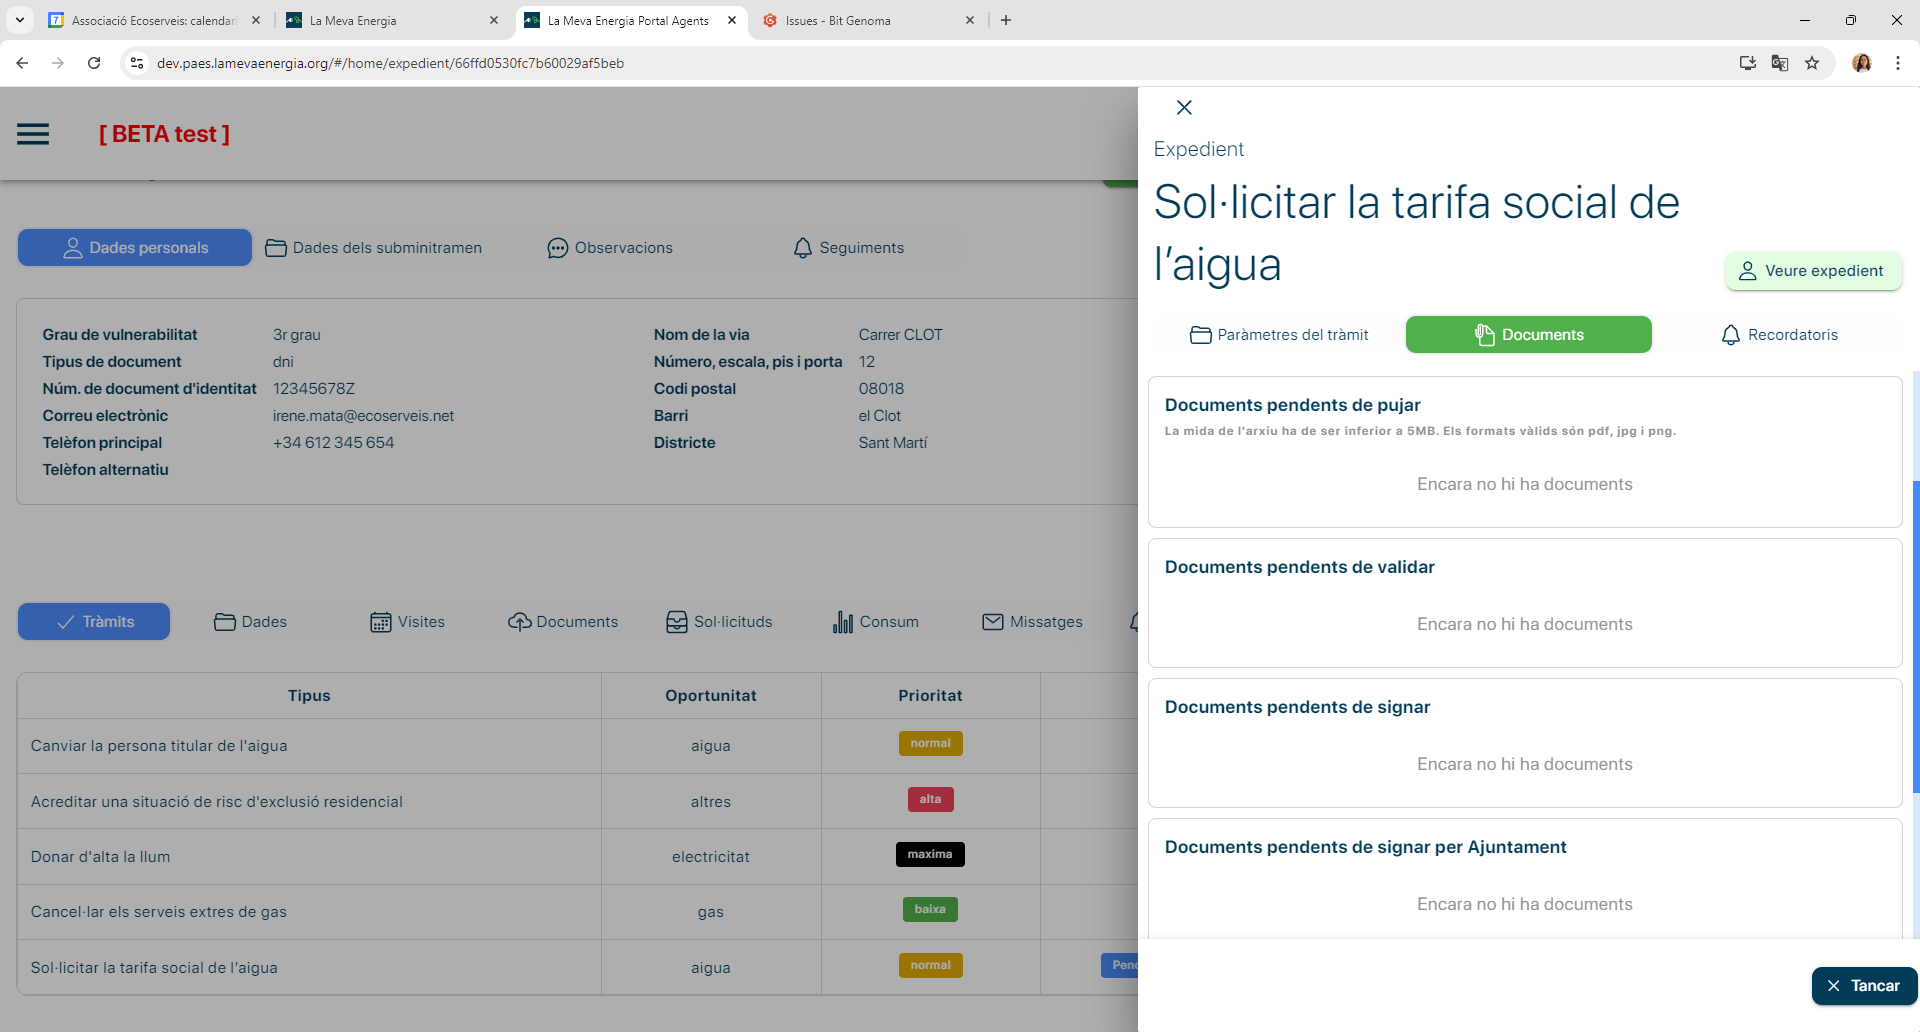
La Meva Energia - Desktop application for energy advisors access
La Meva Energia APP
- Increase the scope of energy poverty prevention.
- Raise awareness and guarantee the right to energy for all citizens.
/ Project overview
Climate Ready Barcelona project
Barcelona's Climate Vulnerability Map
Two services has been implemented:
Climate Vulnerability Map of Barcelona
- Focusing on assessing building-level vulnerability to heat waves.
- Estimation of vulnerability using a hybrid AI approach that combines real and simulated data.
- Generation of georeferenced layers of indicators that can be downloaded for reuse in GIS software.
- Reuse the aggregated information collected by La Meva Energia.
- Develop a scalable methodology that can be applied to other cities.
Barcelona's Climate Vulnerability Map
Climate Vulnerability Index (CVI)
Climate vulnerability is typically framed within three key dimensions initially described in IPCC (Intergovernmental Panel on Climate Change) Third Assessment Report in 2001:
- Exposure
- Sensitivity
- Adaptive capacity
While most studies classify indicators using these categories, this research introduces additional levels to provide a more nuanced analysis, while still aligning with the traditional framework.
How to estimate the CVI?
/ Climate Vulnerability Index (CVI)
Barcelona's Climate Vulnerability Map
-
Climate Variability and Extreme Events
Track changes over time with metrics such as temperature, rainfall, and vegetation cover. Local data helps assess risks of heatwaves, droughts, and floods. -
Energy Indicators
Explore energy use patterns (like gas and electricity consumption) and their role in adaptation. Indoor temperature data is crucial for identifying households at risk during extreme heat events. -
Building Characteristics
Assess features like building age, usage, and size to understand their impact on energy use, indoor comfort, and structural vulnerability.
Barcelona's Climate Vulnerability Map
Key Performance Indicators groups
/ Climate Vulnerability Index (CVI)
-
Infrastructure Indicators
Evaluate the availability of essential services (schools, shelters, social housing) and the strength of social networks to understand community support capacity. -
Health-Related Indicators
Analyze links between climate and health outcomes, crucial for identifying vulnerable populations and preparing healthcare systems. -
Demographic Indicators
Not all groups are equally vulnerable. Analyze factors like gender, age, income, migration status, and unemployment to create detailed Climate Vulnerability Indexes (CVIs). -
Socio-Economic Indicators
Understand urban resilience through factors like housing costs, energy poverty, household debt, and social protection gaps, which are exacerbated during economic crises.
Barcelona's Climate Vulnerability Map
Key Performance Indicators groups
/ Climate Vulnerability Index (CVI)
CVI Development Process
-
Data Preprocessing – Ensure data quality.
- Select the required input data to calculate the indicators,
-
Framework Selection – Deductive, hierarchical, or inductive, based on indicators.
- Select which indicators positively or negatively affect the CVI
-
Granularity Definition – Select appropriate spatial and location scale.
- Once per year and building level.
Barcelona's Climate Vulnerability Map
Building the CVI
/ Climate Vulnerability Index (CVI)
CVI Development Process
-
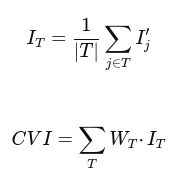
Normalization & Weighting – Harmonize indicators and assign weights.
- Equal weighting, subjective or objective.
- Aggregation – Combine indicators by groups into a final score
⚠️ Key Challenge: Each study tailors its CVI to its specific context and priorities.
Barcelona's Climate Vulnerability Map
Building the CVI
/ Climate Vulnerability Index (CVI)
Normalisation and aggregation formulas:
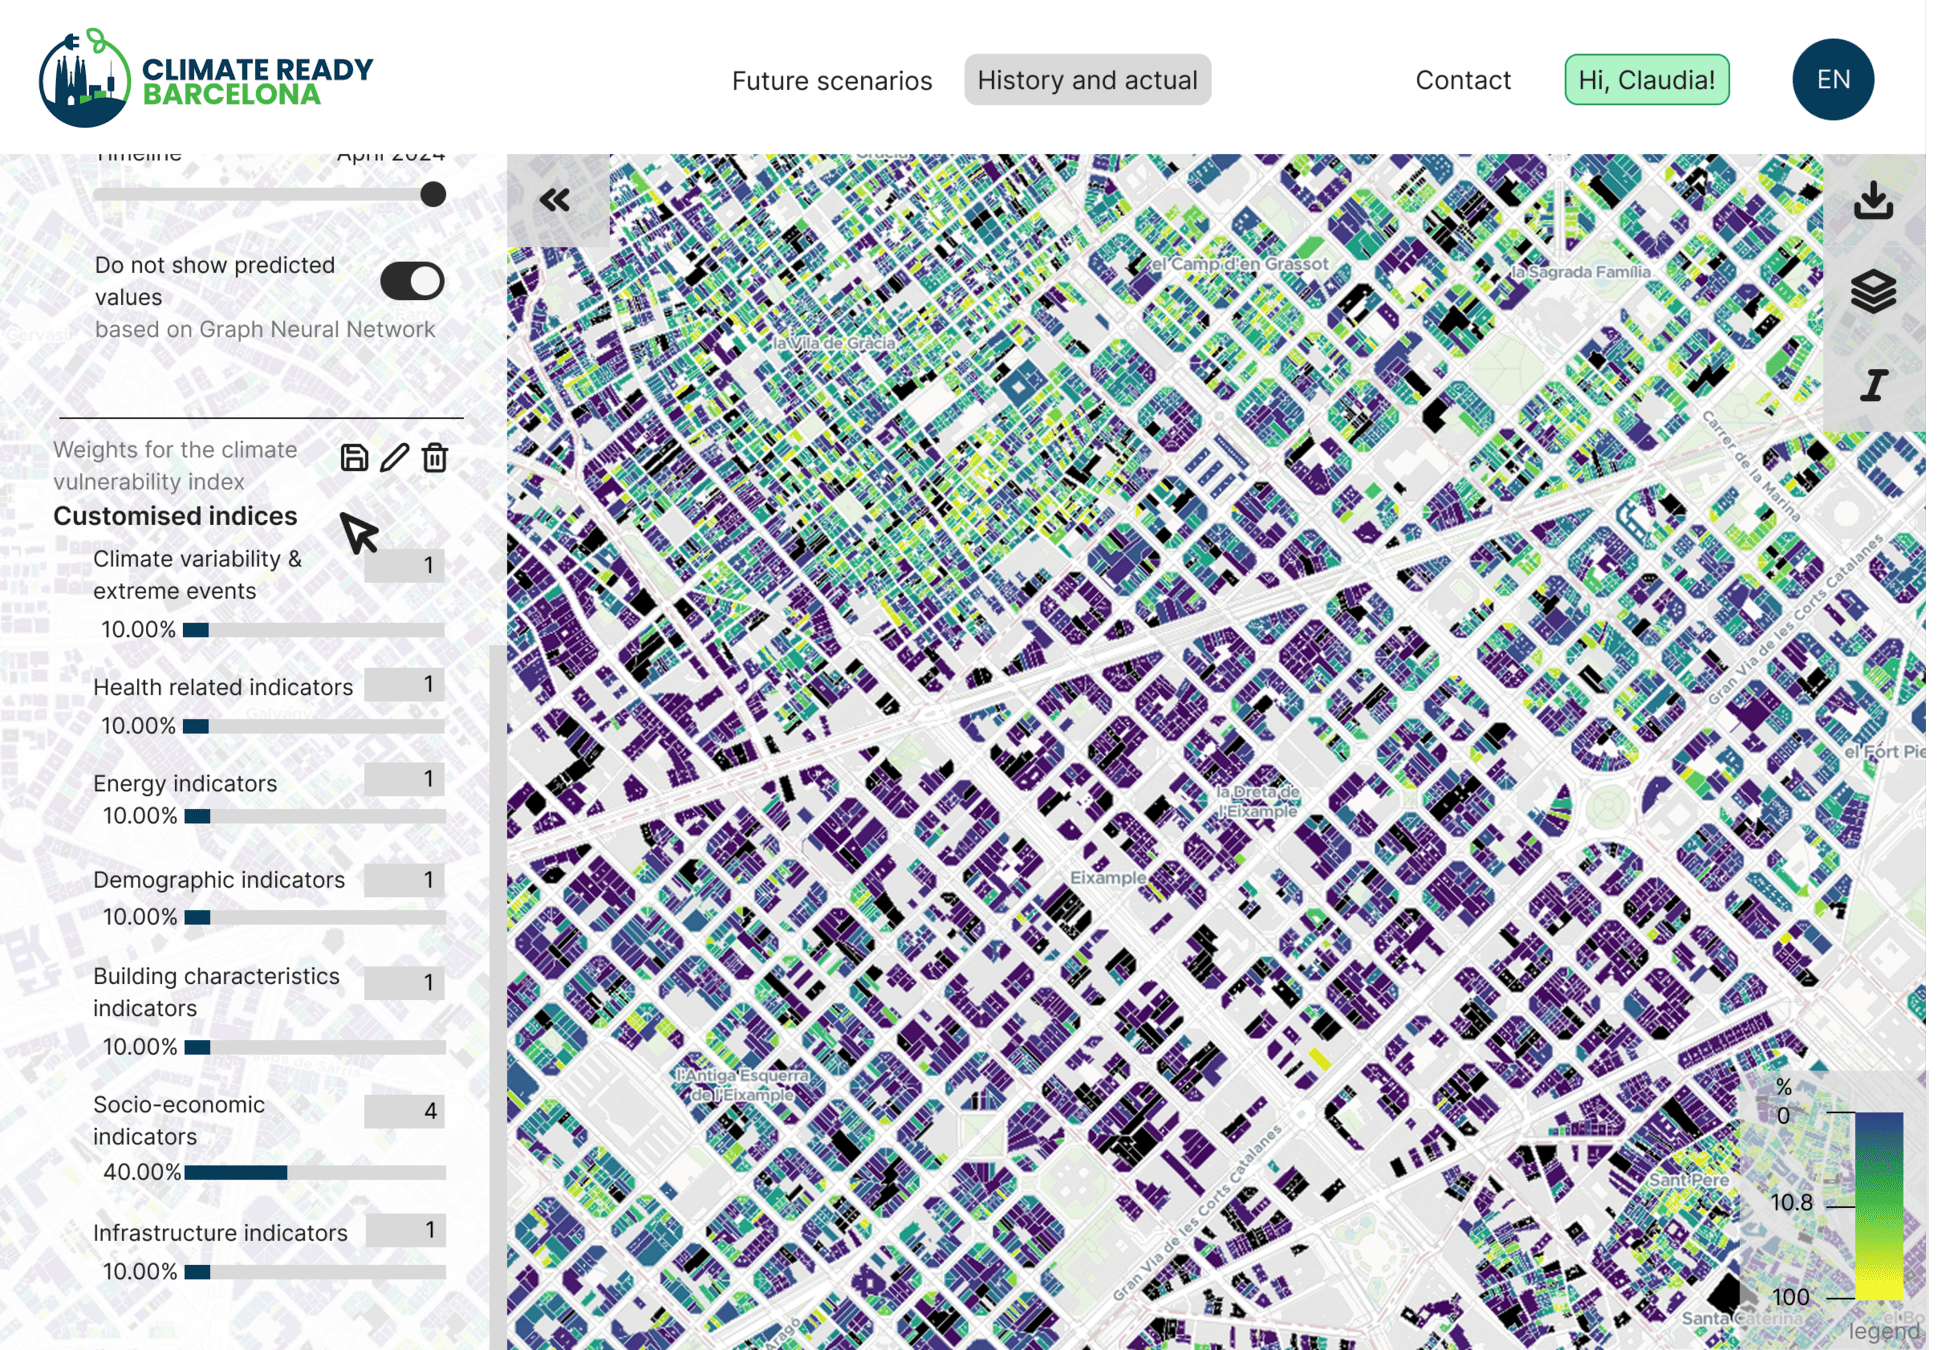
- Interactive features:
- View individual indicator layers.
- Customize weights for tailored vulnerability analysis.
- Adapt the CVI based on user objectives (e.g., prioritizing climate vs. socio-economic factors).
🎯 Outcome: A practical tool for policymakers and citizens to explore climate vulnerability and support decision-making.
Barcelona's Climate Vulnerability Map
Building the CVI
/ Climate Vulnerability Index (CVI)

Initially:
Data architecture and ontology
Barcelona's Climate Vulnerability Map
Software Architecture
/ Data architecture and ontology

Barcelona's Climate Vulnerability Map
Data ontology
/ Data architecture and ontology
Barcelona's Climate Vulnerability Map
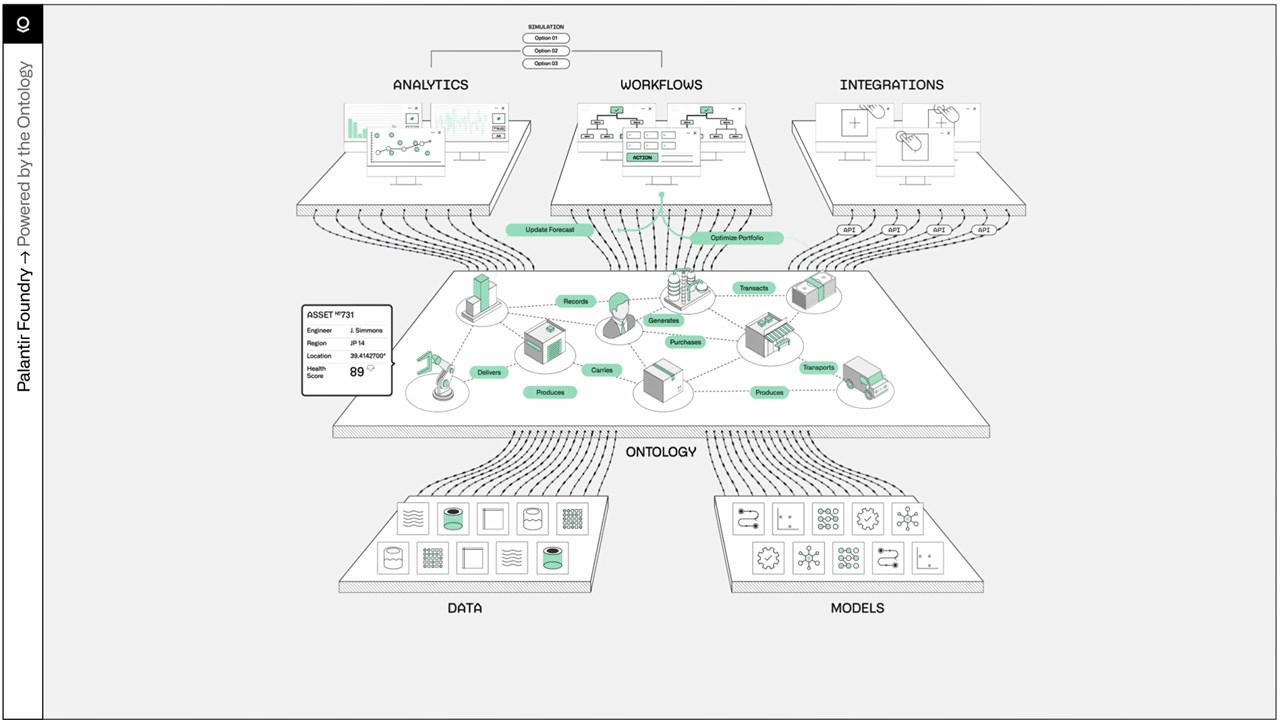
Understanding and organizing data is just as crucial as the algorithms themselves
The ontology is at the heart of our solution
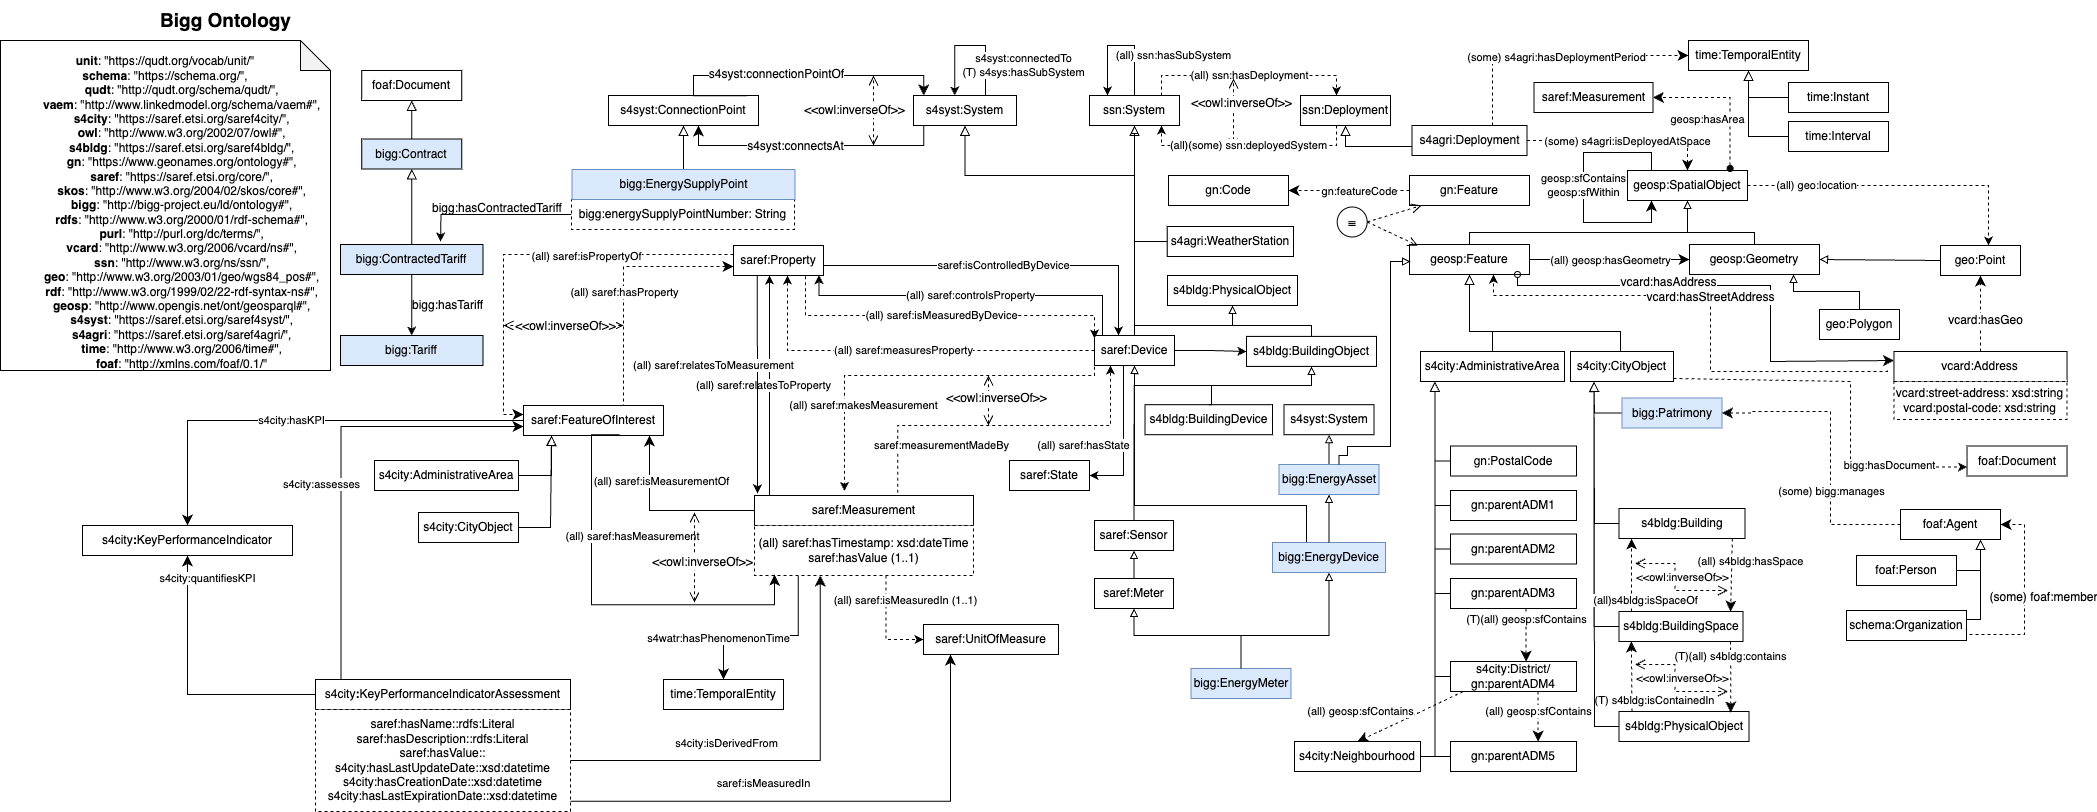
BIGG ontology
/ Data architecture and ontology
Barcelona's Climate Vulnerability Map
https://github.com/BeeGroup-cimne/biggontology
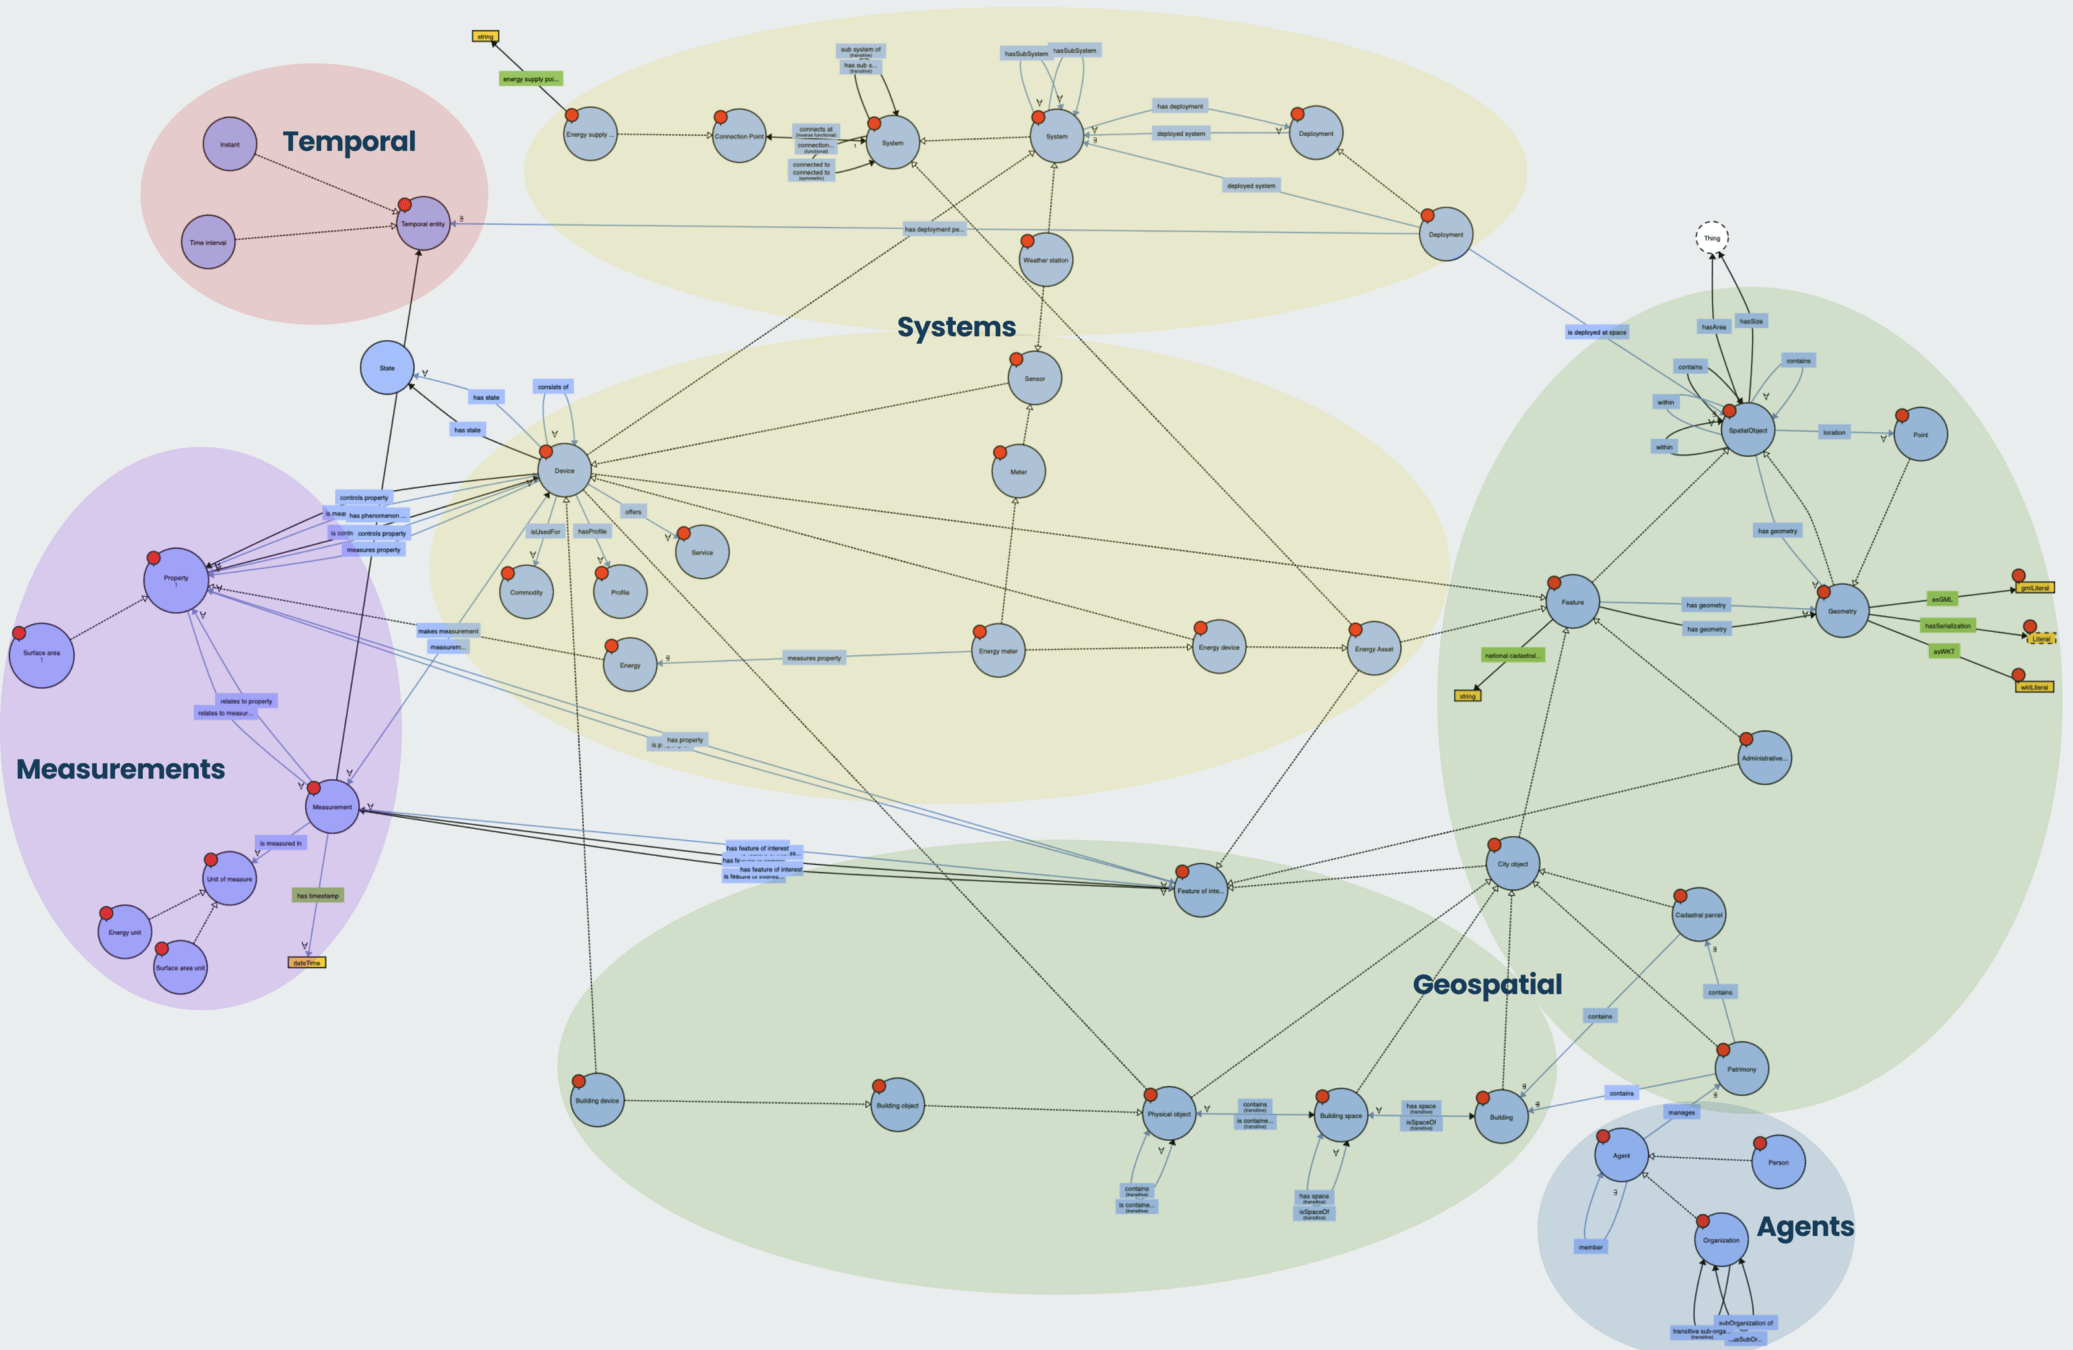
Reusing:
-
saref, s4blg, s4city, s4agri:
- buildings, devices
-
ssn:
- systems, deployments
-
geosp:
- geolocation
-
qudt:
- units
BIGG ontology
/ Data architecture and ontology
Barcelona's Climate Vulnerability Map
https://github.com/BeeGroup-cimne/biggontology
Input data sources
Barcelona's Climate Vulnerability Map
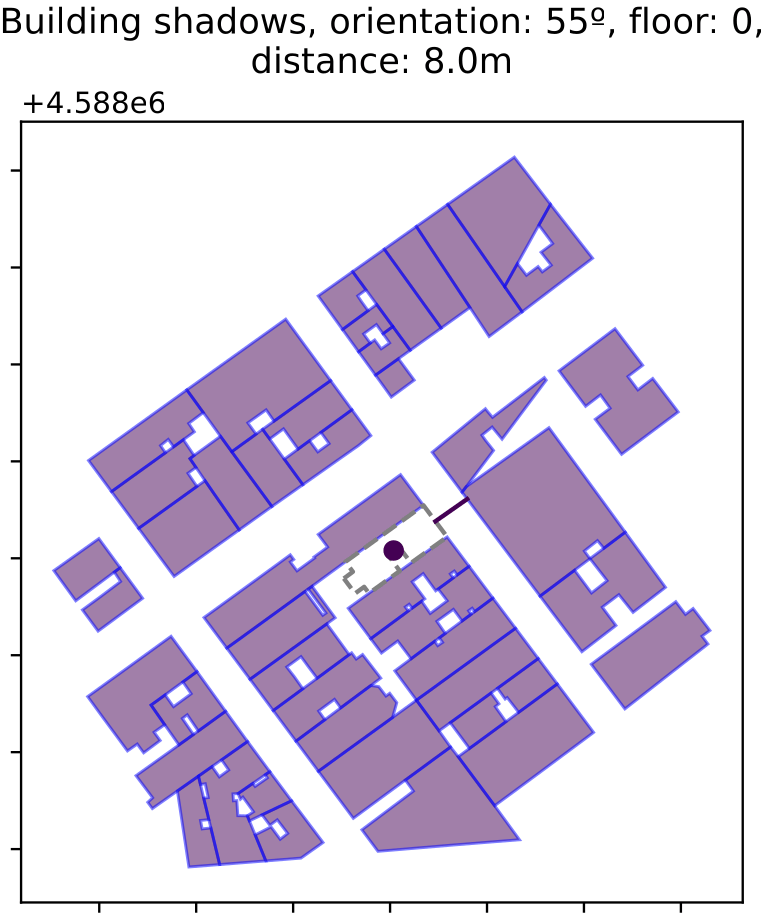
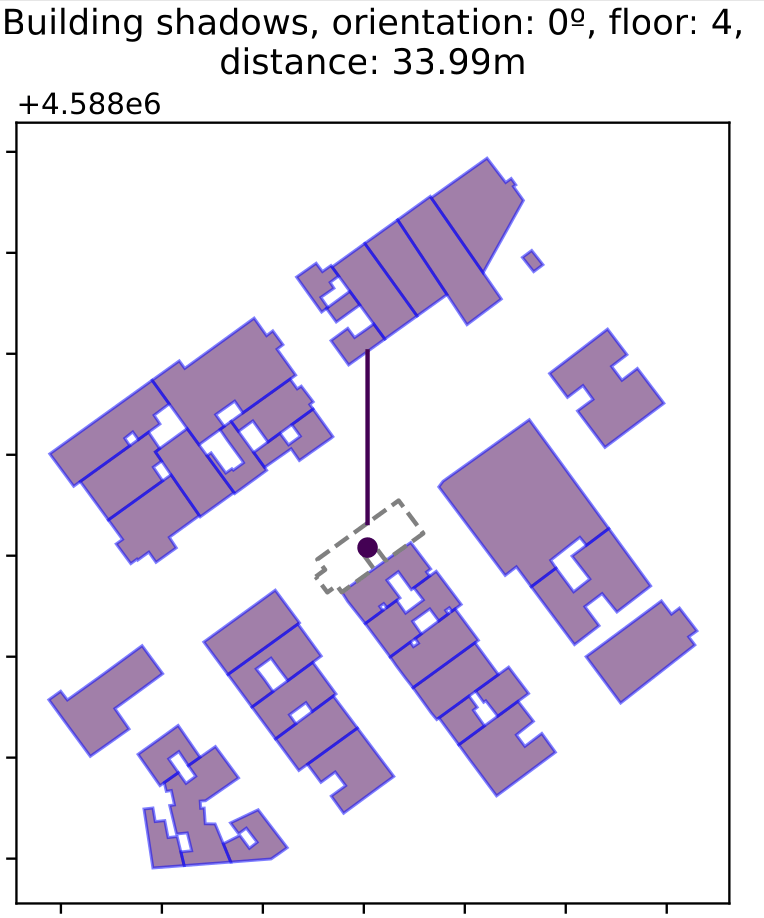
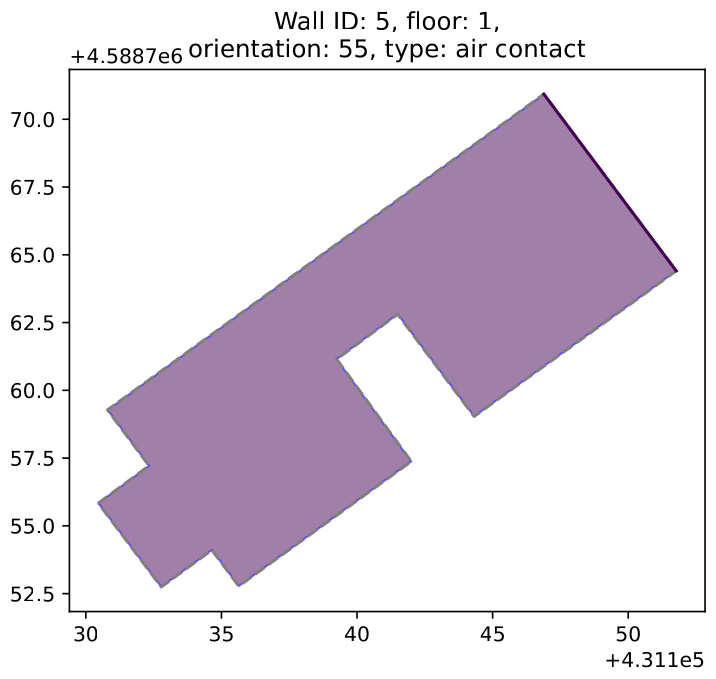
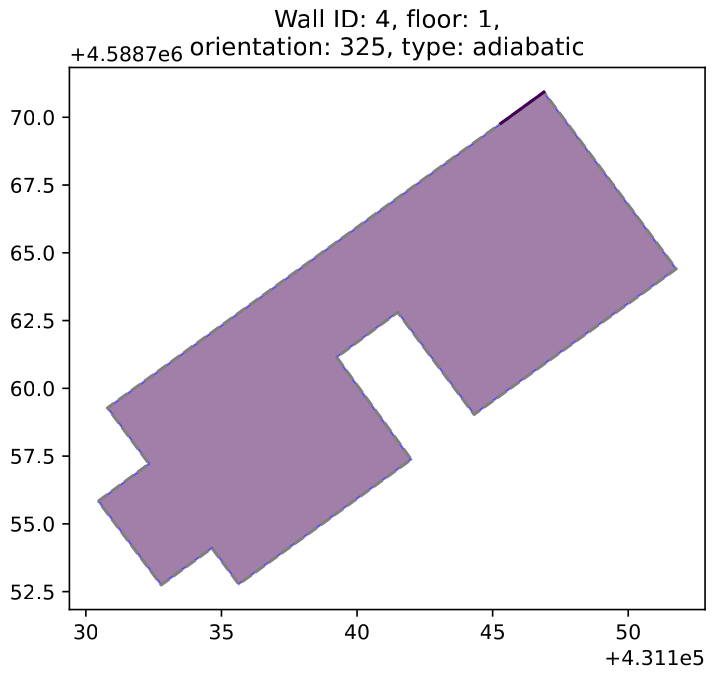
- Spanish National Cadaster datasets
- Building geometry, characteristics, horizontal distribution
- Inferred: shadows from nearby buildings, wall types and orientations by floor, patios detection, administrative metadata (addresses, postal codes, census tracts, districts...)
- hypercadaster_ES Python library
- Building geometry, characteristics, horizontal distribution
Some of the datasets we are using
/ Input data
Barcelona's Climate Vulnerability Map
- Energy Performance Certificates of buildings
- EPCs at dwelling level, including information about envelope characteristics and heating, cooling and DHW systems
- Important work cleaning and validating this open datasets for all Catalonia
- epc_CAT Python library (not yet public)
- In the context of Barcelona, around 20% of dwellings (total = ~1M) has an EPC
- Real gas and electricity consumption readings at building level
- Data coming from Metropolitan Area of Barcelona (2017), and from DSOs from 2018 to beyond.
- We found several difficulties making the georeferencing process between DSOs addresses and cadastral references.
Some of the datasets we are using
/ Input data
Barcelona's Climate Vulnerability Map
- National Statistics Institute datasets
- Socioeconomic, demographic, cost of living and buildings characteristics information
- Several datasets were aligned, joined and aggregated
- social_ES Python library
- Historical and forecasted meteorological datasets
- For historical data we are using ERA5Land data (mesoscale resolution, ~5km), and UrbClim datasets (100x100m grid)
- For forecasting data we are using MeteoGalicia WRF models (mesoscale resolution, ~7km)
Some of the datasets we are using
/ Input data
Barcelona's Climate Vulnerability Map
- Open Datasets of Barcelona City Council
- Climate Shelters: including characteristics of them and opening timetables
- Commercial premises in ground floor
- Administrative layers
- Digital Elevation Model
- 30m-grid from COPERNICUS
- Normalised Difference Vegetation Index (NDVI)
- An aggregation of a buffer around each building was computed
Some of the datasets we are using
/ Input data
Barcelona's Climate Vulnerability Map
Data sharing with La Meva Energia
/ Data communication and visualisation

Barcelona's Climate Vulnerability Map
Predictive models applied
Barcelona's Climate Vulnerability Map
Models for predicting unknown indicators
/ Predictive models applied
Barcelona's Climate Vulnerability Map
Models for predicting unknown indicators
Barcelona's Climate Vulnerability Map
We are working with different kind of models and testing them out:
-
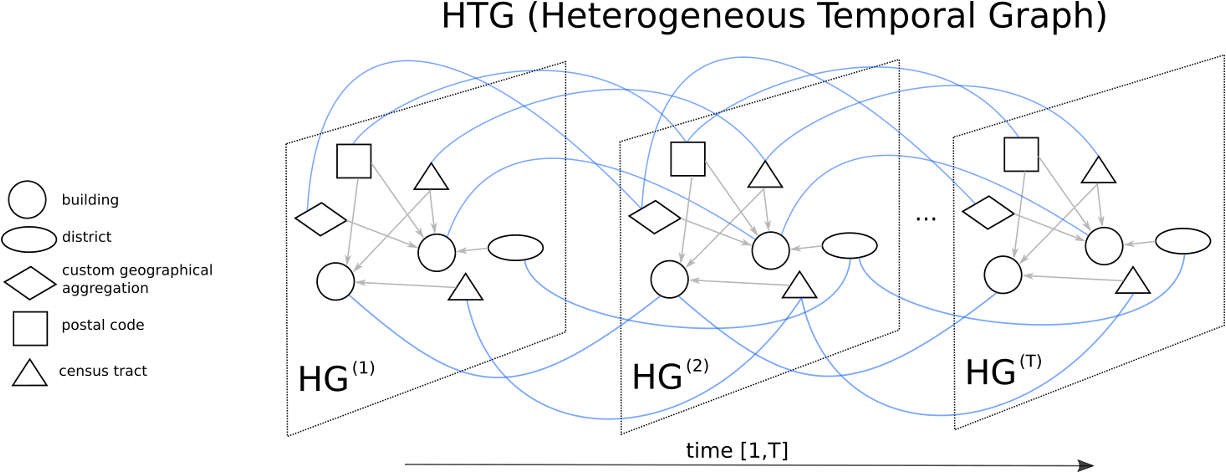
Graph Neural Networks:
- A customised GNN based on Tensorflow is being tested and compared to other methods, including tabular ML models.
-
CatBoost for predicting indicators at building/dwelling level:
- Using Bayesian Optimisation for the selection of hyperparameters
/ Predictive models applied
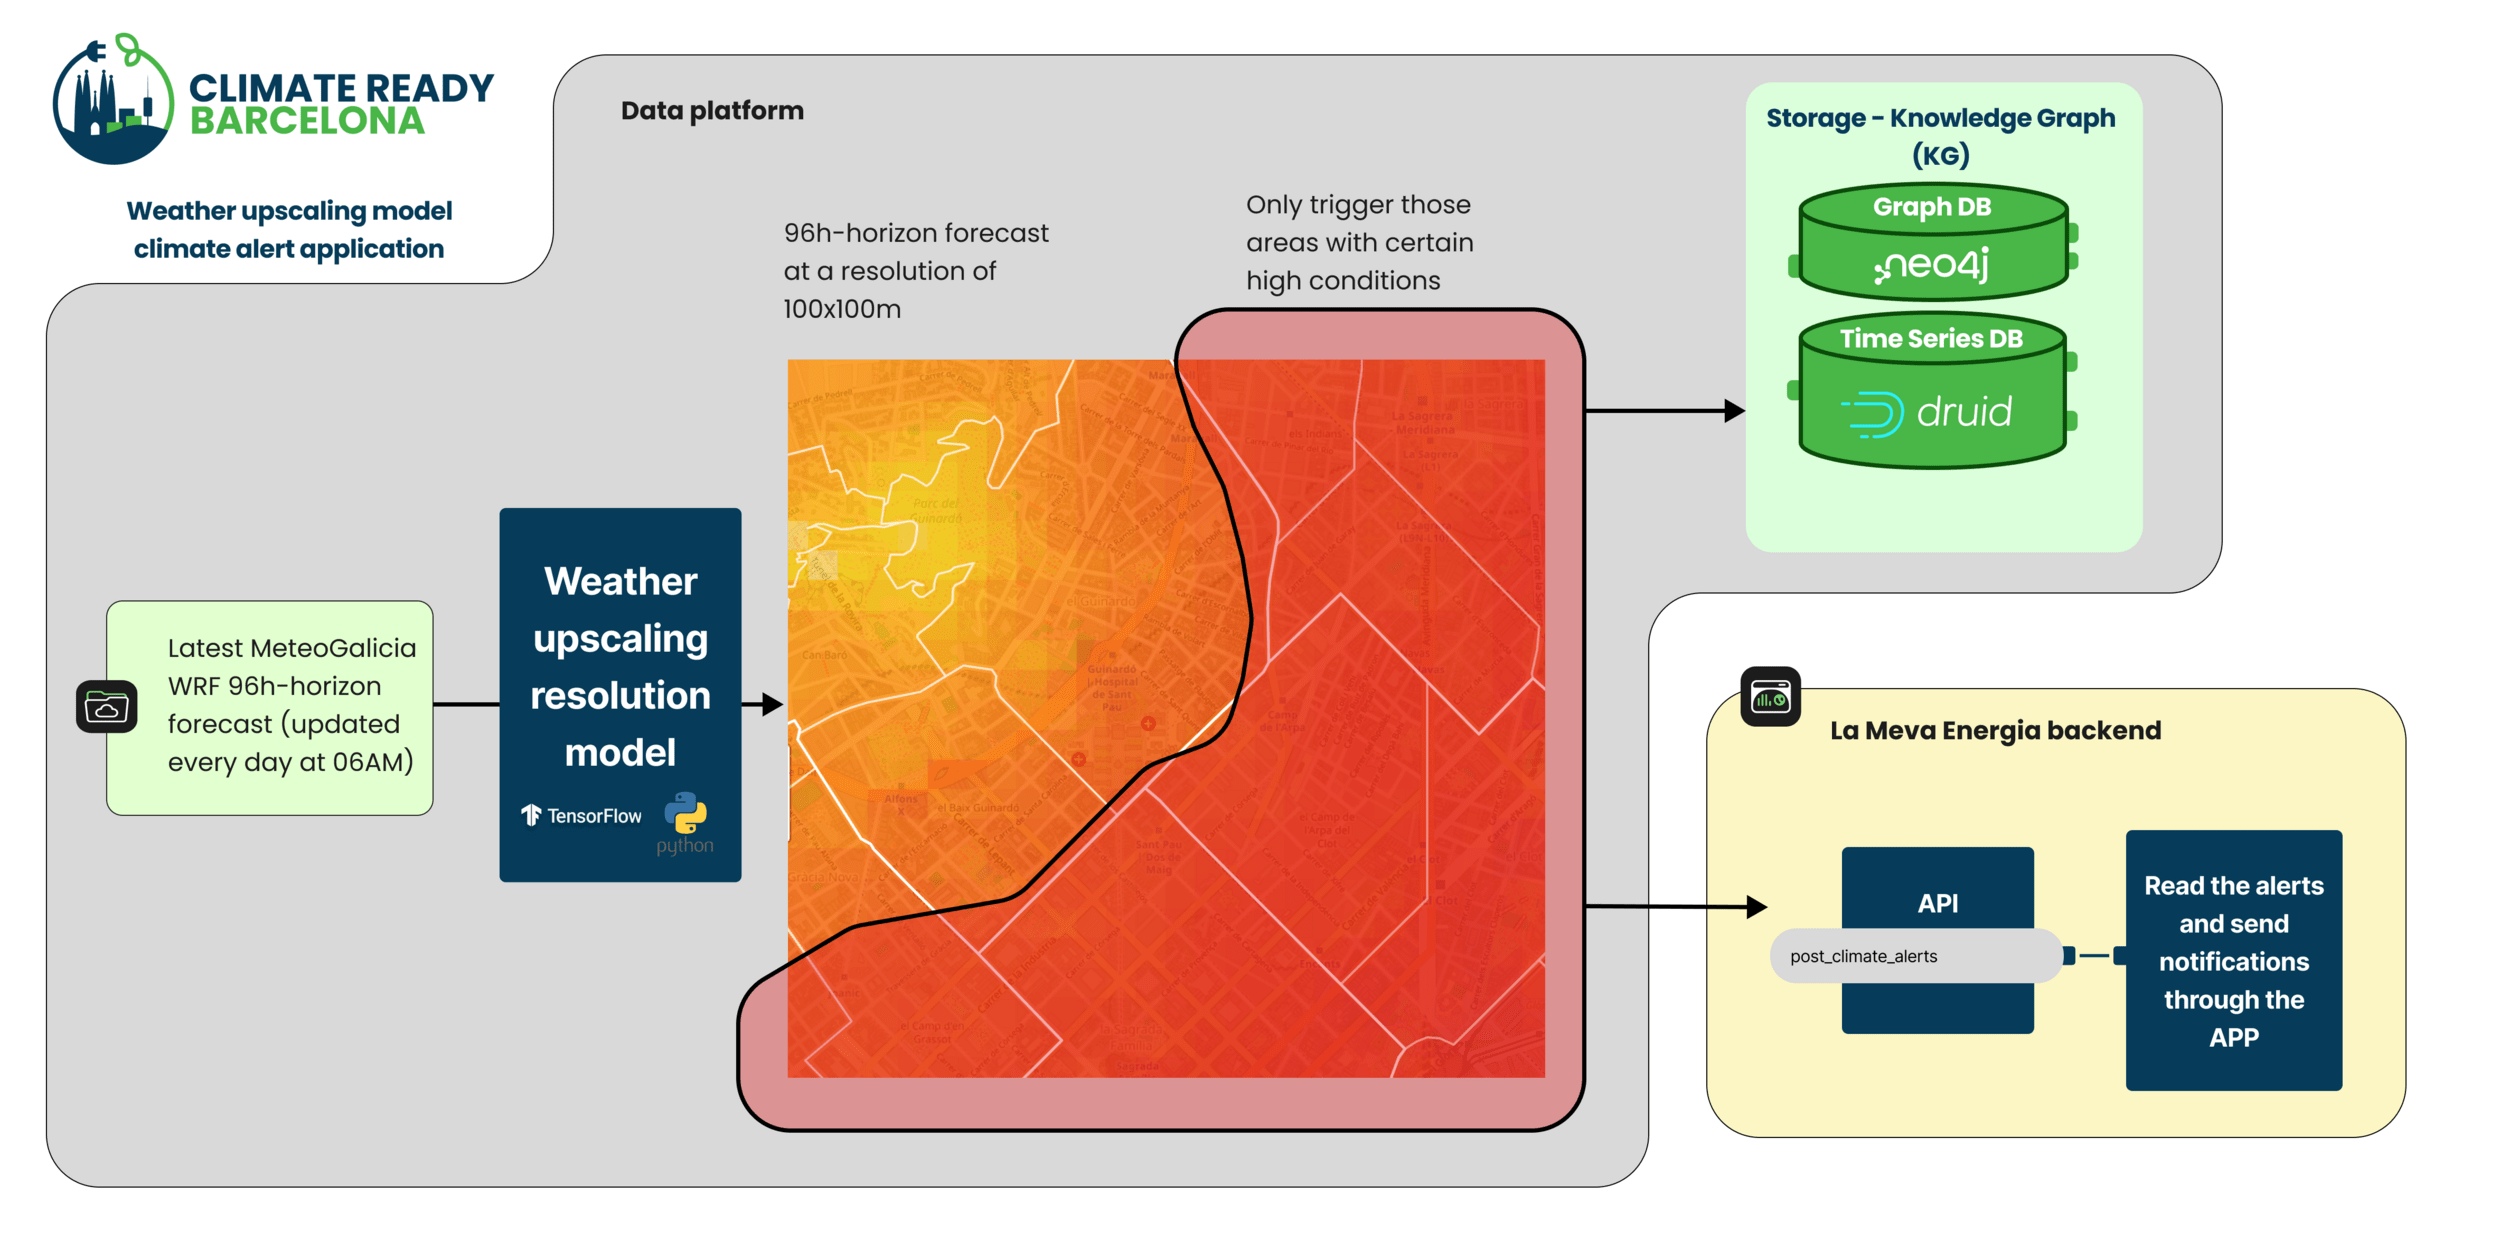
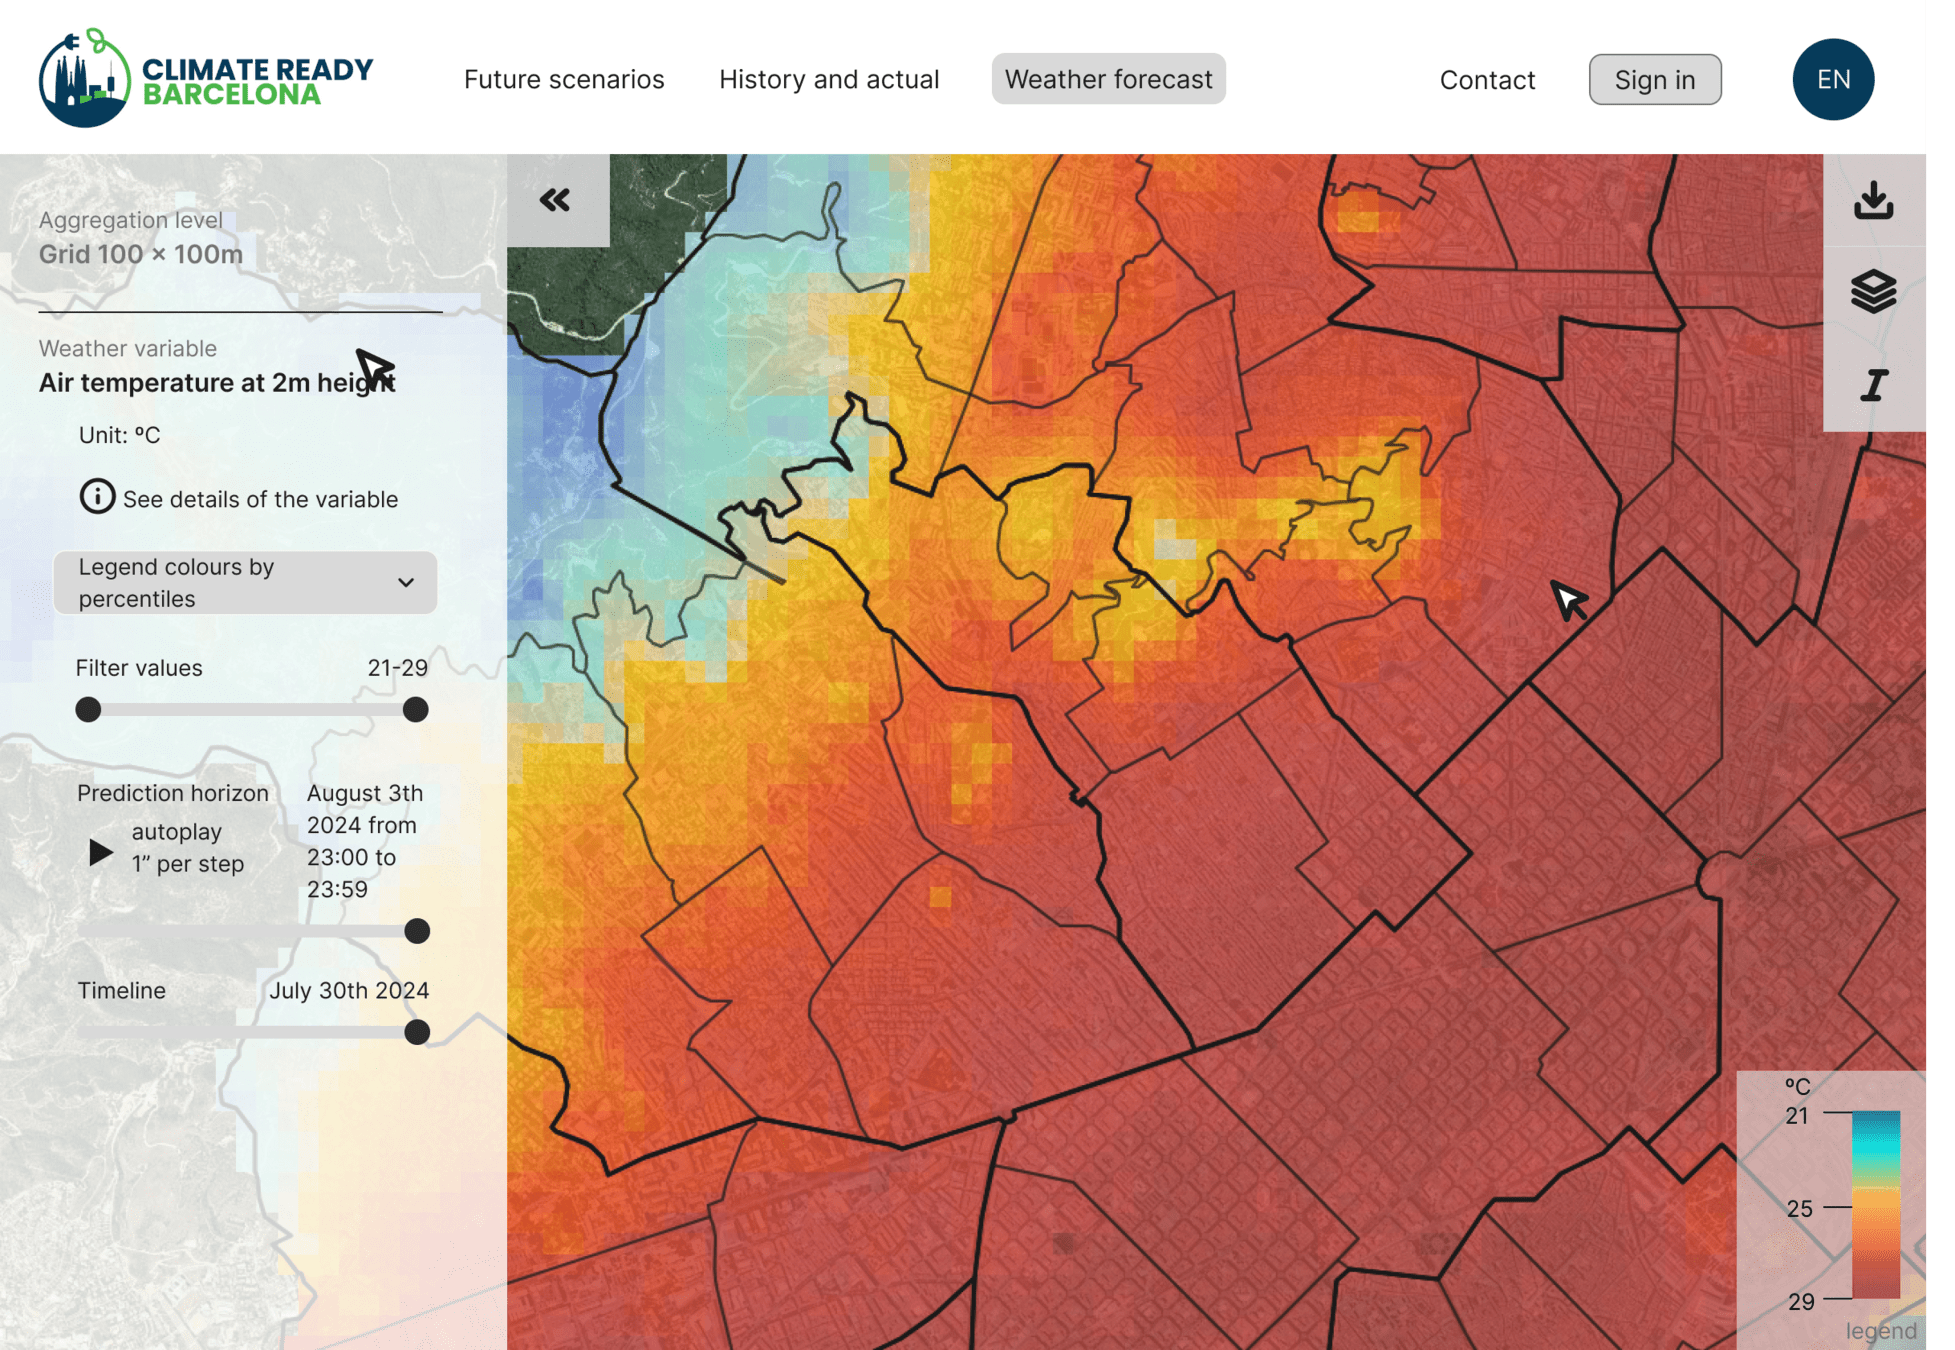
Weather downscaling model
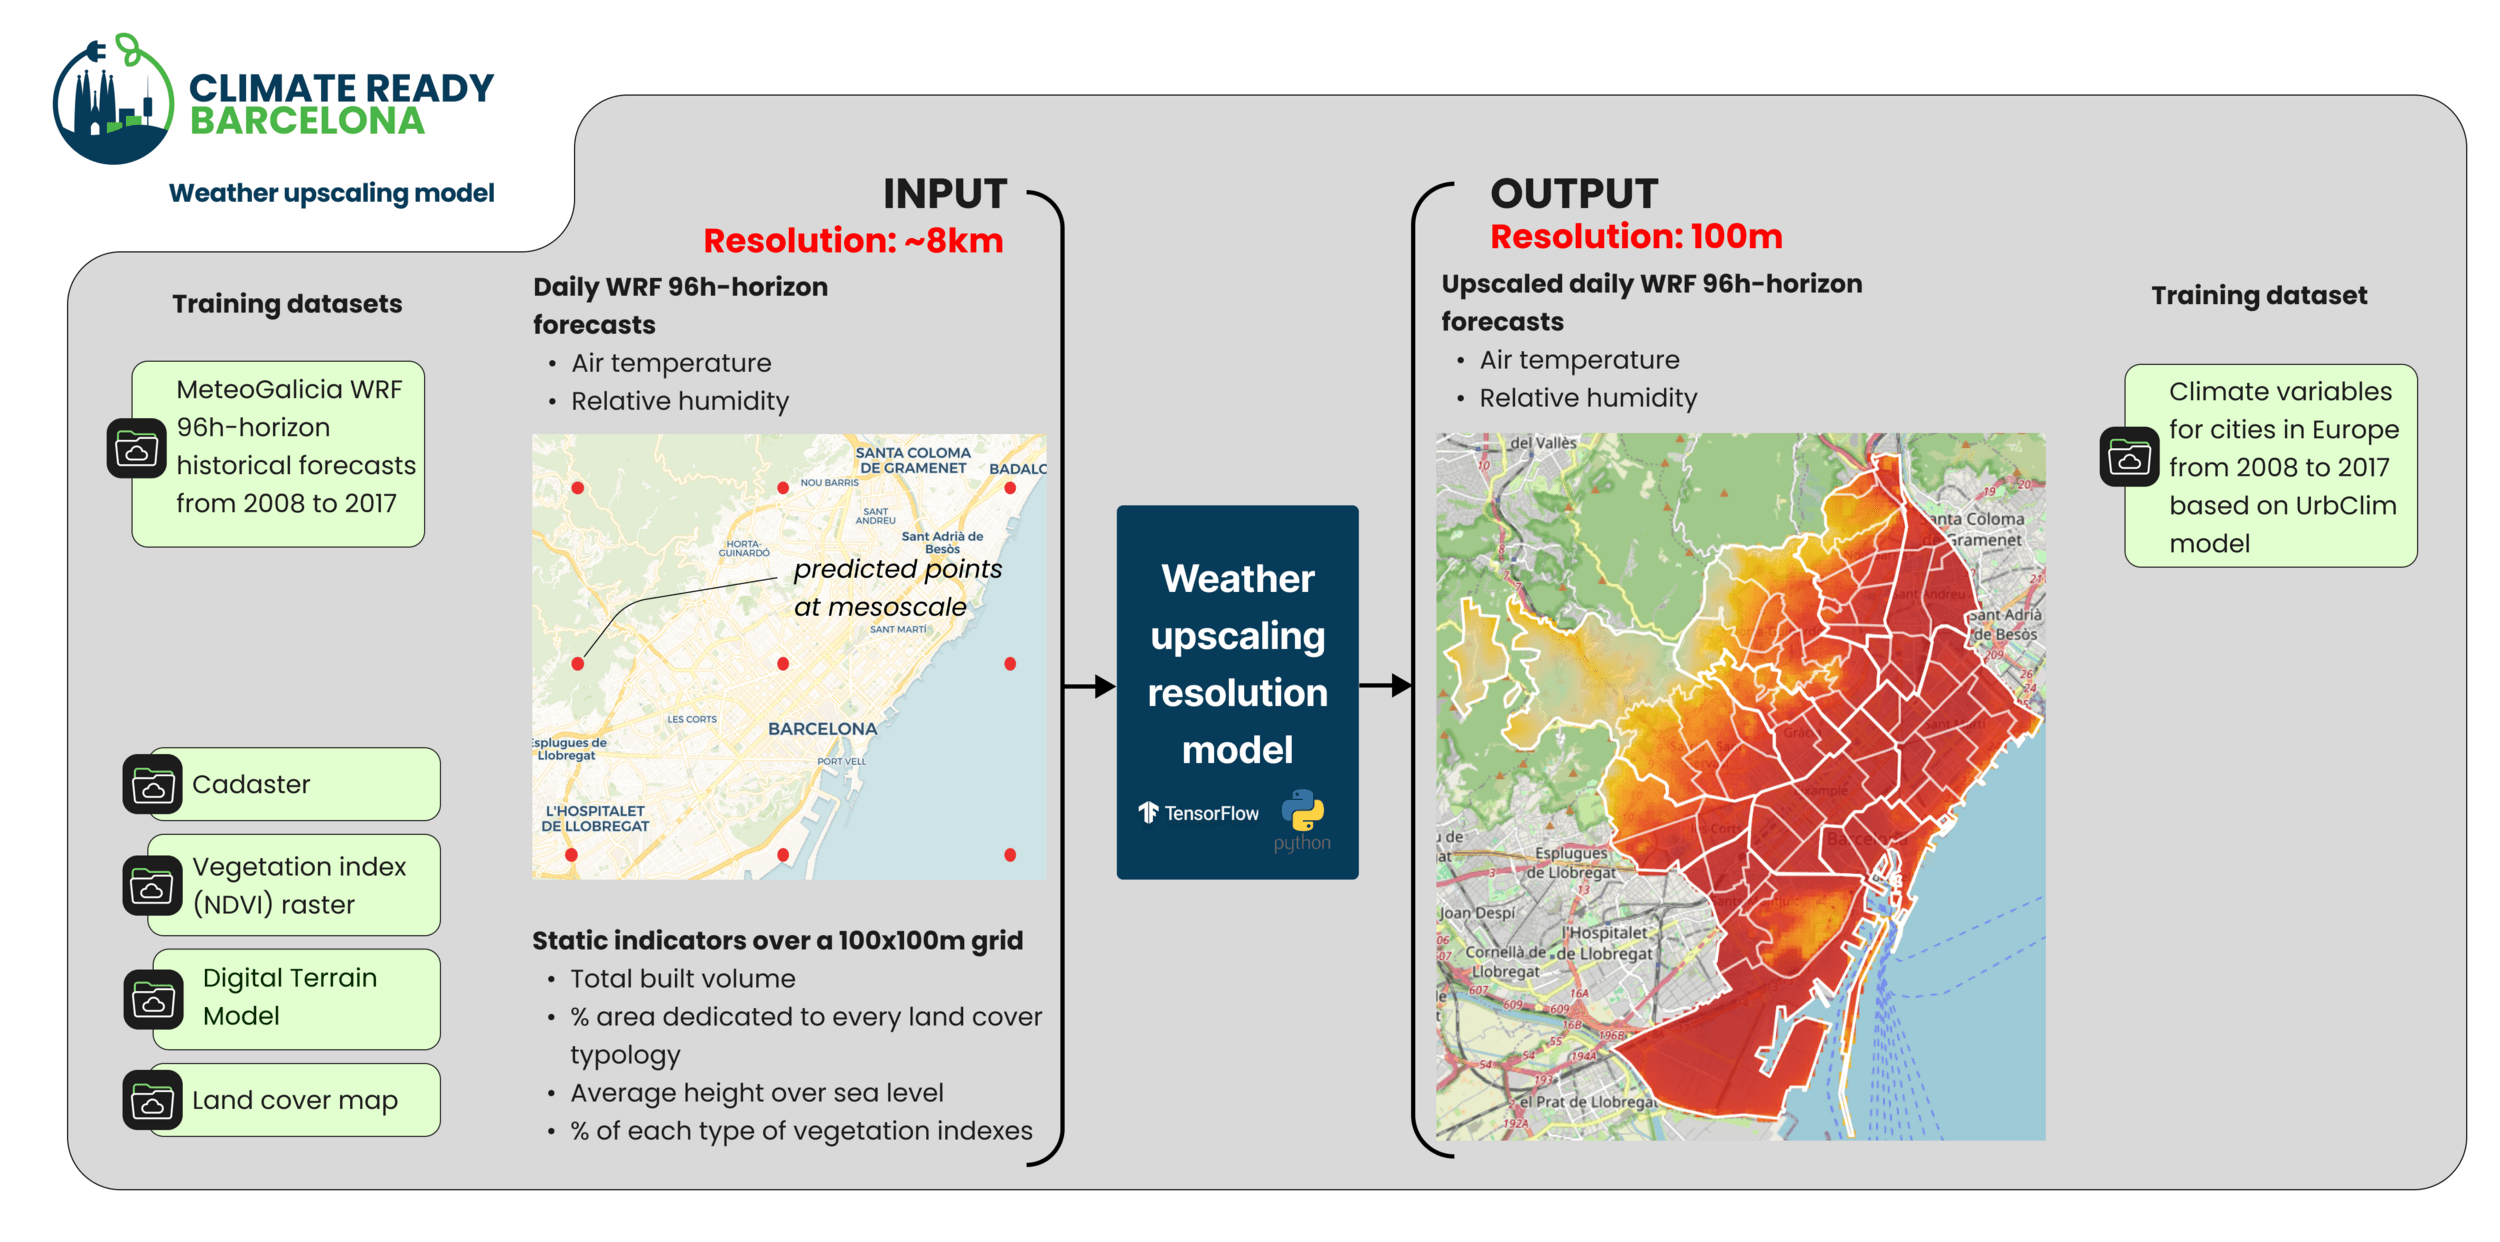
Barcelona's Climate Vulnerability Map
/ Predictive models applied
downscaling
Weather downscaling model
Barcelona's Climate Vulnerability Map
/ Predictive models applied
downscaling
/ Predictive models applied
Thermal demand energy model (using IREC's RC models)
/ Modelling
- 61670 buildings with main or partial residential use (88.7% all BCN buildings)
- Buildings with only residential use:
- Plurifamiliar ≥ 32 dwellings: 1512 (2.45%)
- Plurifamiliar when 32 > dwellings ≥ 12: 8474 (13.75%)
- Plurifamiliar when dwellings < 12: 23345 (37.85%)
- Unifamiliar: 2694 (4.37%)
- Buildings with partial residential use:
- Plurifamiliar ≥ 32 dwellings: 4278 (6.93%)
- Plurifamiliar when 32 > dwellings ≥ 12: 11418 (18.51%)
- Plurifamiliar when dwellings < 12: 9781 (15.87%)
- Unifamiliar: 168 (0.27%)
- Buildings with only residential use:
SHORT TERM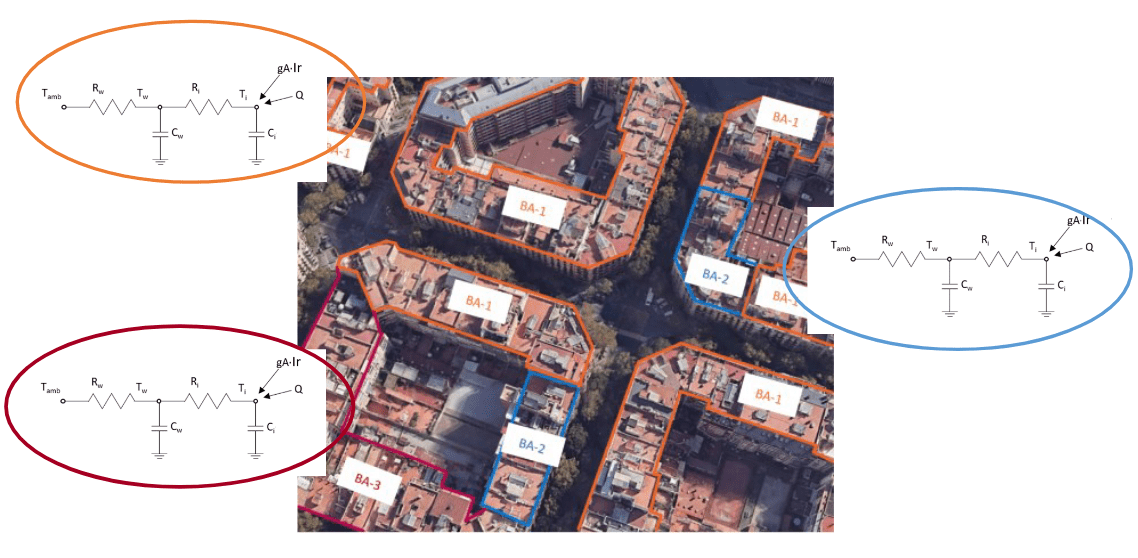
Cooling and heating demand simulation based on a calibrated Resistance and Capacitance Model per each building archetype, which is an electric circuit that imitates in a simplified manner the thermal dynamics of a building.
Barcelona's Climate Vulnerability Map
/ Predictive models applied
Thermal demand energy model (using IREC's RC models)
/ Modelling
SHORT TERMBarcelona's Climate Vulnerability Map
- Building characteristics:
-
Context of nearby buildings
-
Number of dwellings
-
Built area per uses
-
Effective year of construction
-
Category / economic value
-
Typology
-
-
Thermal energy systems
- Most feasible system
- Weather conditions:
- Microlocal weather file
- Demographics and socioeconomics*:
- People per household
- Incomes (sources and annual amount)
- Age range
- Rental Housing Price Index
(*aggregated to census tract or district)
Align each building to one of RC model archetypes
/ Predictive models applied
Thermal demand energy model (using IREC's RC models)
/ Modelling
SHORT TERMBarcelona's Climate Vulnerability Map
-
Model objective
- Characterise actual situation of buildings,
- Any retrofitting scenario will be evaluated
- Calculate Monthly KPIs:
-
Energy demand
- Set-point heating temperatures: 19, 20, 21, 22ºC.
- Set-points cooling temperatures: 26, 27, 28, 29ºC
-
Final energy consumption (assuming most feasible HVAC system)
- Energy demand * System performance
- % Indoor Overheating Hours (during summer in FF conditions, natural ventilating during nights)
-
Energy demand
- Characterise actual situation of buildings,
/ Predictive models applied
/ Modelling
Barcelona's Climate Vulnerability Map
Thermal demand energy model (using UConcordia simulation framework)
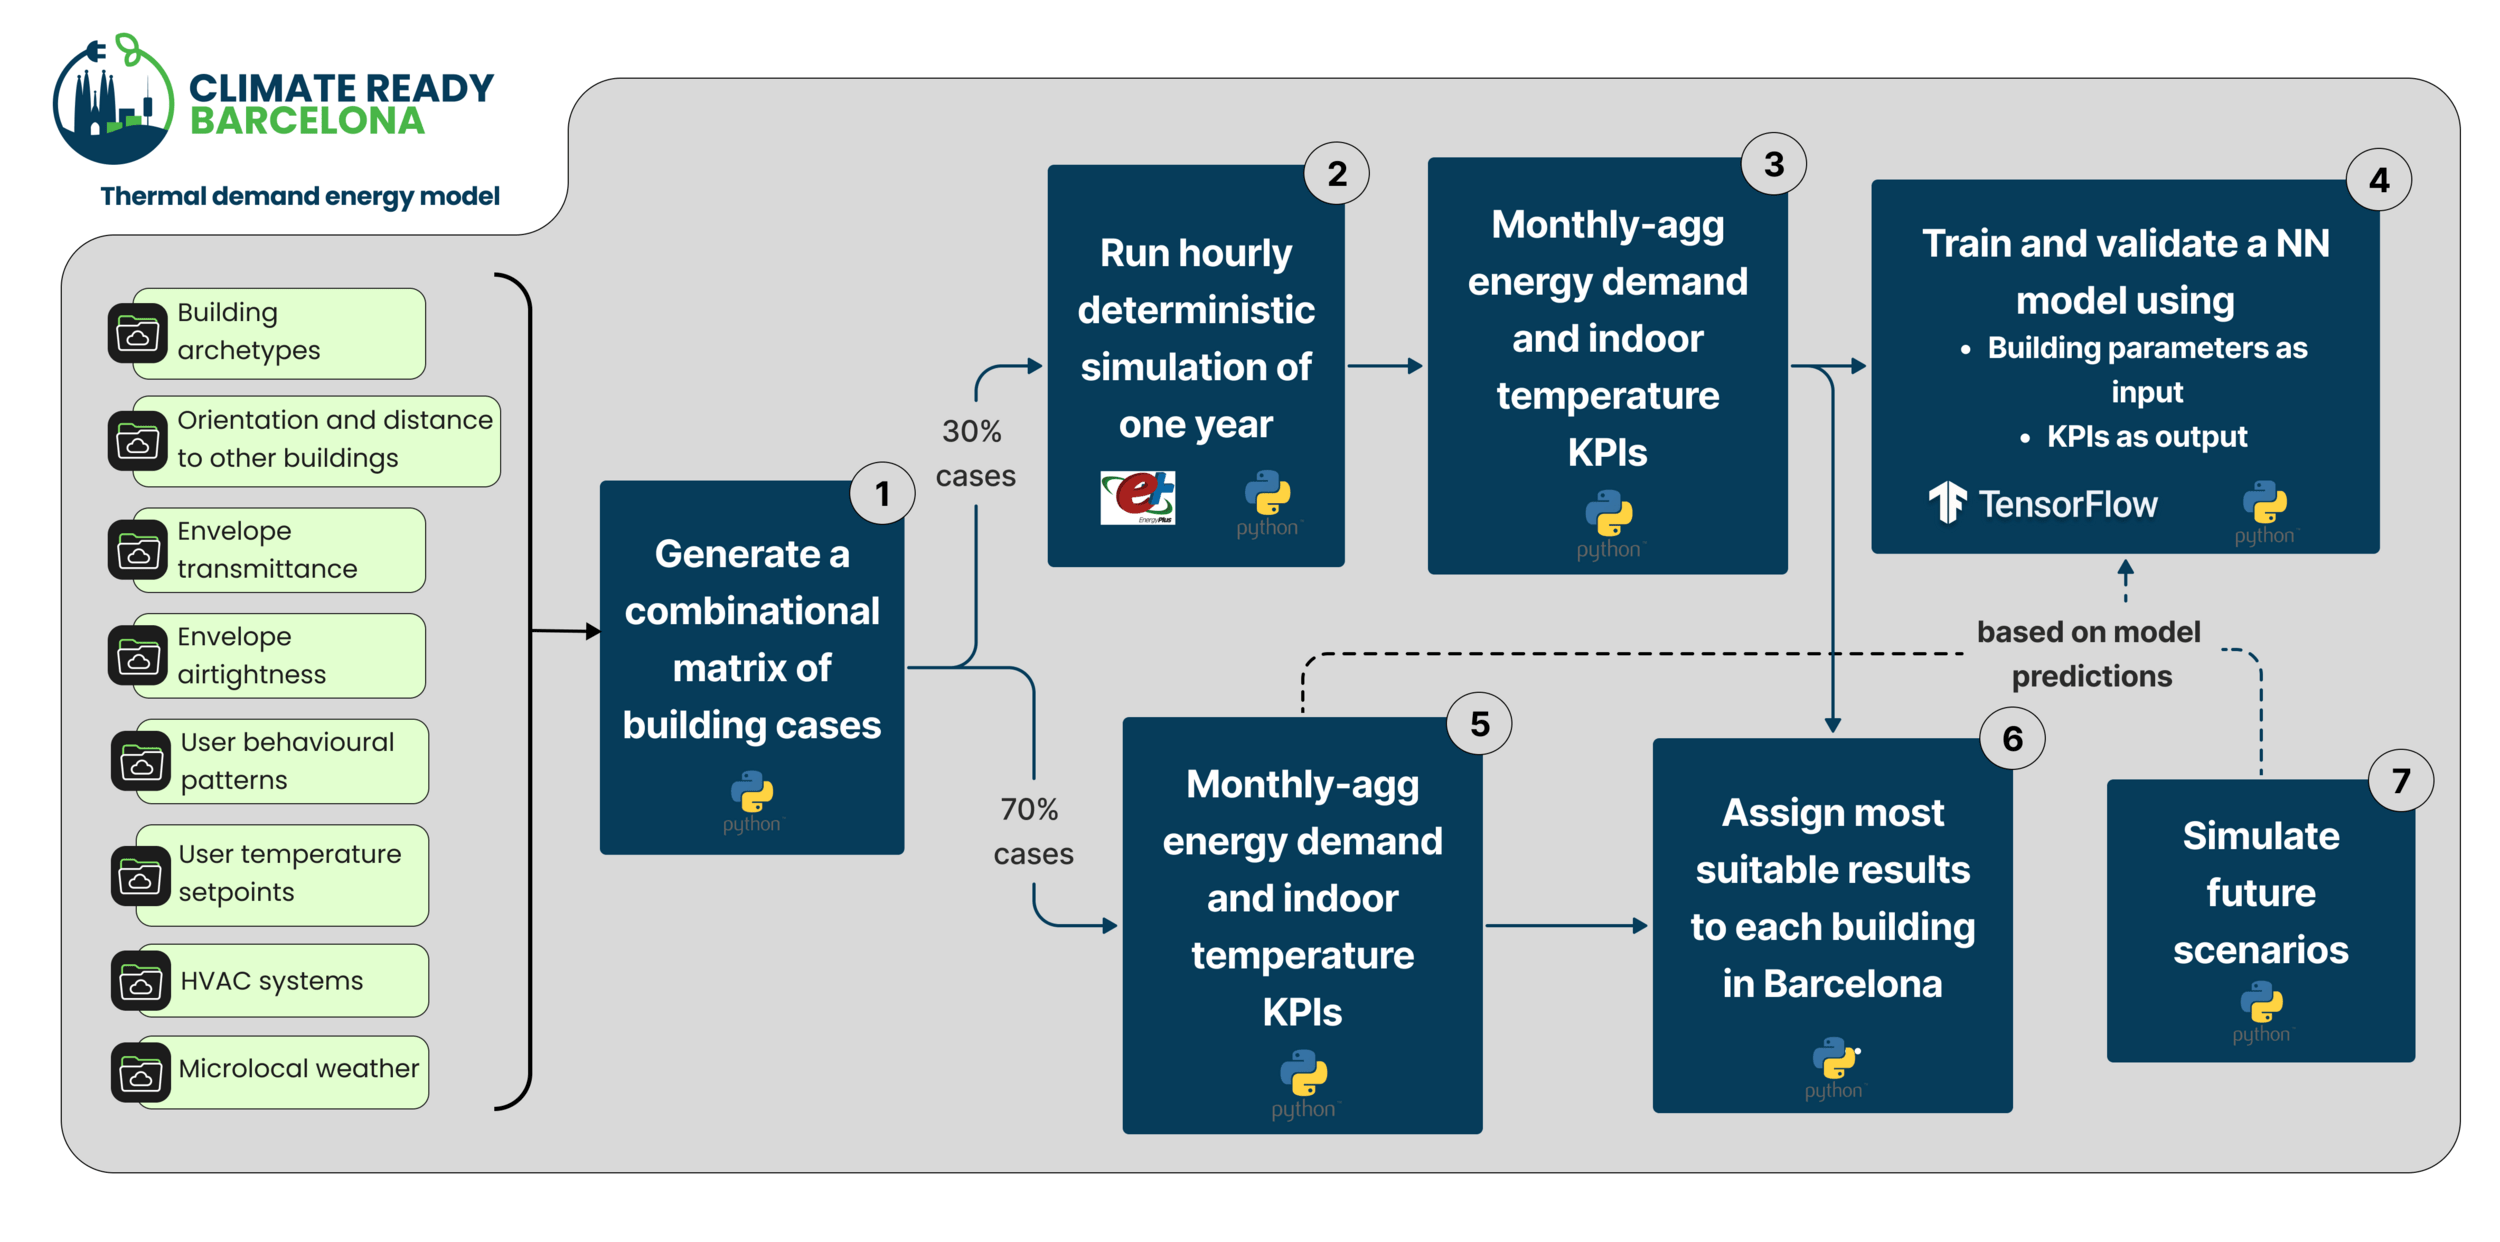
1 - Select a subset of real buildings and their context
2 - Define building envelopes archetypes according to building code
3 - Define user behaviour patterns according to demographics and socioeconomic profiles
4 - Define building systems archetypes according to EPC and cadastral data
5 - Define microlocal weather input files
LONG TERMBarcelona's Climate Vulnerability Map
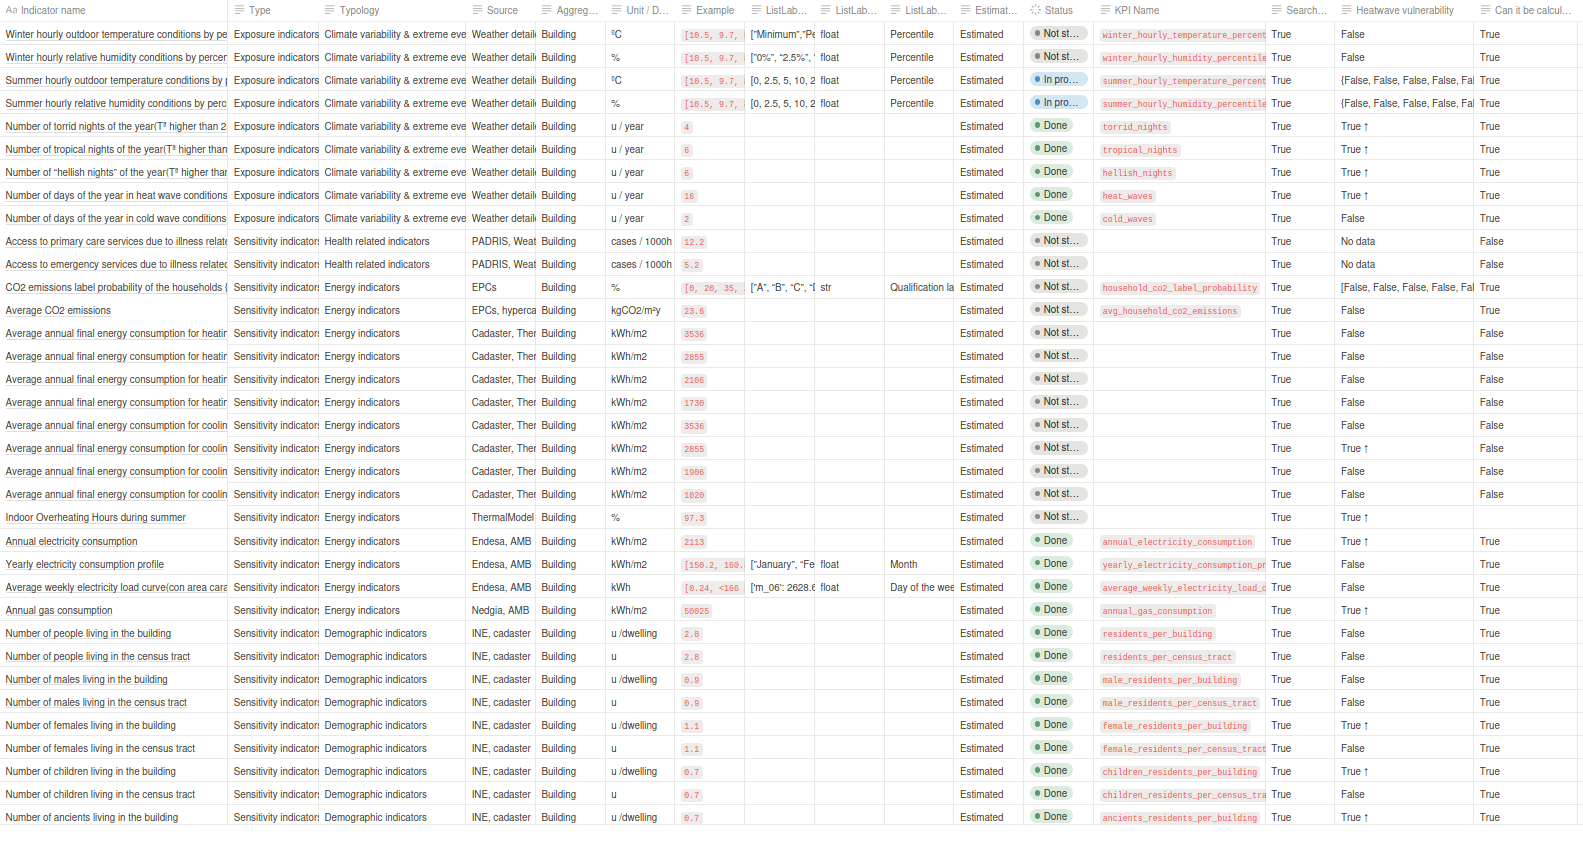
Key Performance Indicators
List of KPIs
/ Key Performance Indicators
Barcelona's Climate Vulnerability Map
Are there any questions at this point?
Barcelona's Climate Vulnerability Map
Results obtained and map visualisation
Barcelona's Climate Vulnerability Map
User interface
/ Results obtained and map visualisation
Barcelona's Climate Vulnerability Map
Barcelona's Climate Vulnerability Map
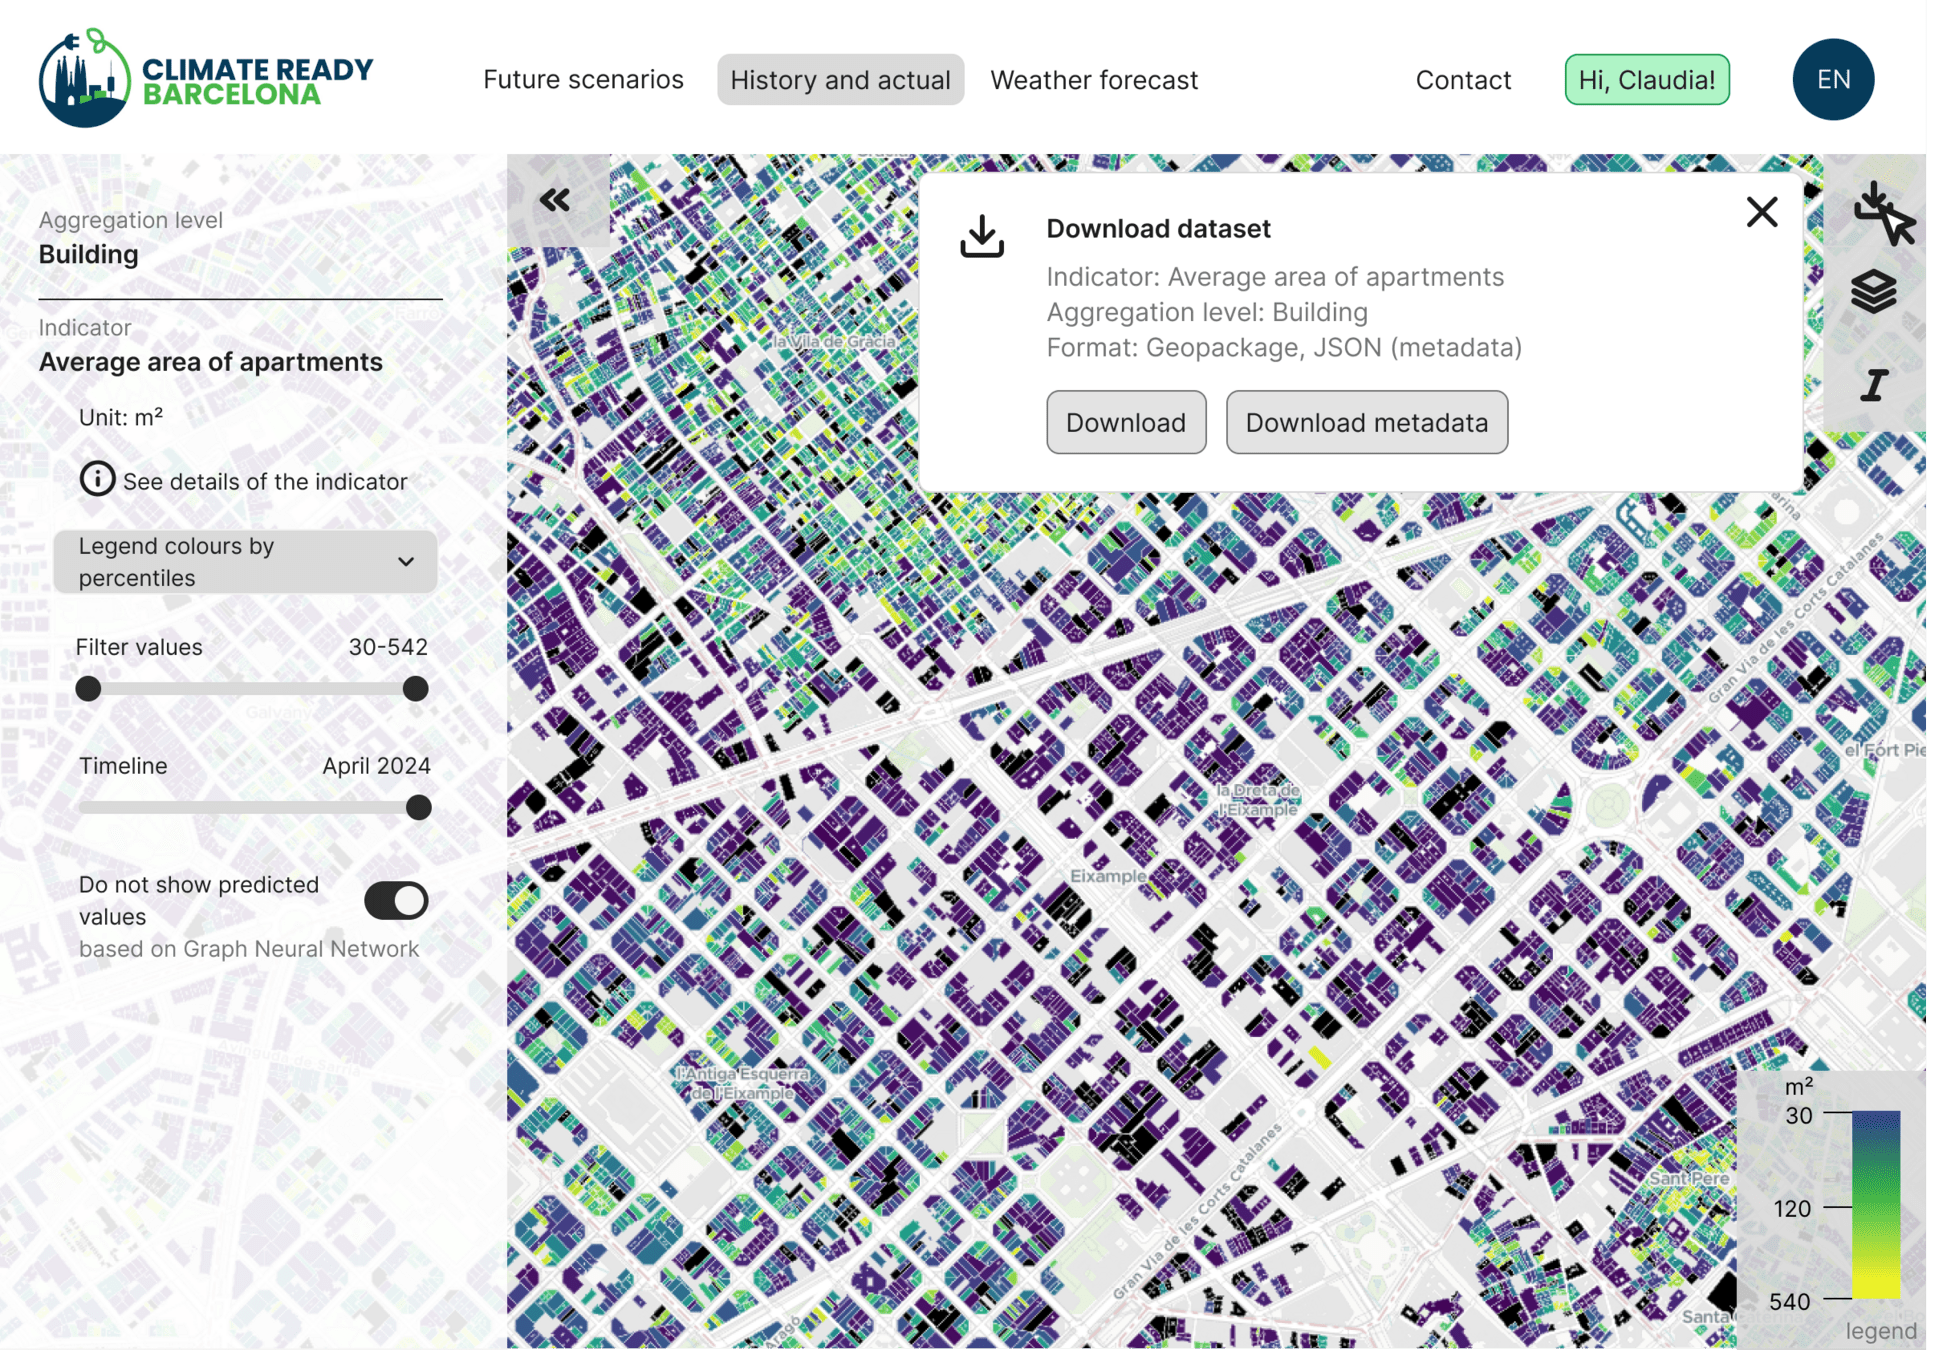
User interface
/ Results obtained and map visualisation
Barcelona's Climate Vulnerability Map

User interface
/ Results obtained and map visualisation
Barcelona's Climate Vulnerability Map
User interface
/ Results obtained and map visualisation
Barcelona's Climate Vulnerability Map
User interface
/ Results obtained and map visualisation
Questions & Answers
Further information: jmbroto@cimne.upc.edu
Workshop March 7th 2025 - CRBCN Vulnerability Map of Barcelona
By CIMNE BEE Group
Workshop March 7th 2025 - CRBCN Vulnerability Map of Barcelona
Explora el mapa de vulnerabilitat climàtica de Barcelona, que presenta perspectives d'experts i una plataforma de dades sòlida. Descobreix com s'avalua la vulnerabilitat i els conjunts de dades innovadors que informen aquesta anàlisi ambiental crucial.


