


Content ITV PRO
This is Itvedant Content department
Exploring DMart Sales & Understanding Key Fields
Business Scenario
You have recently joined DMart, one of India’s leading retail chains, as a Junior Data Analyst Intern. Today is your first day at work, and you’ve been assigned to the Sales Analytics Team.
Before you start analysing anything, you need to understand the business and the data we work with.
In real-world analytics, jumping directly into analysis without understanding the dataset often leads to incorrect insights.
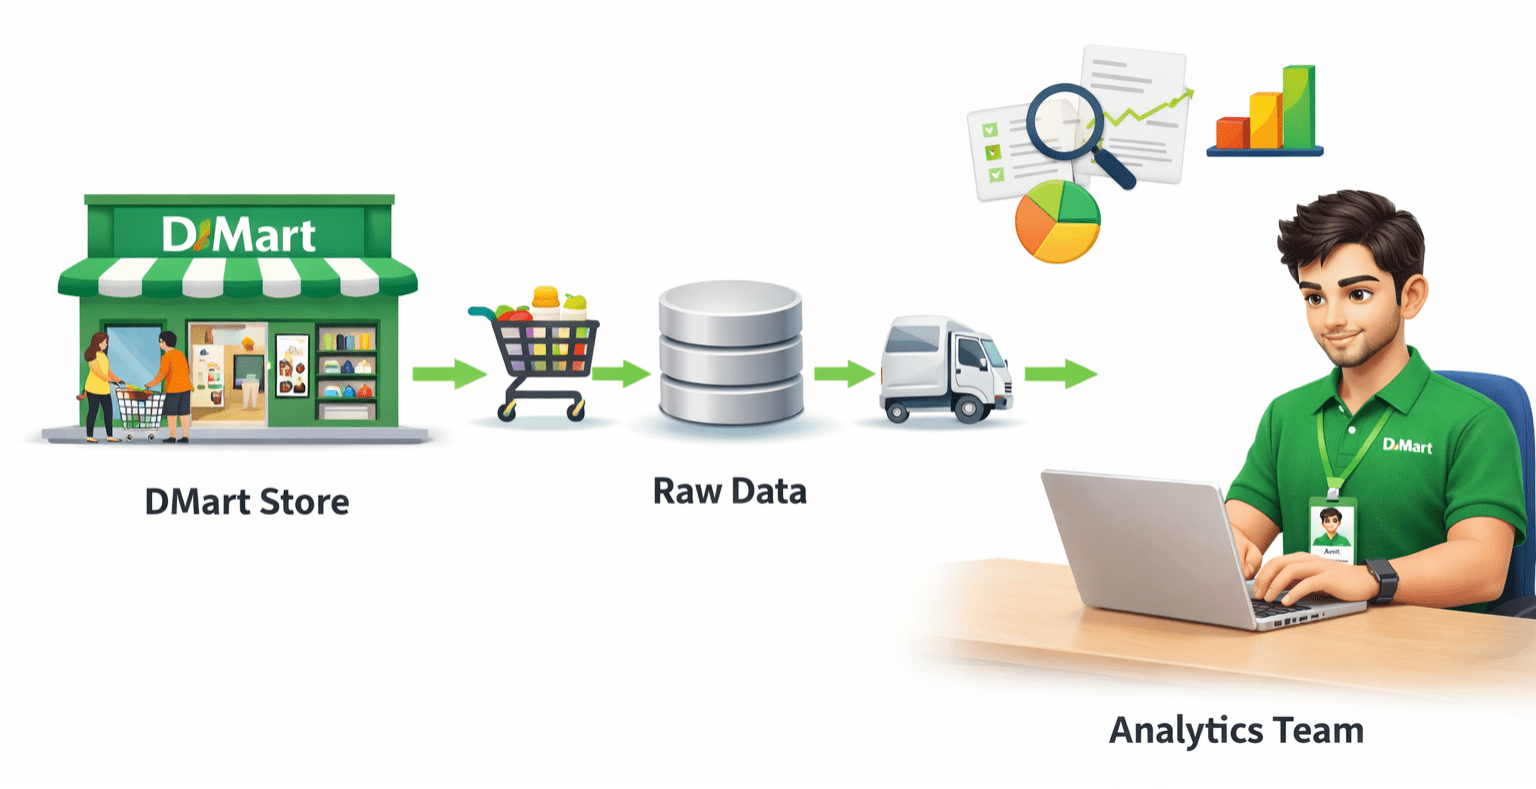
DMart operates across Multiple regions and sells products from different categories. Every Transaction - From Customer.
Purchase to delivery is recorded in the company internal system.This raw data is shared with the Analytics Team to track performance, identify trends and support business decisions.
Your Manager Provides you with the sales Dataset and explains that
Before Performing any analysis, your first responsibility is to:
Pre-Lab Preparation
1) Introduction to Data
2) Introduction to Git
In this task, you will begin by understanding the business problem and the structure of the dataset provided to you. This is a crucial first step in any data analysis workflow.
Task 1: Understand Business Context and Dataset Structure
Access the Dataset
1
Data set link - DeMart Dataset
Observe the Dataset Layout
2
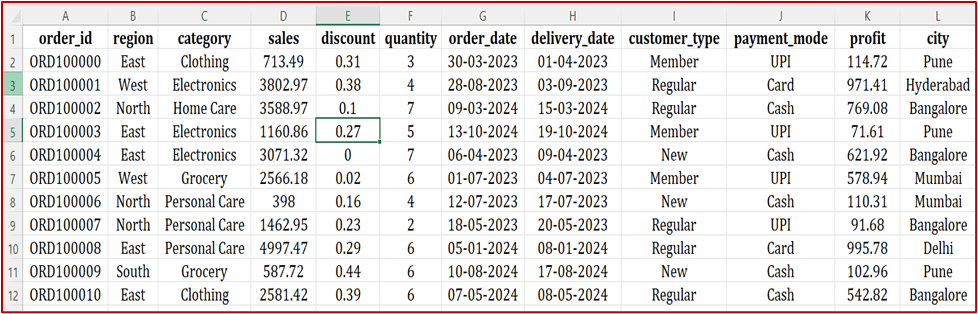
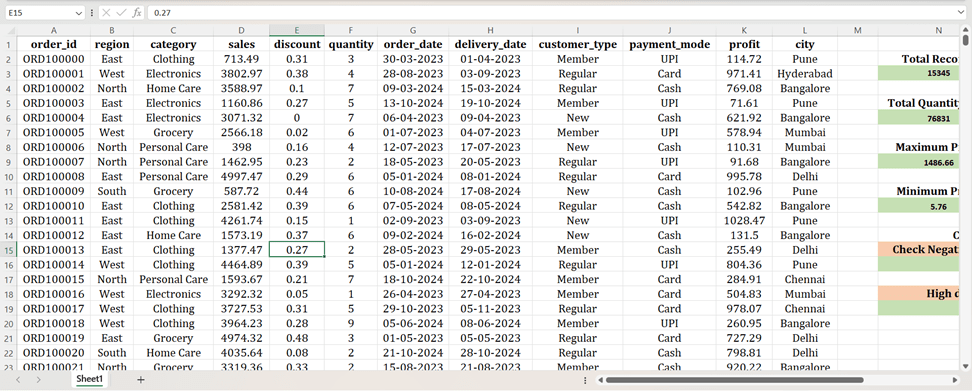
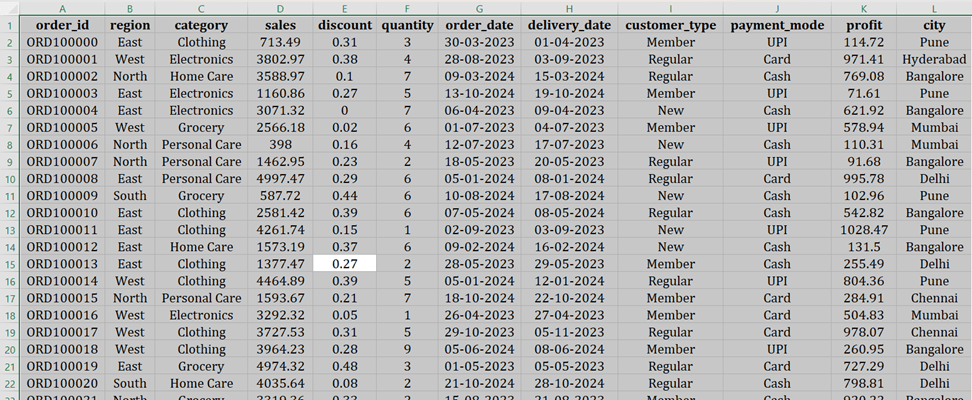
Once the dataset is open in Excel or Google Spreadsheet.Observe how the data is structured:
Identify Dataset Components
3
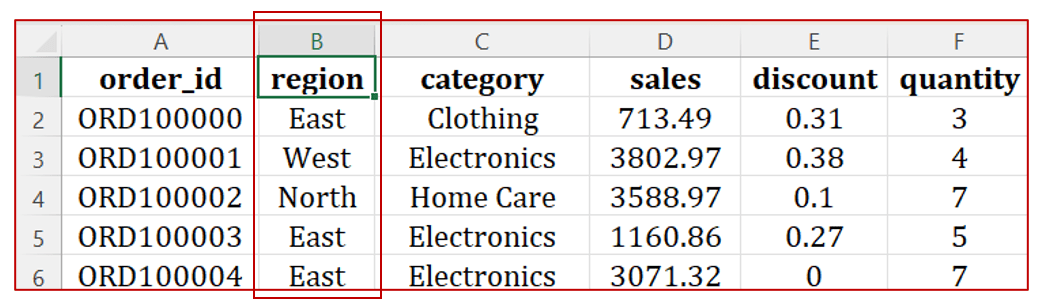
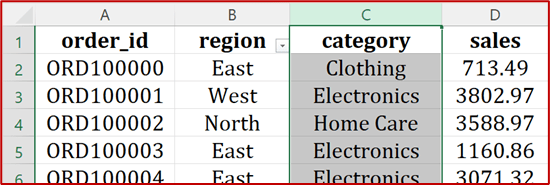
Carefully observe the dataset and understand what each column represents:
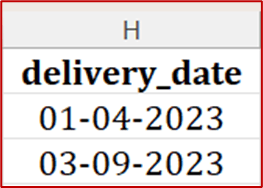
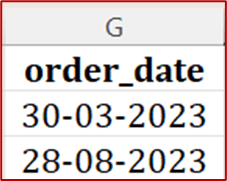
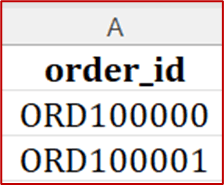
Order Information: order_id, order_date, delivery_date
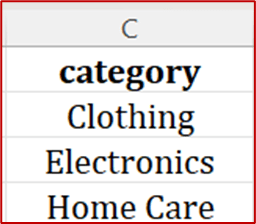
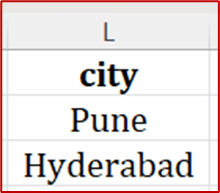
Location Information: region, city
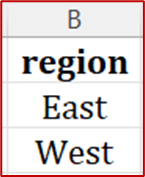
Product Information: Category
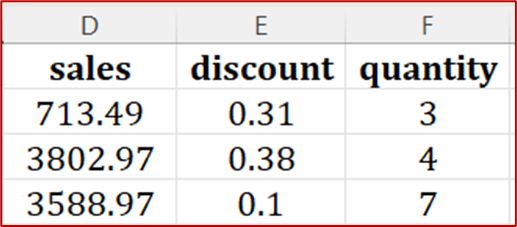
Sales Metrics: sales, quantity, discount, profit
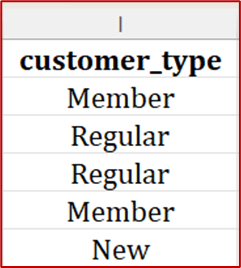
Customer Details: Customer_type
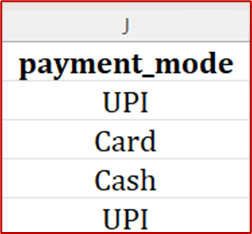
Transaction Details: payment_mode
Task 2: Explore Dataset to Identify Records, Regions, Product Categories, and Key Fields
In this task, you will actively explore the dataset using Excel to extract basic but important information.
This step helps you understand the scale, coverage, and structure of the data before performing any analysis.
Find Total Number of Records
Select the Dataset and Click on any cell inside the dataset.
1
Press Ctrl + A to select the entire data
2
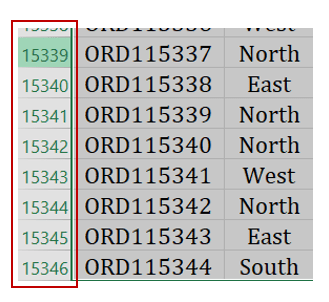
Count Total Rows
3
Formula
Total Records = (Last Row Number - 1) [(Exclude header row)]
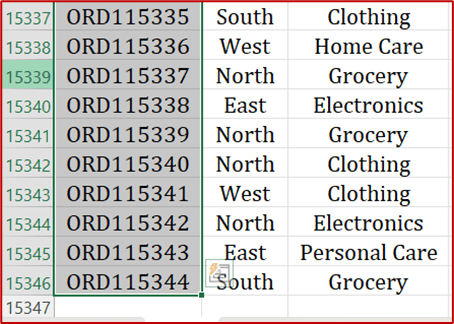
Alternatively Click on any column with continuous data (e.g., order_id)
4
Press Ctrl + Shift + ↓ and Observe the row number at the bottom
5
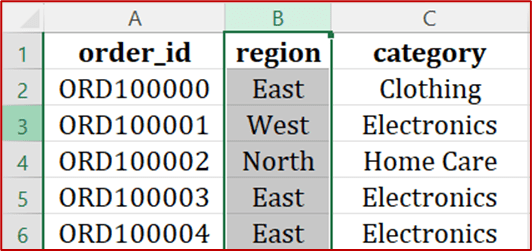
Locate Region Column and Find the column named region
6
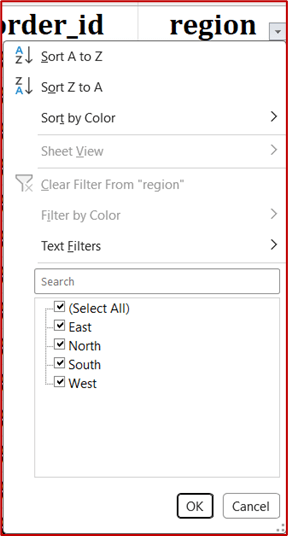
Identify Unique Regions
Select the header row
7
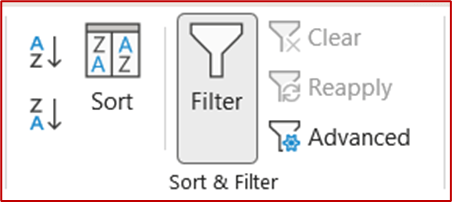
Go to Data Tab → Filter
8
Click on filter, filter will be added to region column
9
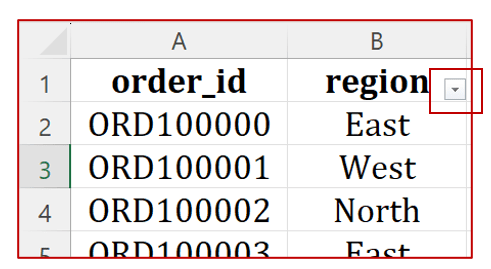
To View Unique Values, Click the filter dropdown as shown in above image on region and Observe all unique region names
10
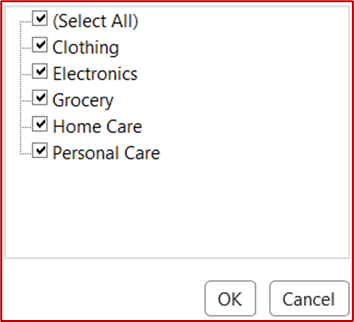
Locate Category Column
11
Apply Filter as discussed above and Click the filter dropdown on category
12
Identify Product Categories
Observe Values and note all unique categories available such as Clothing,Electronics,Grocery,Home Care and Personal Care.
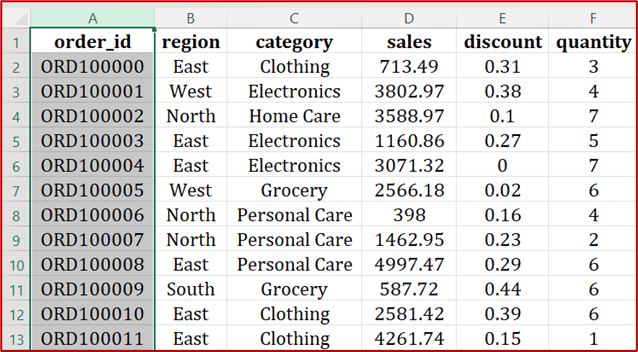
Observe Header Row of the dataset
13
Read Column Names and Categorise Fields
14
Identify Available Fields (Columns)
Task 3: Apply Git Version Control (Setup, Upload, and Manage Changes)
After explaining the dataset, your manager adds that,
“In our team, we don’t just work on data locally. Every dataset, report, and analysis is managed and shared
through version control systems like Git. This helps us track changes, collaborate efficiently,
and maintain proper documentation.”
You are informed that:
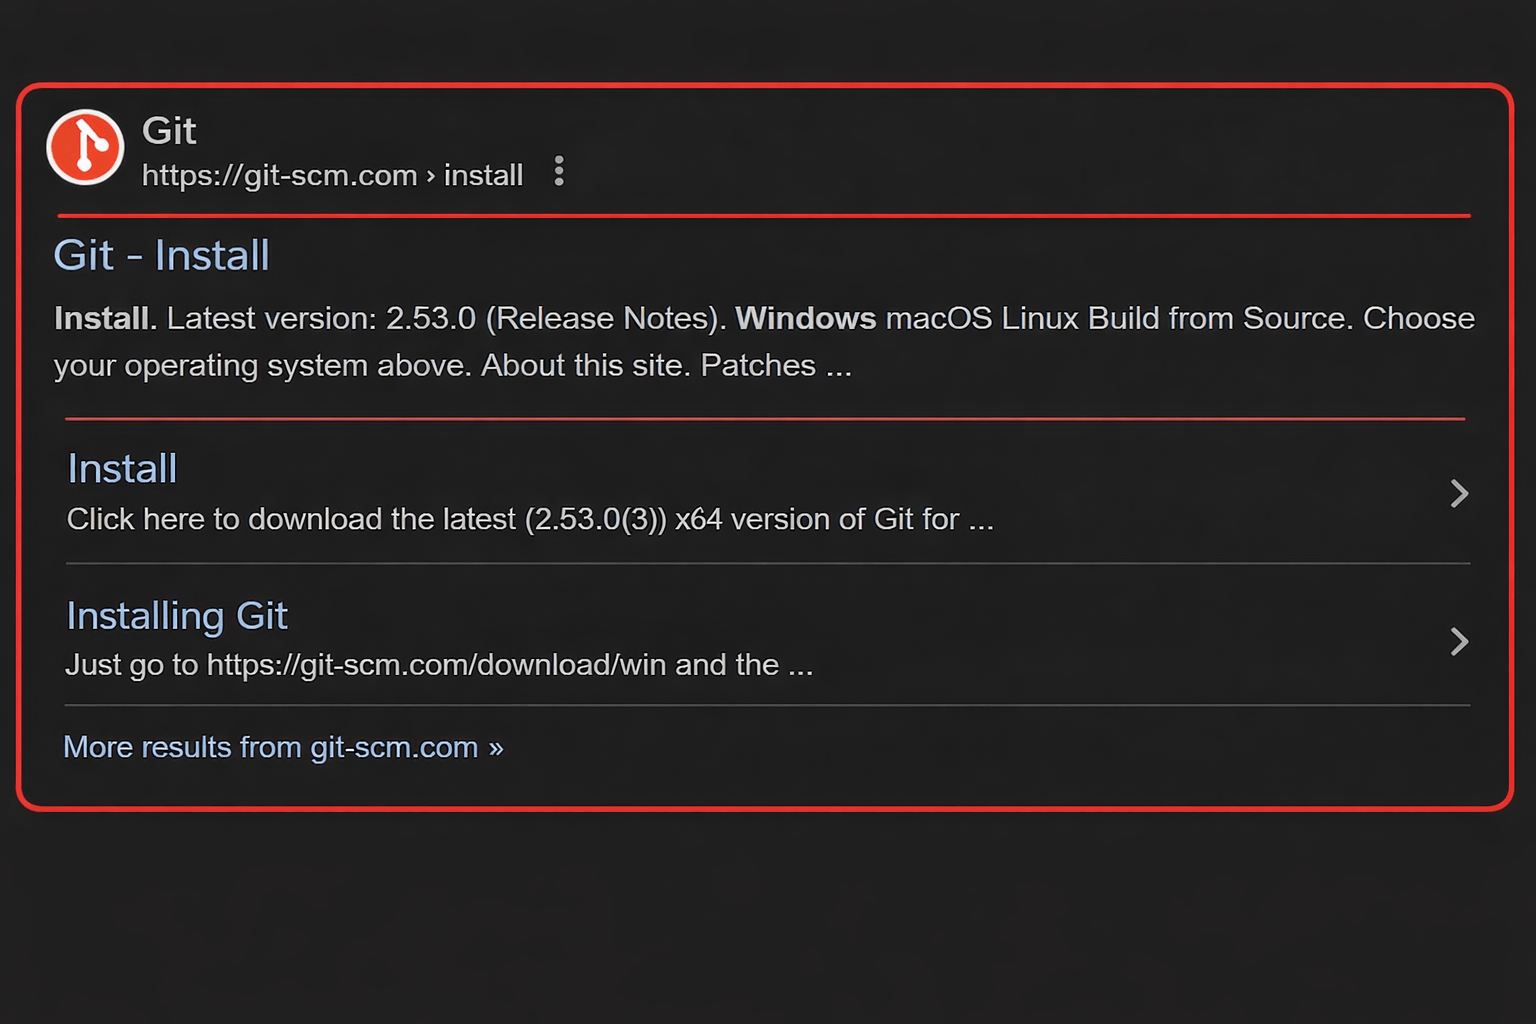
Search on google how to install Git
1
Select the Git install showed in the below image , it will redirect you to install section.
2
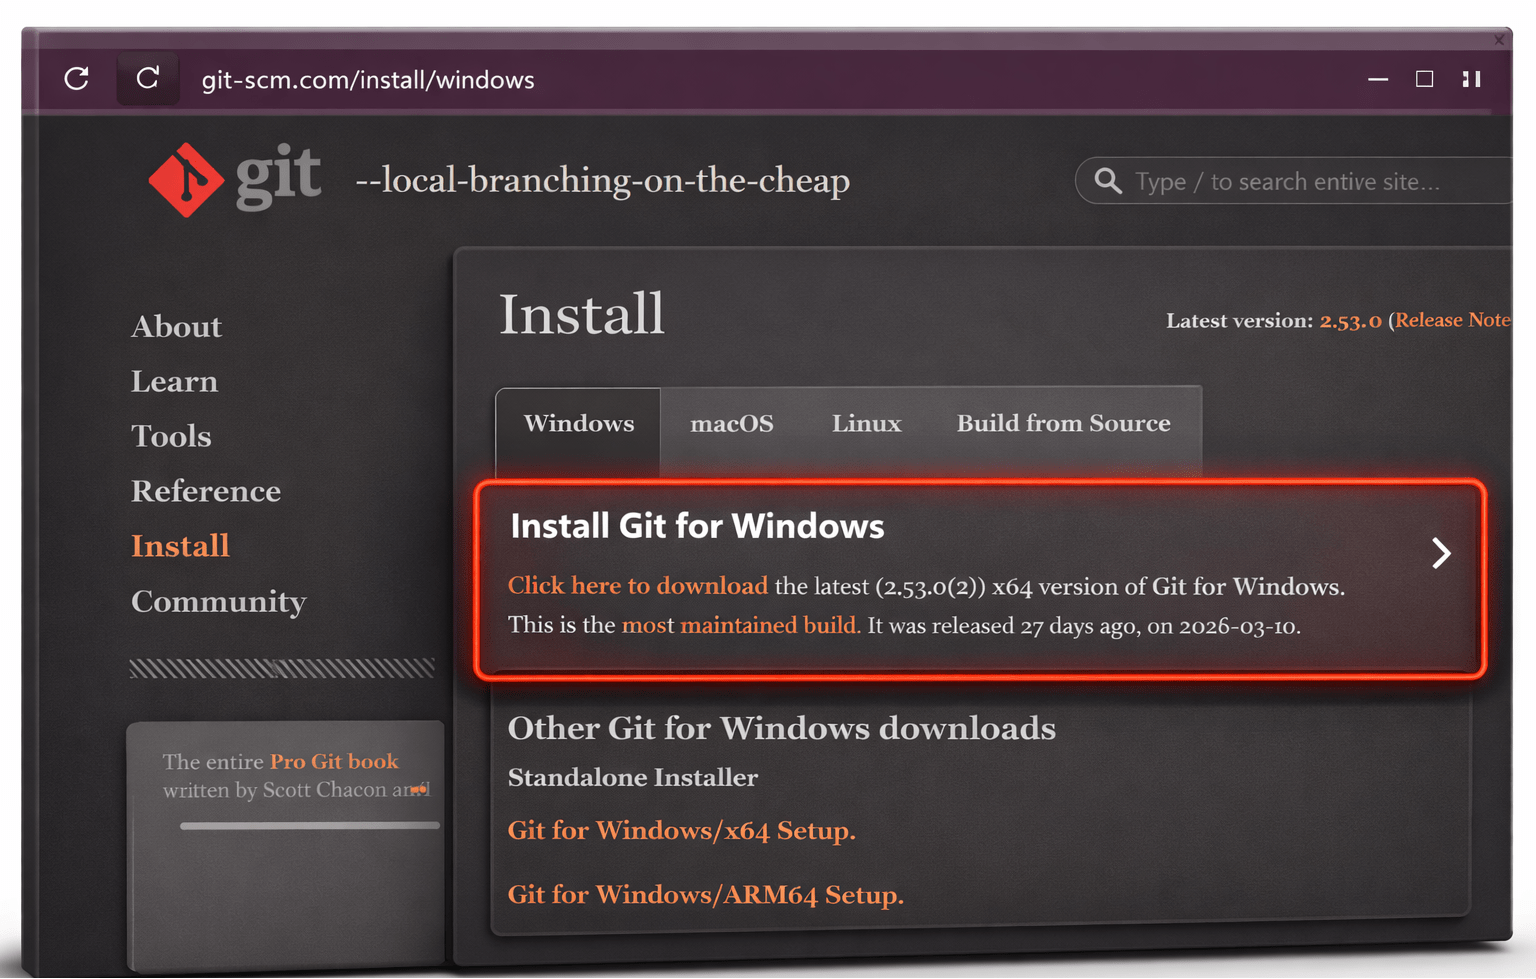
Select the Git install as per the operating system. In this case we are assuming Operating system to be Windows hence selecting install Git for windows Option.
3
After downloading you can See Git on your Machine
4
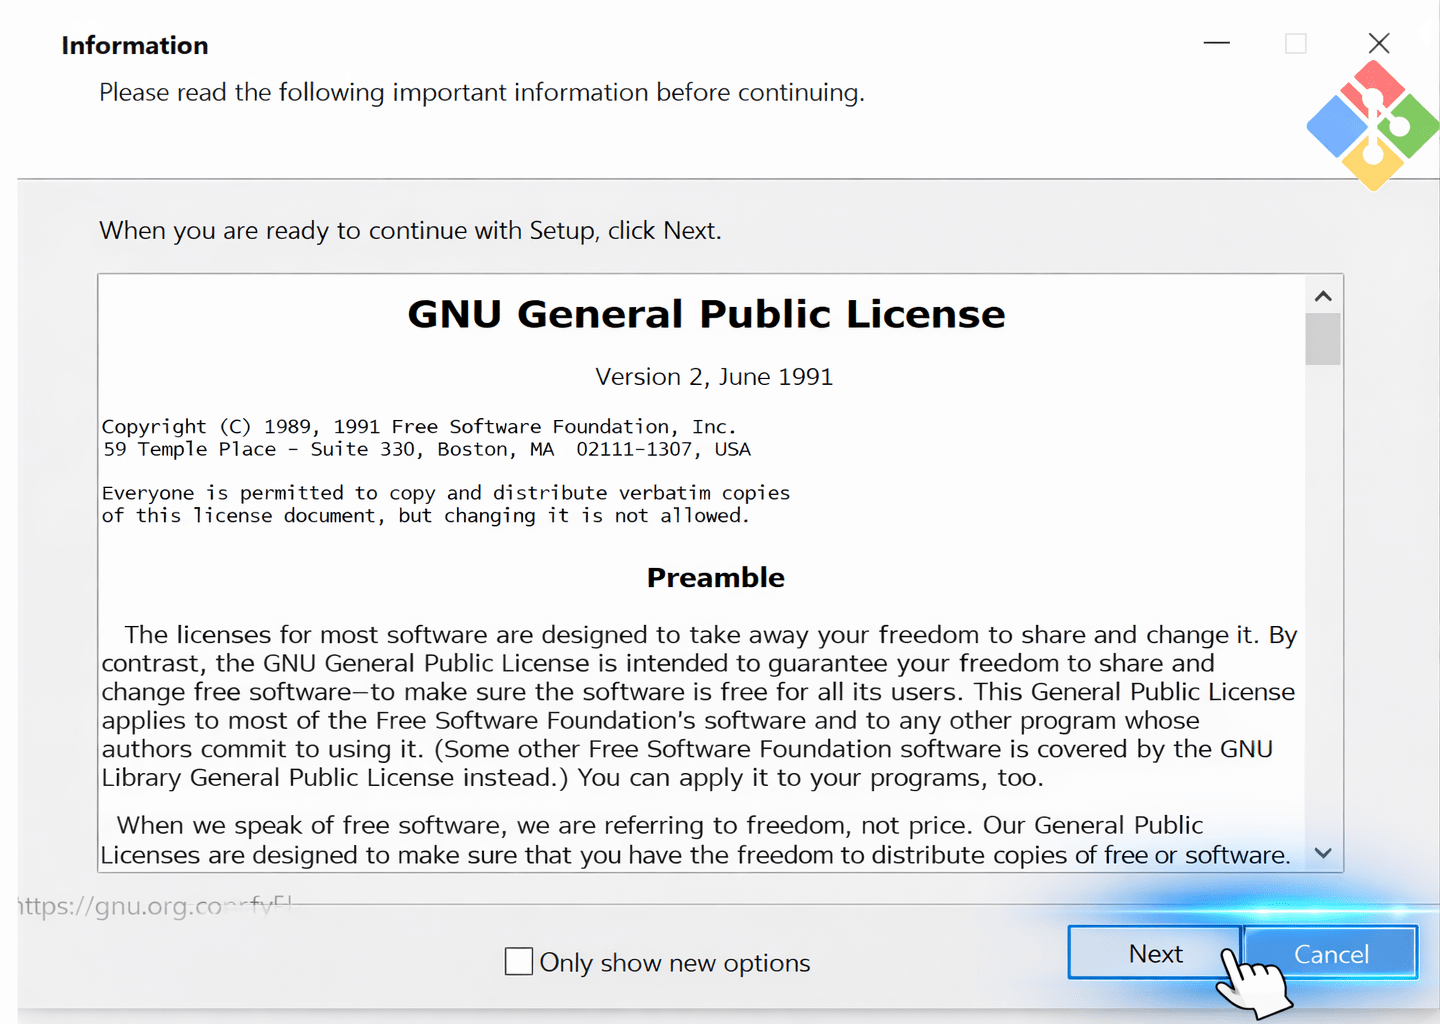
After clicking on that follow the instruction,Click on Next button
5
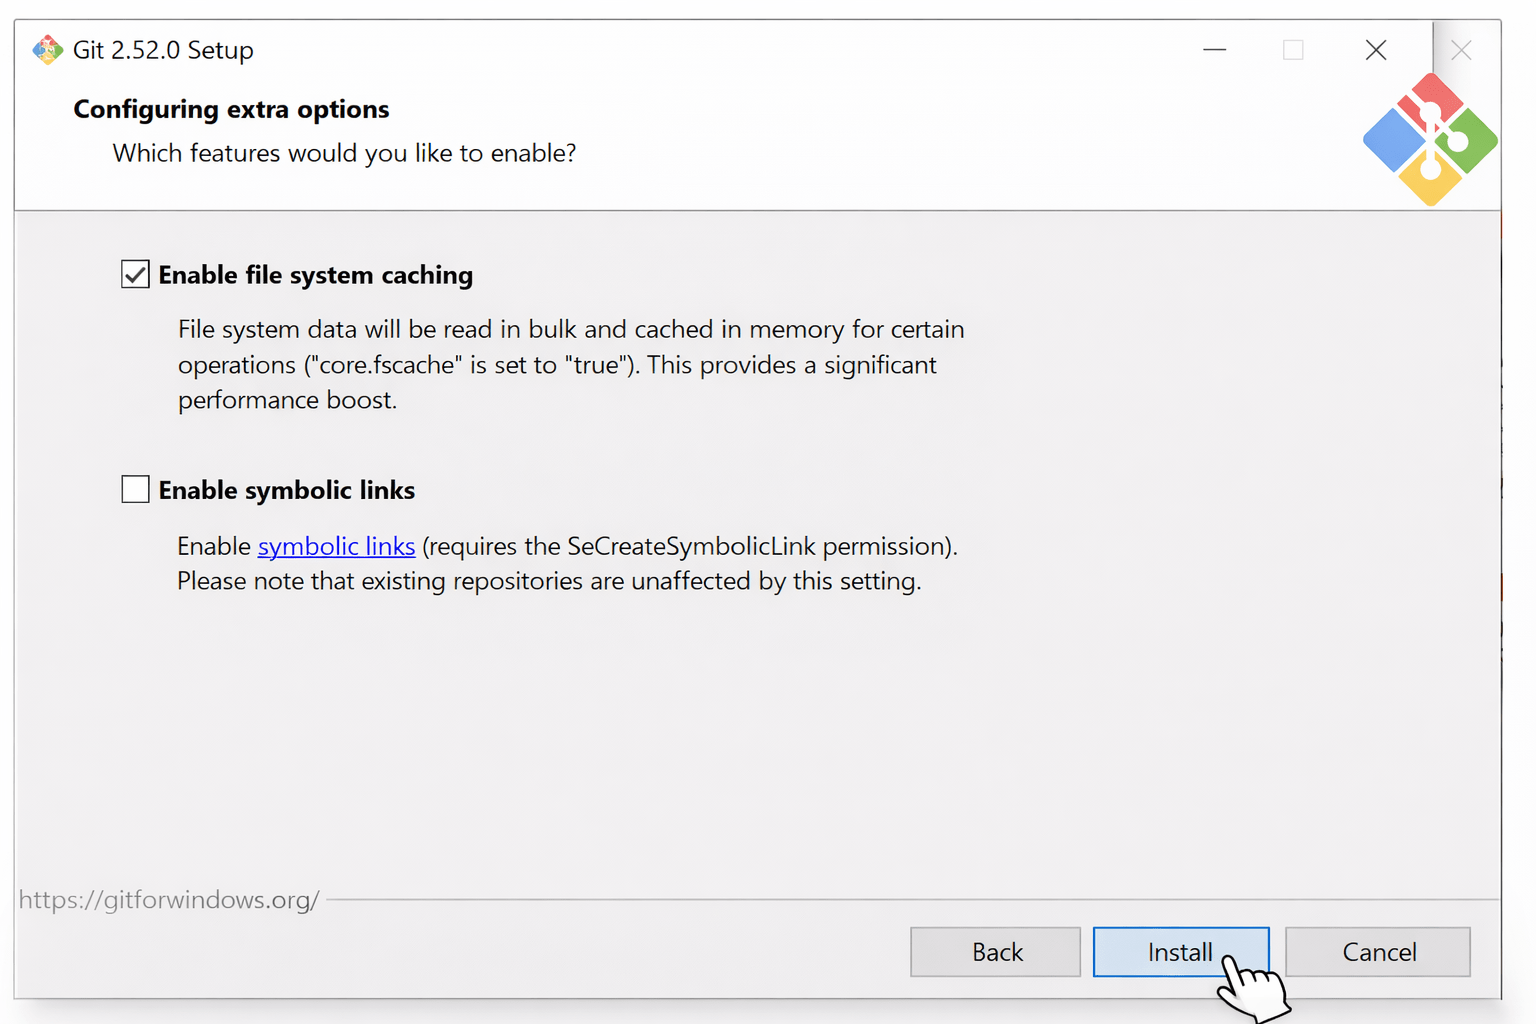
Click On this
Click on install Button
6
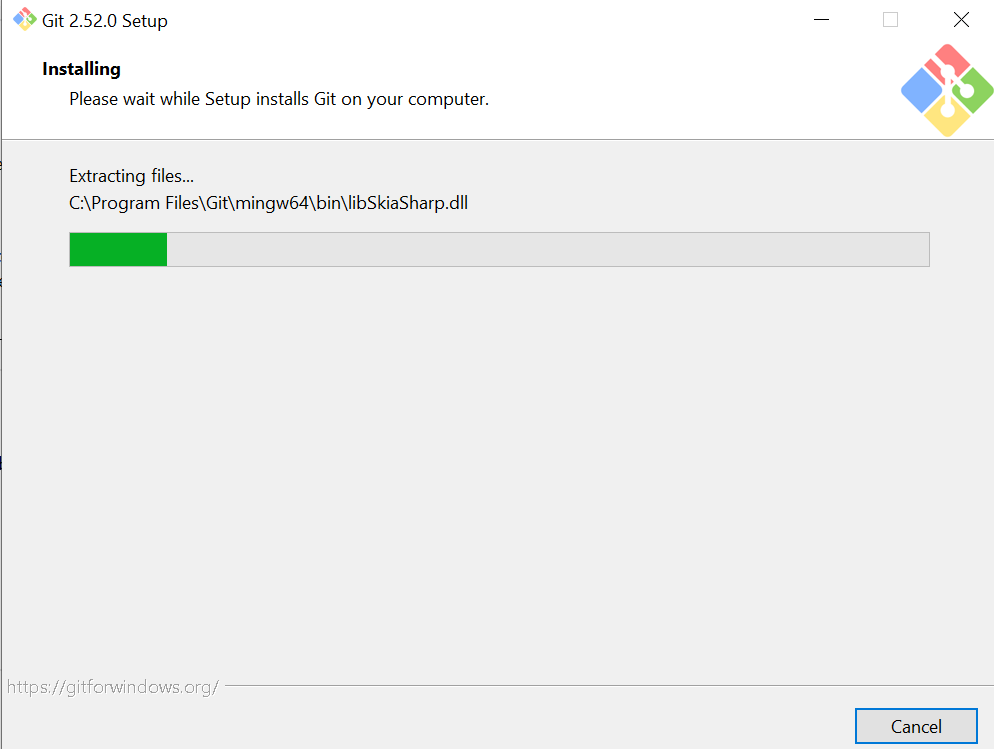
After Click on the Install you See Installation starts
7
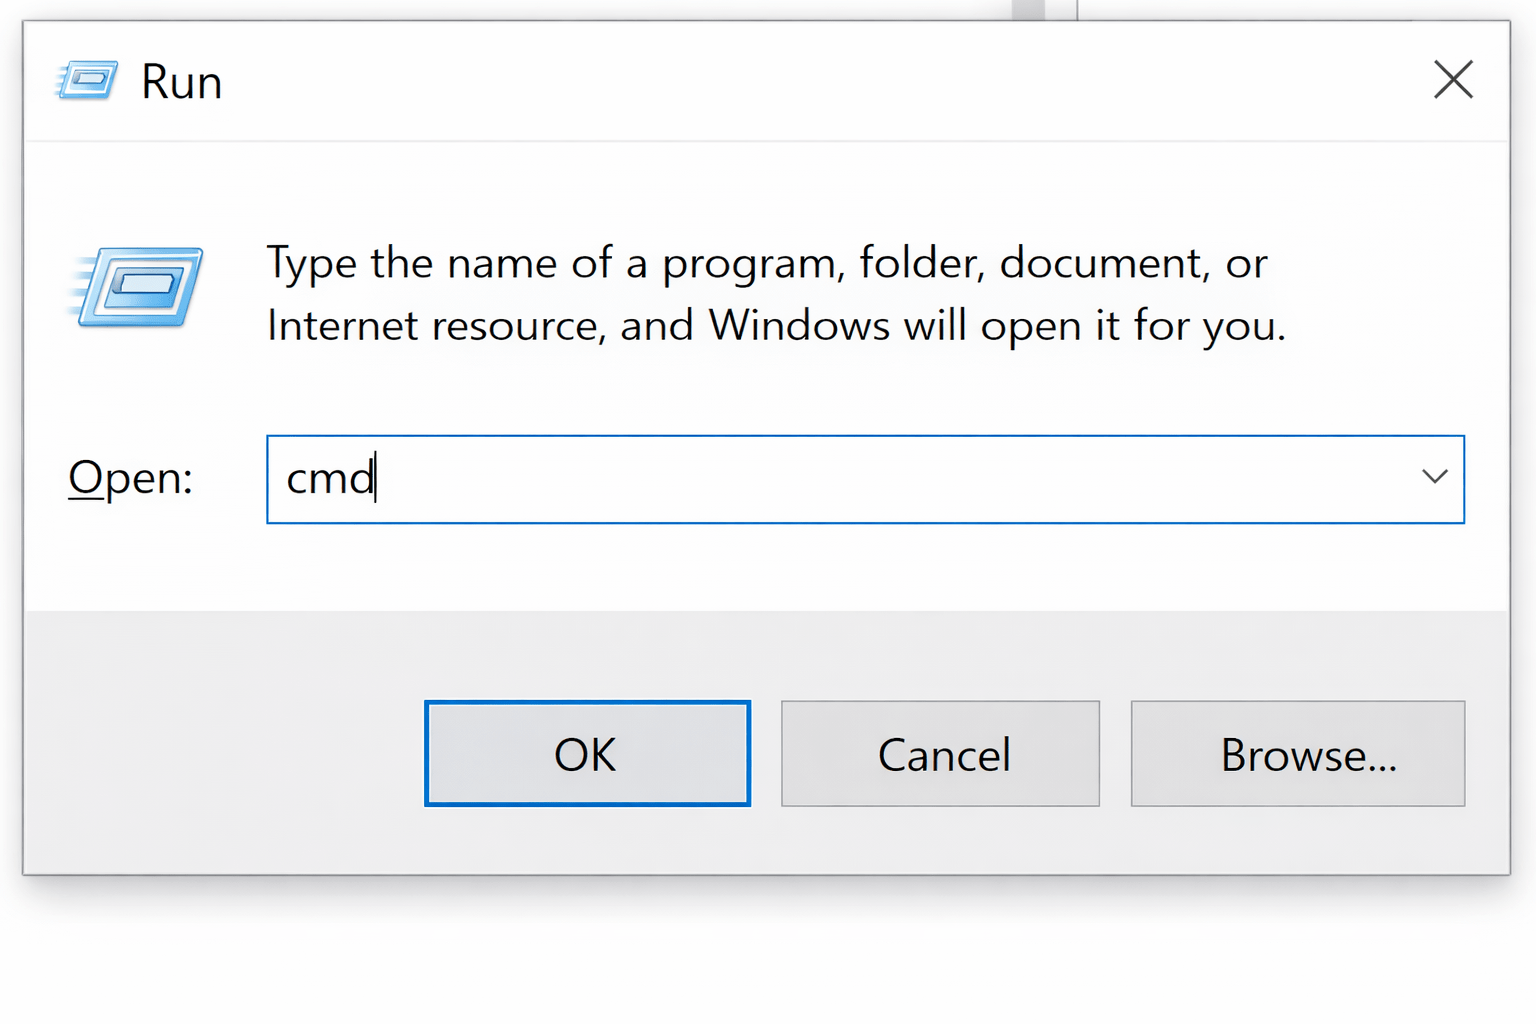
Open CMD as shown below
8
Type "git --version" as shown below and hit enter button. If you are able to see version number of install git software then its signify that installation was successfully completed on your Machine.
9
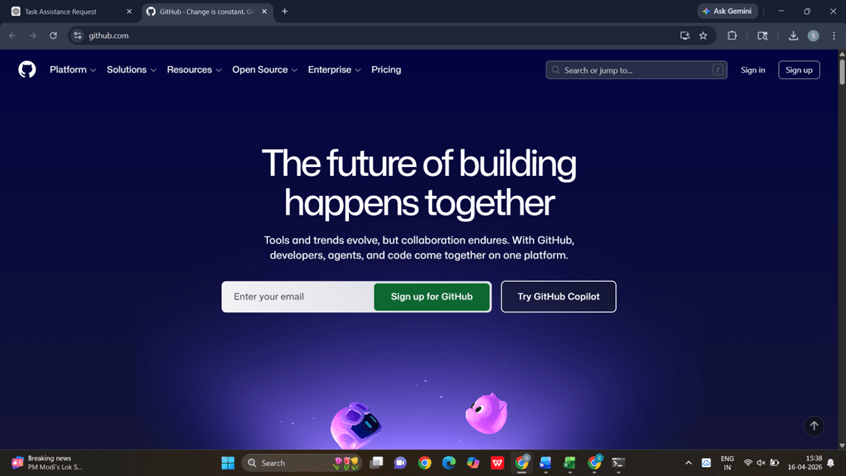
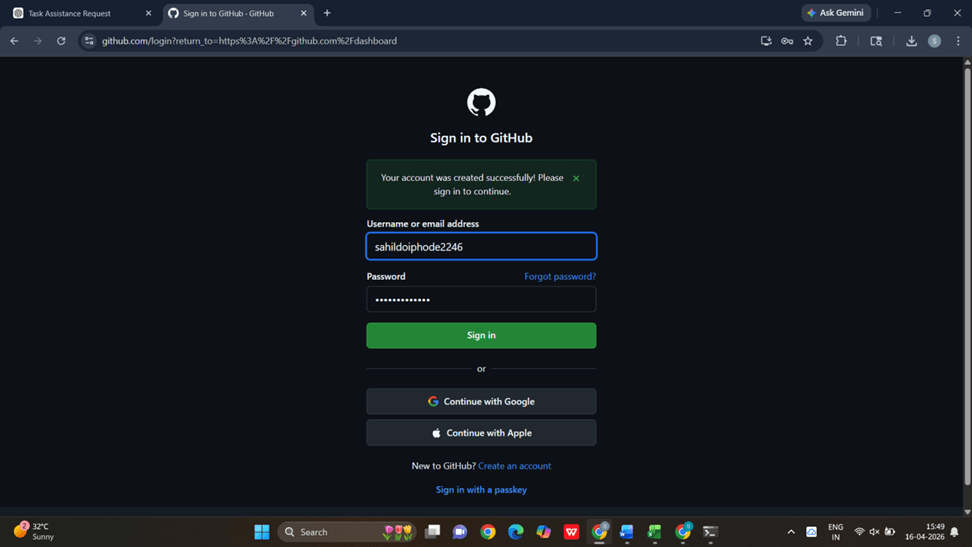
Go to GitHub or Open: https://github.com and click on Sign up
1
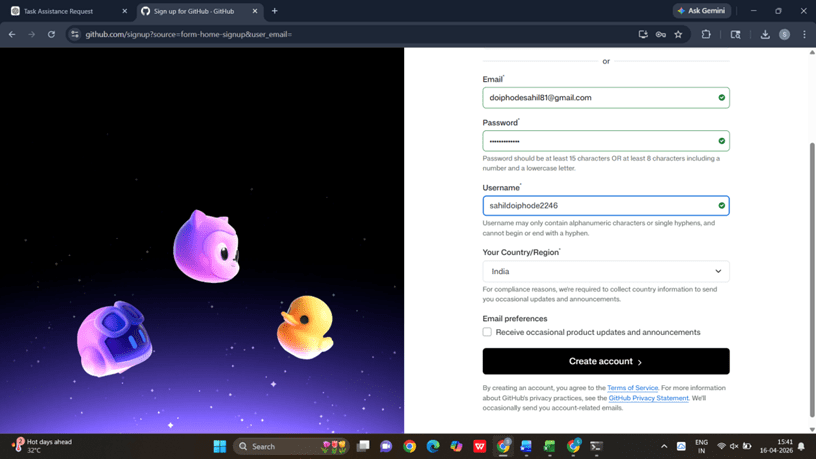
Enter: Email, Username, Password
2
After Installing Git Properly we need Git Hub Repository. Follow below Steps to create Repository On Git Hub.
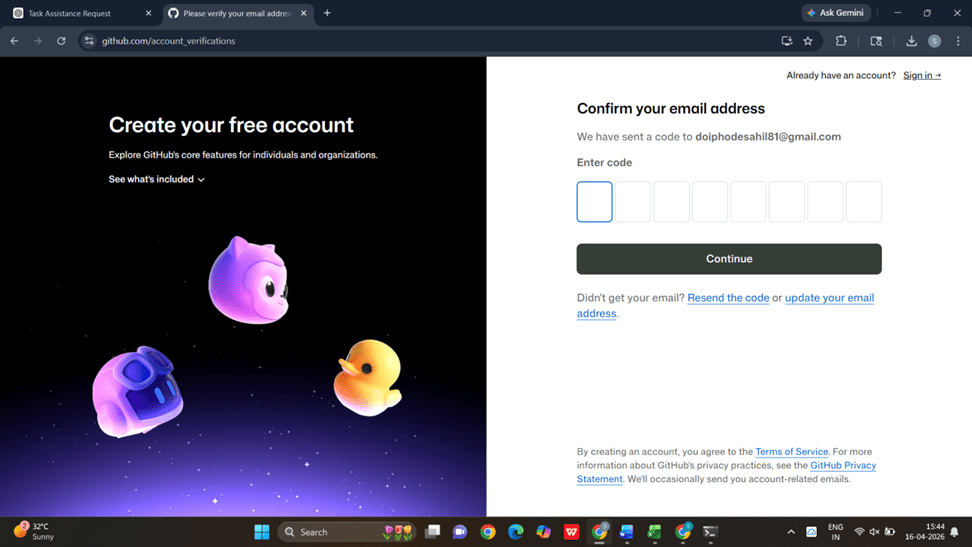
Verify Account by entering the code received on your registered email address.
3
Verify Account by entering the code received on your registered email address.
4
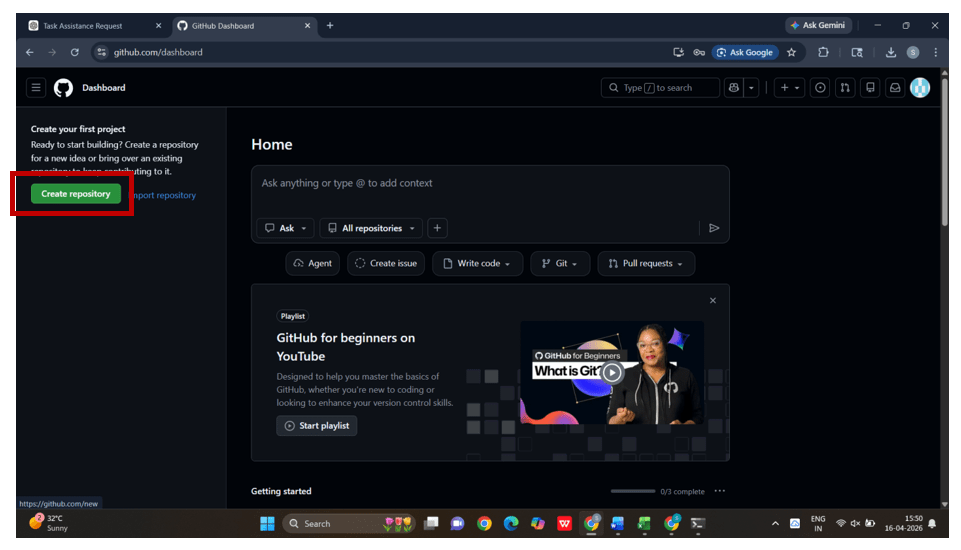
Click on “New” Repository to create new repository
5
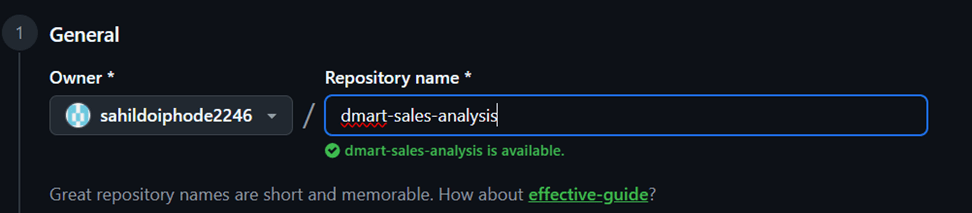
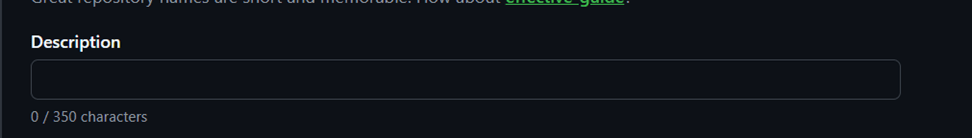
Enter Repository Name: dmart-sales-analysis
6
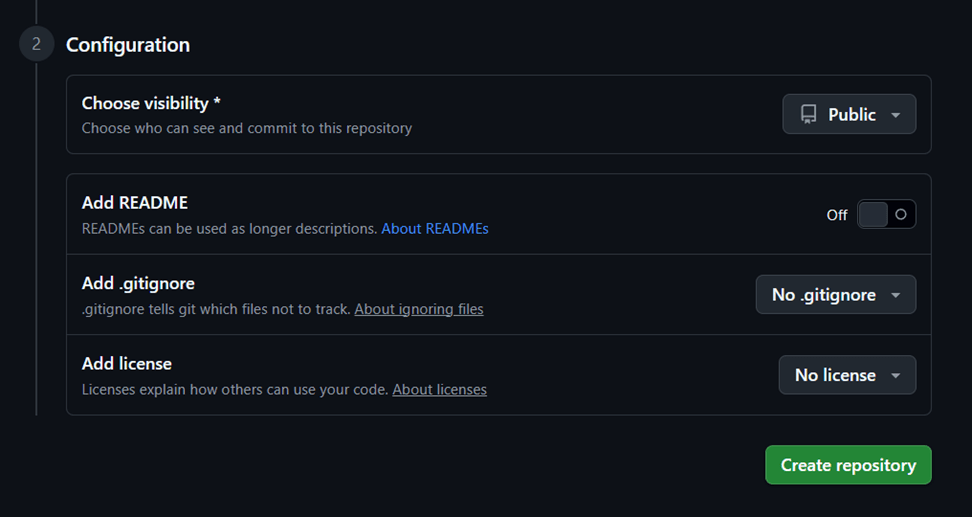
Select Public and Click Create Repository
7
Create a project Folder named as Dmart_sales_analysis on C Drive or any other drive. Once Created, open that folder .
8
Right Click inside that folder to open that folder in terminal as shown below.
9
Initialize Git by executing a command
10
This will create git Repository in your folder as shown below.
Add Files
11
git initgit add .Commit Files
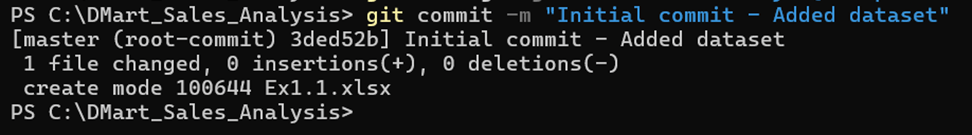
12
- git commit -m "Initial commit - Added dataset"This save your files in GIT.
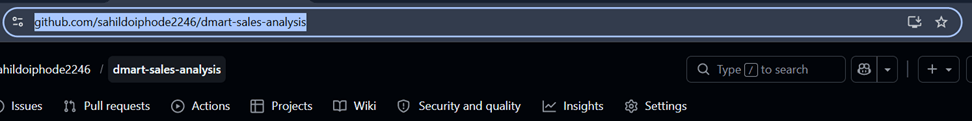
Connect to GitHub Repository
Copy Repository URL- Form Github Copy Your Repository URL
13
Link Local to GitHub
14
git remote add origin <repository-url>Push Files to GitHub
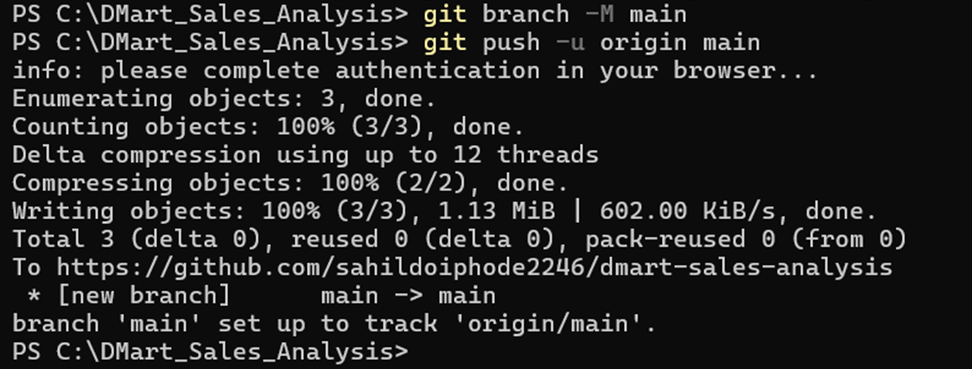
15
git branch -M main
git push -u origin main
Great job!
You have successfully completed your first lab.
In this Lab you have explored the DeMart Business domain,
Explored the dataset provided and Gained knowledge of Git and Github to save the work in Repository.
Checkpoint
Next-Lab Preparation
Topic : Merging and Retrieving Data Using Lookup Functions
1) Merging and Retrieving Data Using Lookup Functions
2) Reports that can be filtered by region or product
By Content ITV


