


Dénes Csala PRO
Assistant Professor| Blogger | Datactivist
Dr Dénes Csala
HSBC May2Innovate
24th May 2023
Assistant Professor in Data Visualisation
University of Bristol
Lancaster University
Senior Consultant in Data Storytelling
Northeastern, 2016
based on the UW CSE442 course and PARC UIR
Portrait of Herbert Simon - Richard Rappaport CC BY 3.0
Sabine Kastner et al., Princeton, 2018
digital garbage on my Facebook feed...digital garbage on my Facebook feed...digital garbage on my Facebook feed...Mitchell Kapor-t freely quoted
based on UW CSE442
Hal Varian - Joi Ito CC BY 2.0
5:35
Arecibo Interstellar Message - Arne Nordmann CC BY-SA 3.0
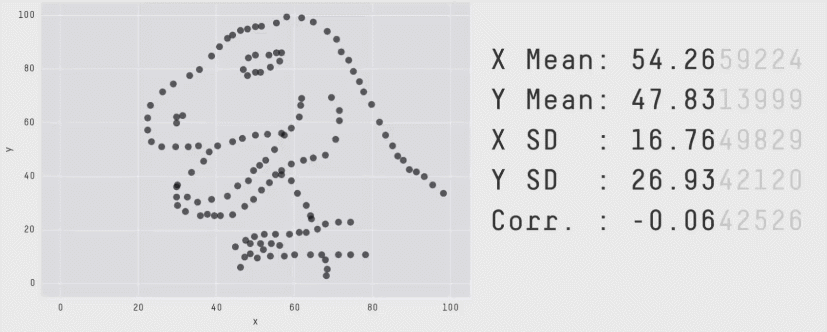
Datasaurus, Alberto Cairo, Autodesk, 2016
Allan Paivio, 1971
based on David McCandless, Information is Beautiful, 2012
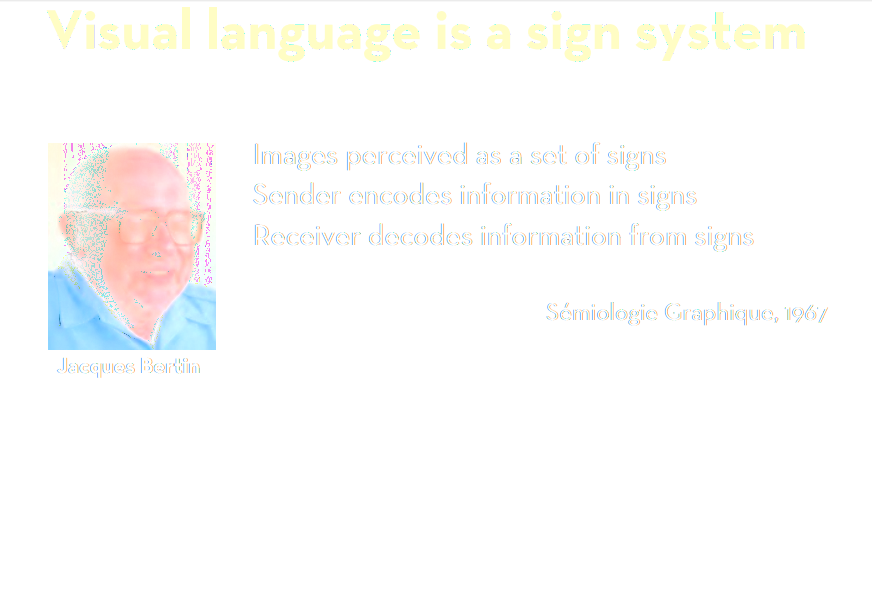
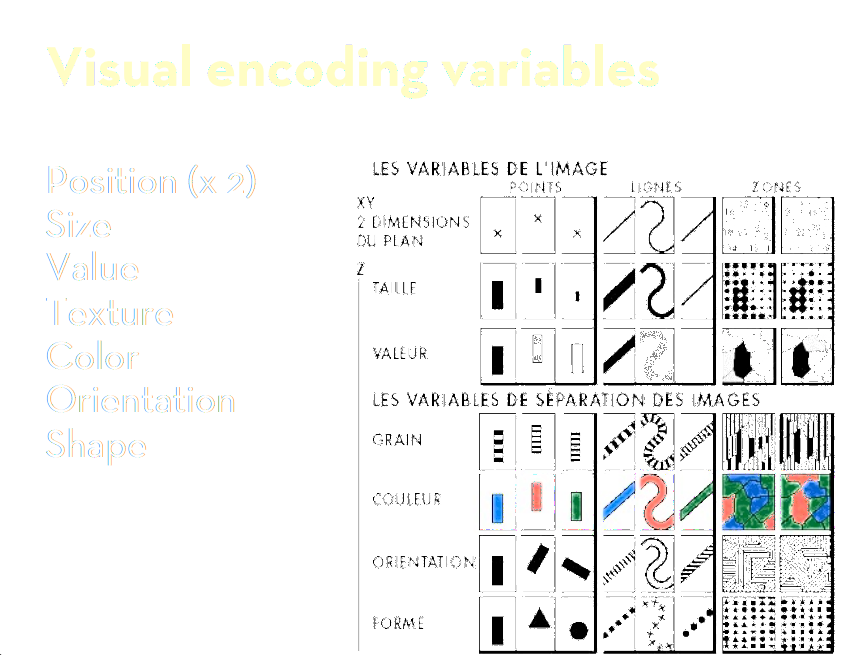
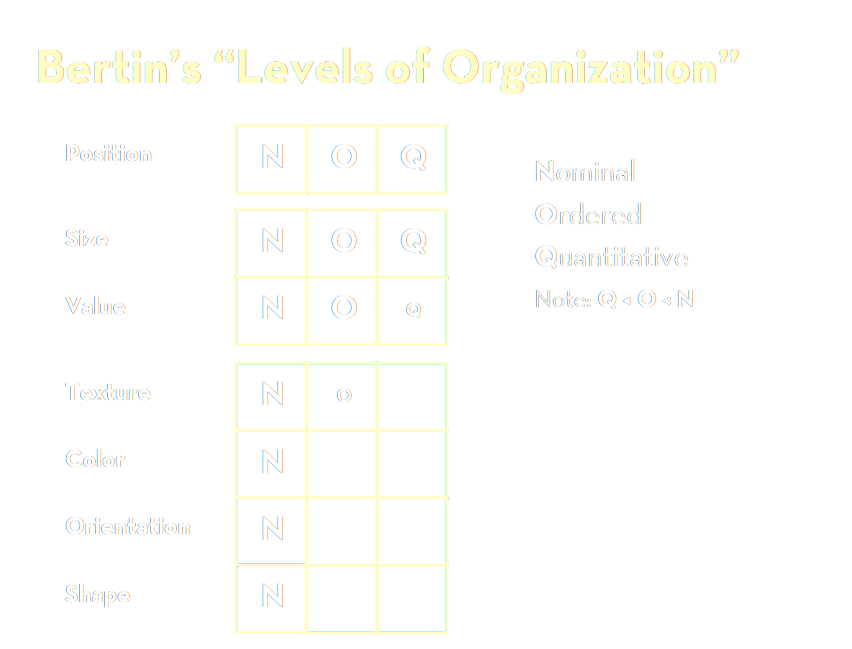
based on Jacques Bertin, Sémiologie Graphique, 1967
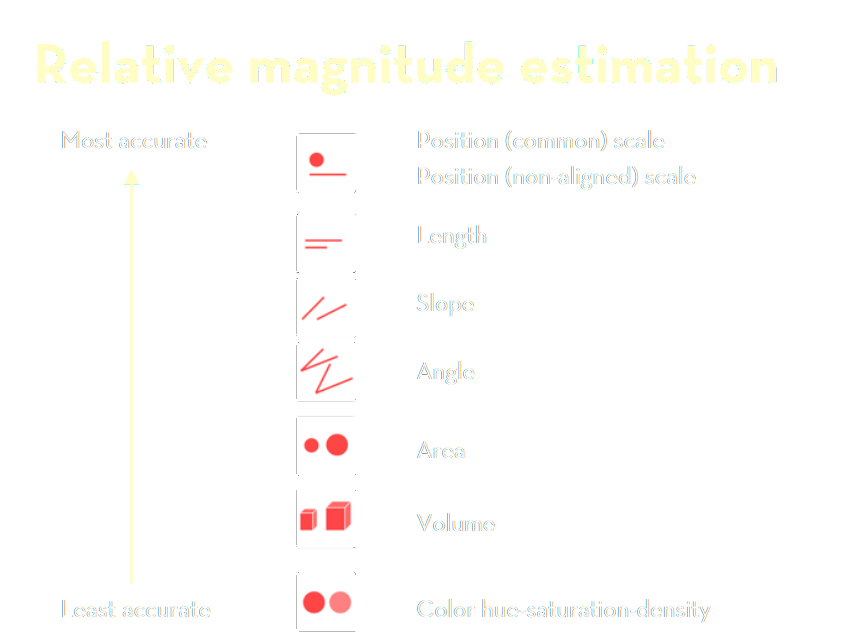
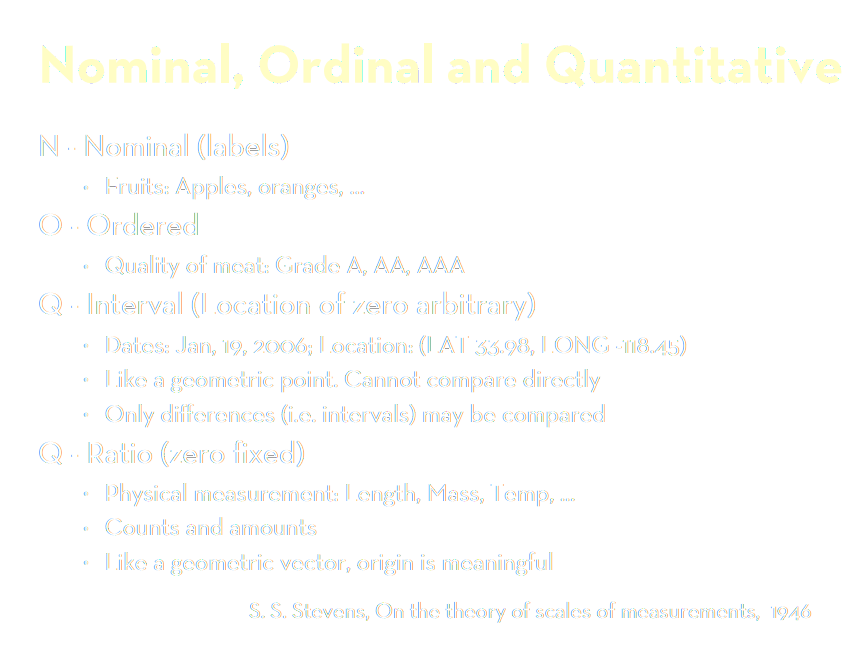
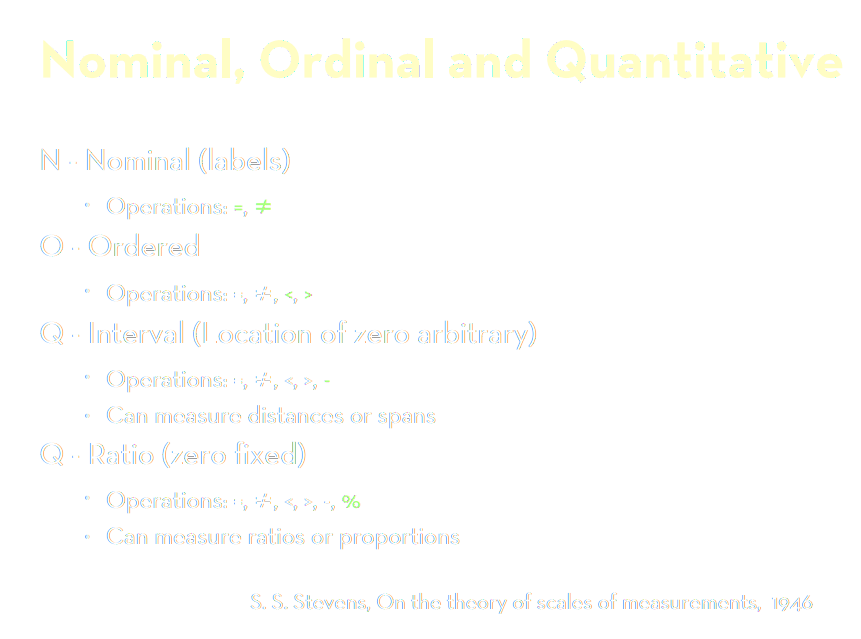
Stanley Smith Stevens, 1957
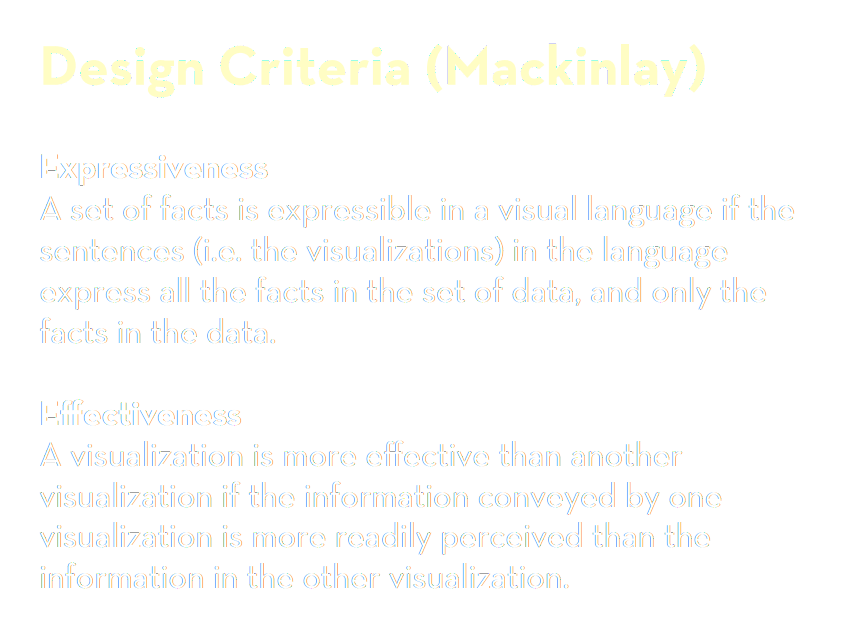
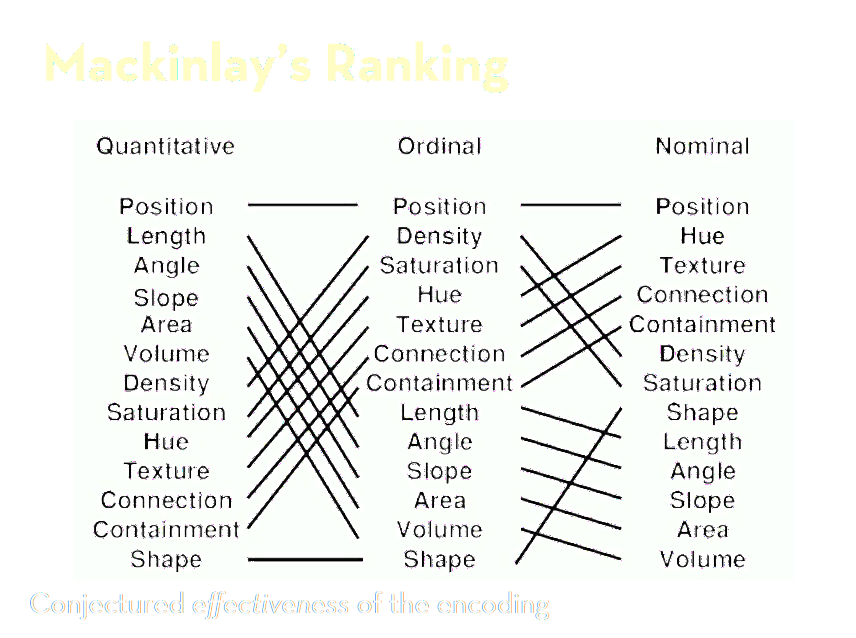
based on Jock MacKinlay, 1986
Focus
Opacity
(Time / Animation)
Nathan Yau, Flowingdata, 2015 alapján
Csala Dénes, Romanian Economic Impact Monitor, 2021
Interactive Data Lab / UW
Arecibo Interstellar Message - Arne Nordmann CC BY-SA 3.0
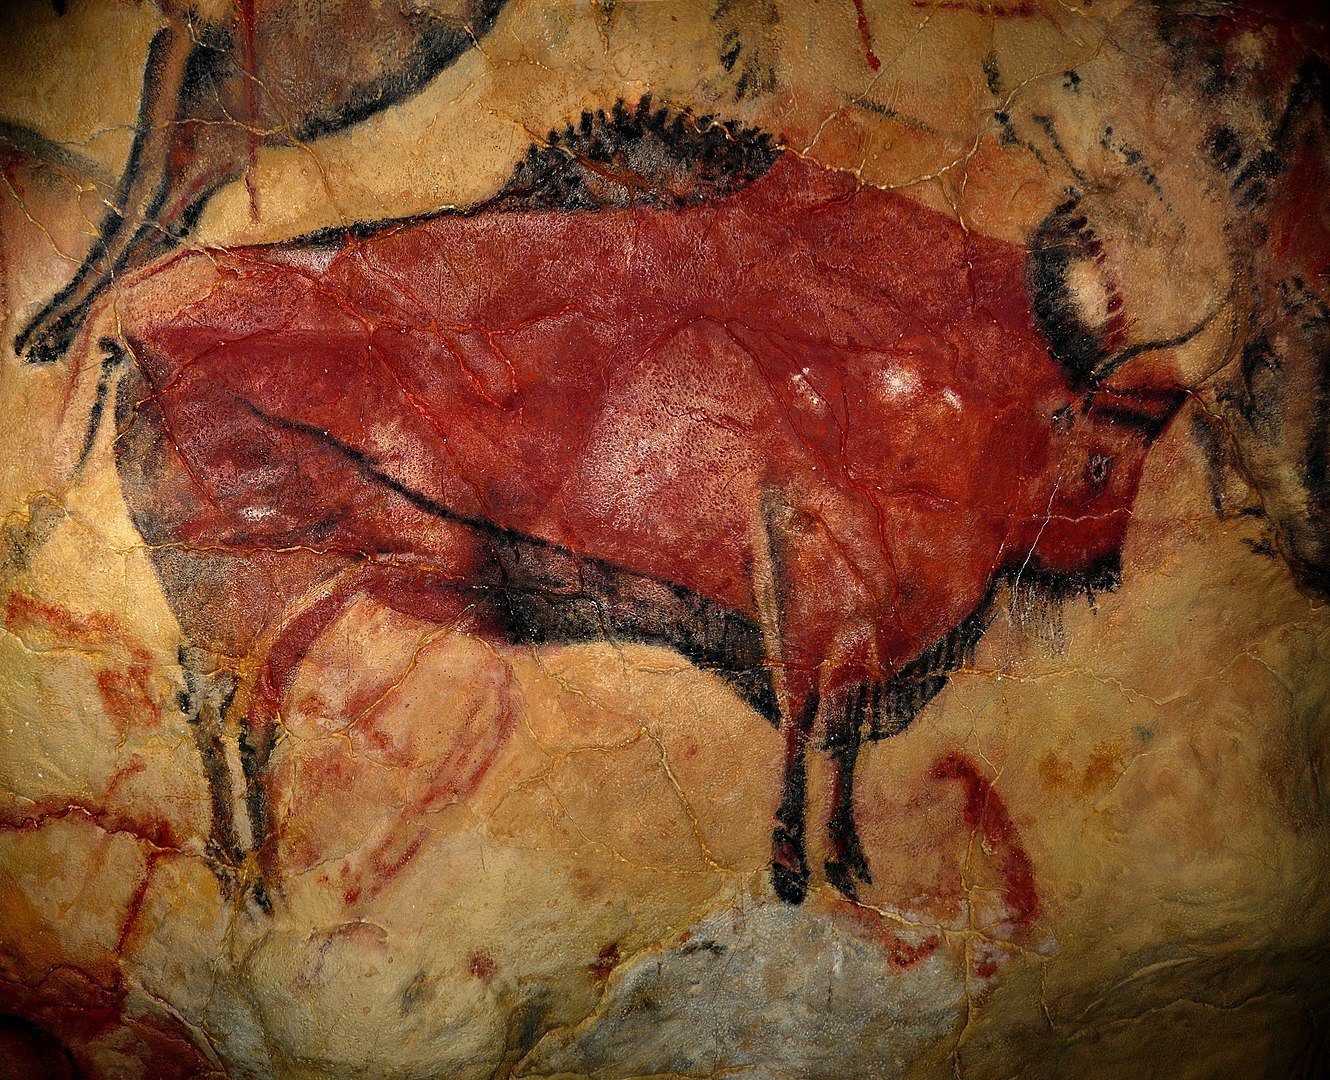
Altamira cave painting, i.e. 36 000
Ted Chiang, Eric Heisserer, Martine Bertrand, Stephen & Christopher Wolfram "Louise", in the alien language designed for movie Arrival, 2016 CC A-NC 4.0
Dr Dénes Csala
HSBC May2Innovate
24th May 2023
Assistant Professor in Data Visualisation
University of Bristol
Lancaster University
Senior Consultant in Data Storytelling
By Dénes Csala
At the Economics Observatory, we curate answers from globally leading economic experts that bridge the gap between academic research, government policy and the general public. We made it our mission to make these answers as accessible and engaging as possible – turning to conferences, a printed magazine and data storytelling tools, next to our main digital publication. In this talk, Dénes will guide you through the Economics Observatory editorial process – from data to article – trying to convince you on the way that the language of data is visualisation.


