CCPi Show & Tell

Felipe Delestro
Senior Research Software Specialist @ QIM Center
Danmarks Tekniske Universitet (DTU)
fima@dtu.dk


QIM Center
Center for Quantification of Imaging Data from MAX IV


supported by

Anders Bjorholm Dahl
Head of the QIM Center

Jon
Sporring
Deputy Head of the QIM Center

Stephen
Hall
Professor at Lund university

Rebecca
Engberg
Center Manager


open-source Python library, that focuses on 3D volumetric data

Getting started is easy:
pip install qim3d


Documentation at platform.qim.dk/qim3d/
Data handling

Volumetric data can be stored in a variety of file formats.
This can make the very first step of importing the data more complex than it should be
load and save
Data handling

Data handling

Volumetric data can be stored in a variety of file formats.
This can make the very first step of importing the data more complex than it should be
load and save
qim3d.io.load and qim3d.io.save can handle the most common data formats:
-
Tiff(including file stacks) HDF5-
TXRM/TXM/XRM NIfTI-
PIL(including file stacks) -
VOL/VGI DICOM
import qim3d

vol = qim3d.io.load("path/to/image.tif", virtual_stack=True)
Data handling

We make a distinction between load/save and import/export when the operation includes transformations to the data.
import and export
Currently we're implementing a 3D import/export following the OME-Zarr standard, which
uses chunked data with a
ulti-scales scheme.

Visualization

Visualization

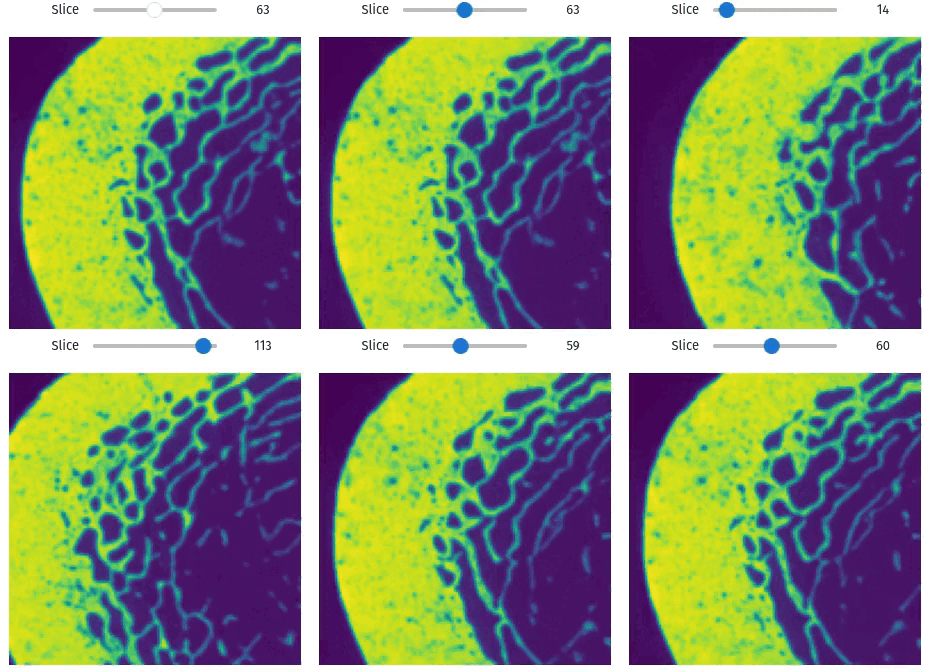
Easily exploring volumetric data may not be so straightforward. The library provides helper functions this task simple and easy, even within Jupyter Notebooks
import qim3d

vol = qim3d.examples.bone_128x128x128
qim3d.viz.slicer(vol)
Visualization

import qim3d

vol = qim3d.examples.shell_225x128x128
qim3d.viz.slices_grid(vol, num_slices=15)
Visualization

import qim3d

# Generate synthetic collection of objects
num_objects = 15
vol, labels = qim3d.generate.volume_collection(num_objects = num_objects)
# Visualize synthetic collection
qim3d.viz.volumetric(vol)Visualization

import qim3d

vol = qim3d.generate.volume(base_shape=(128,128,128),
                          final_shape=(128,128,128),
                          noise_scale=0.03,
                          order=1,
                          gamma=1,
                          max_value=255,
                          threshold=0.5,
                          dtype='uint8'
                          )

mesh = qim3d.mesh.from_volume(vol, step_size=3)
qim3d.viz.mesh(mesh.vertices, mesh.faces)Visualization

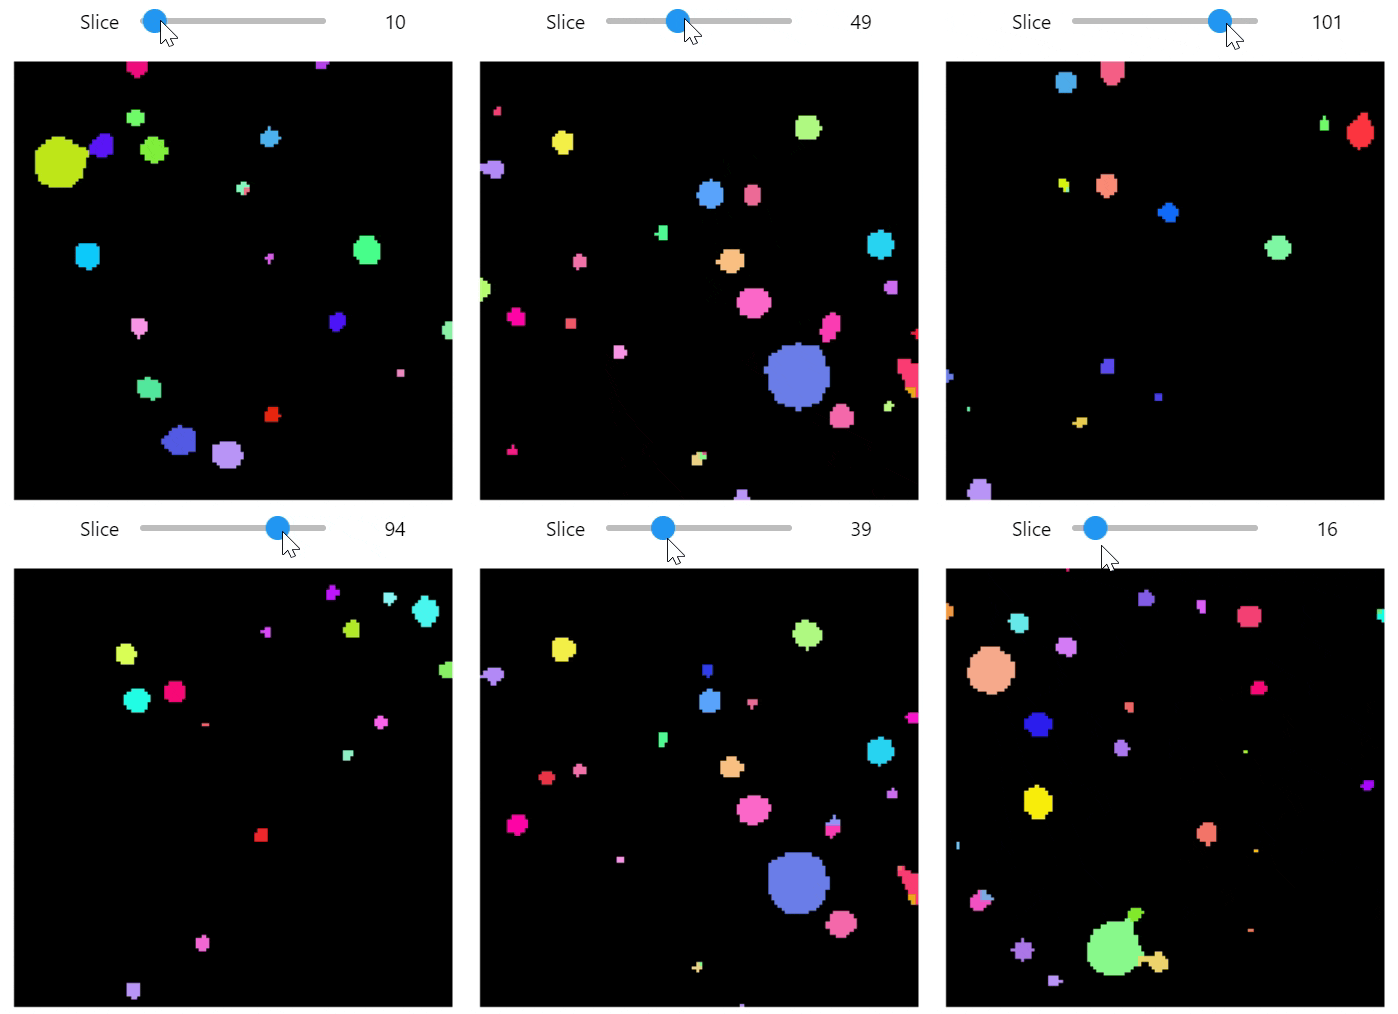
import qim3d

vol = qim3d.examples.cement_128x128x128
binary = qim3d.filters.gaussian(vol, sigma = 2) < 60
labeled_volume, num_labels = qim3d.segmentation.watershed(binary)

color_map = qim3d.viz.colormaps.segmentation(num_labels, style = 'bright')
qim3d.viz.slicer(labeled_volume, slice_axis = 1, color_map=color_map)
qim3d.viz.colormaps.segmentation creates an colormap designes specifically for segmentation tasks


The parameter min_dist allows us to control how different neighbour colors are


+
=
❤️
CCPi Show & Tell
By Felipe Delestro
CCPi Show & Tell
- 342


