


Dhrumil Mehta
Database Journalist, Politics @ FiveThirtyEight
✔️ There are different kinds of numbers that must be interpreted and presented differently
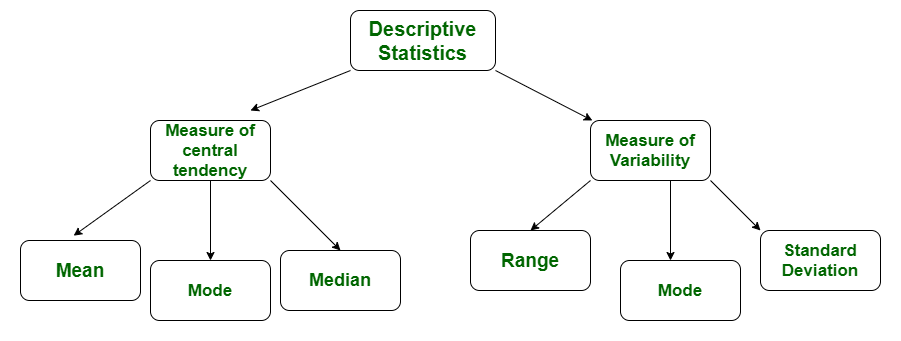
Counts and Measurements
Summary Statistics
Probabilities
Inferential Statistics
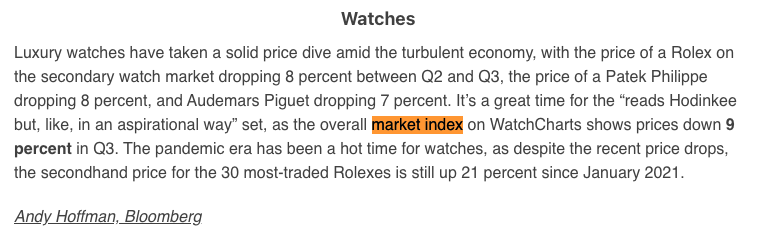
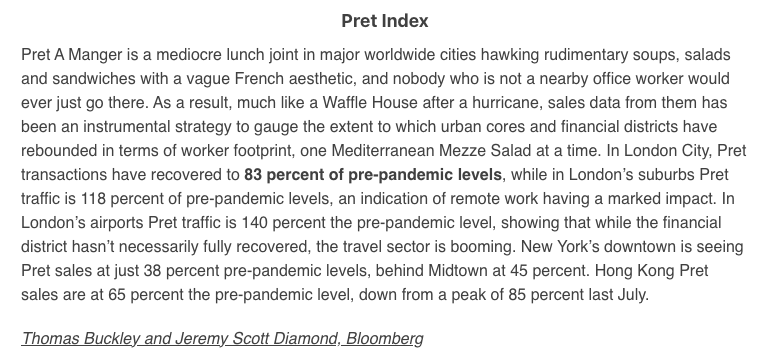
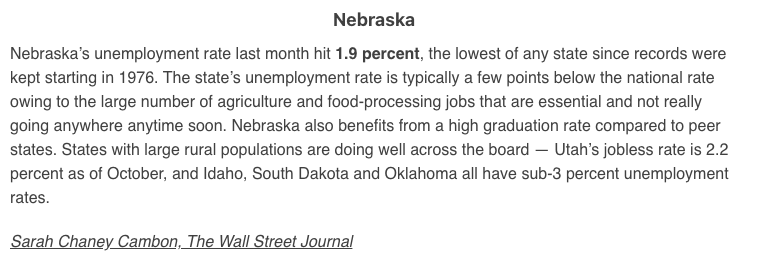
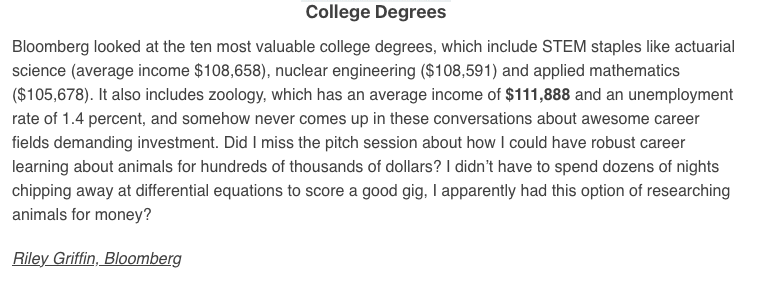
Indexes
Scaled Numbers
a very complex kind of probabilistic number
I'm sure these aren't the only kinds of numbers...
...but they're all very different from one another
more methodological choices to vet
p.s. - check out this neat thing I built using LangChain 🦜🔗
https://github.com/dmil/numlock-nlp
and associated viz
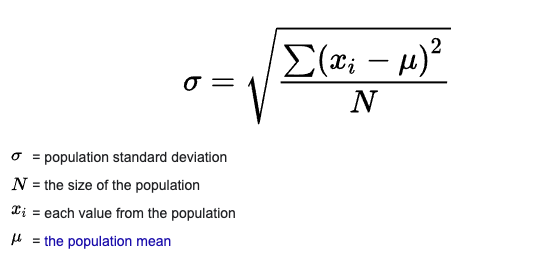
👻 Scary Math Symbol?
👍 Seems fine!
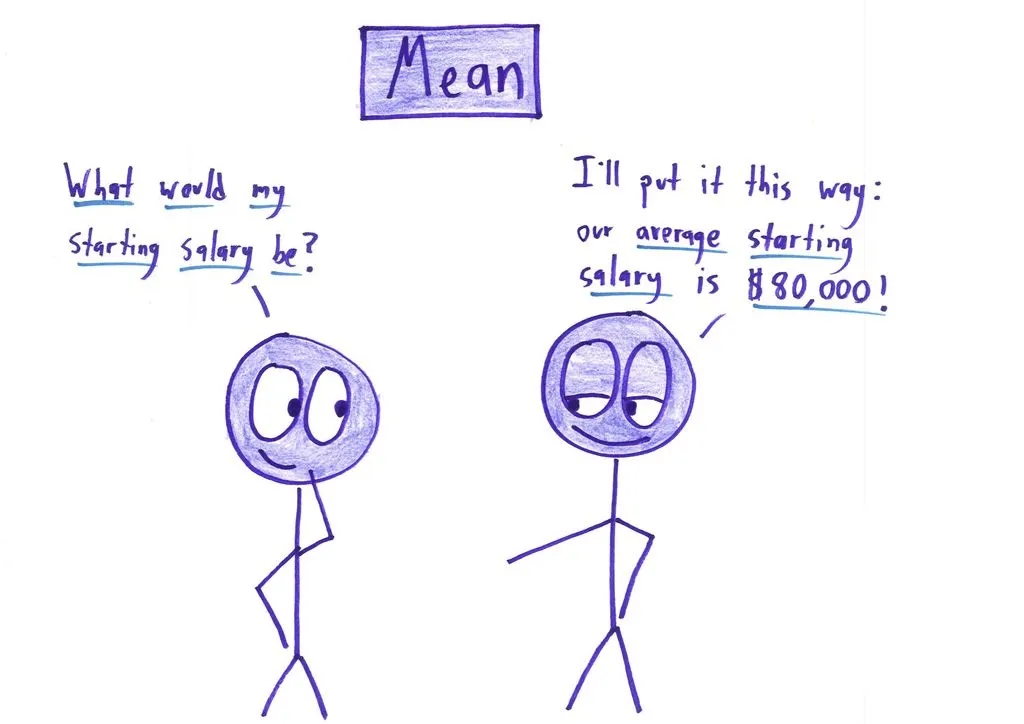
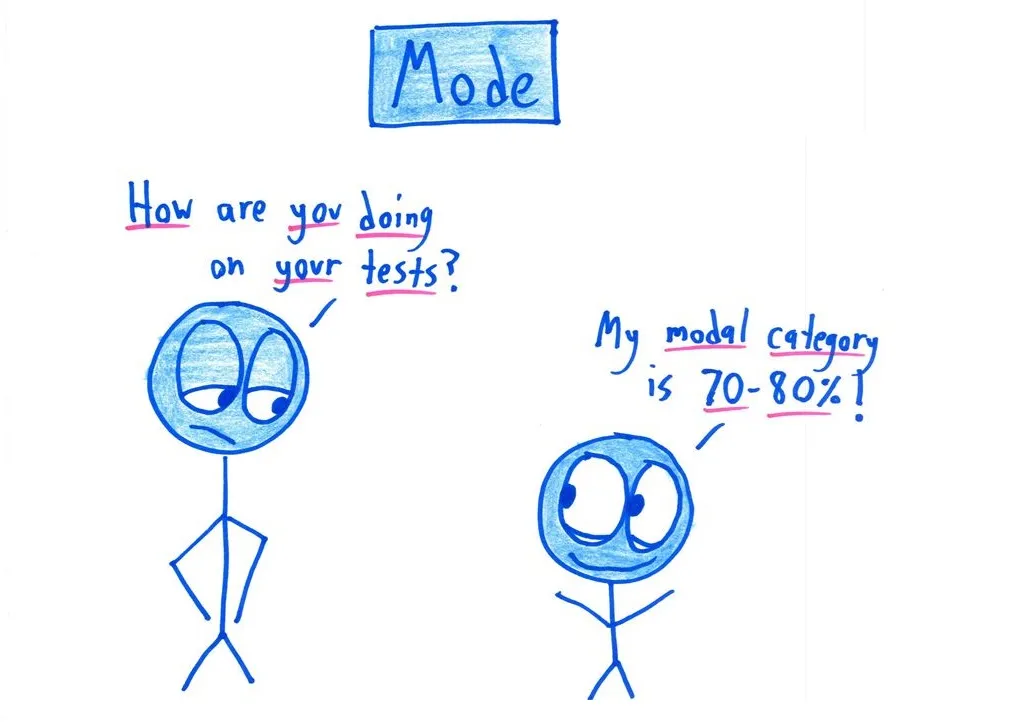
Ben Orlin — Math with bad drawings
Ben Orlin — Math with bad drawings
Text
Examples
Ben Orlin — Math with bad drawings
Ben Orlin — Math with bad drawings
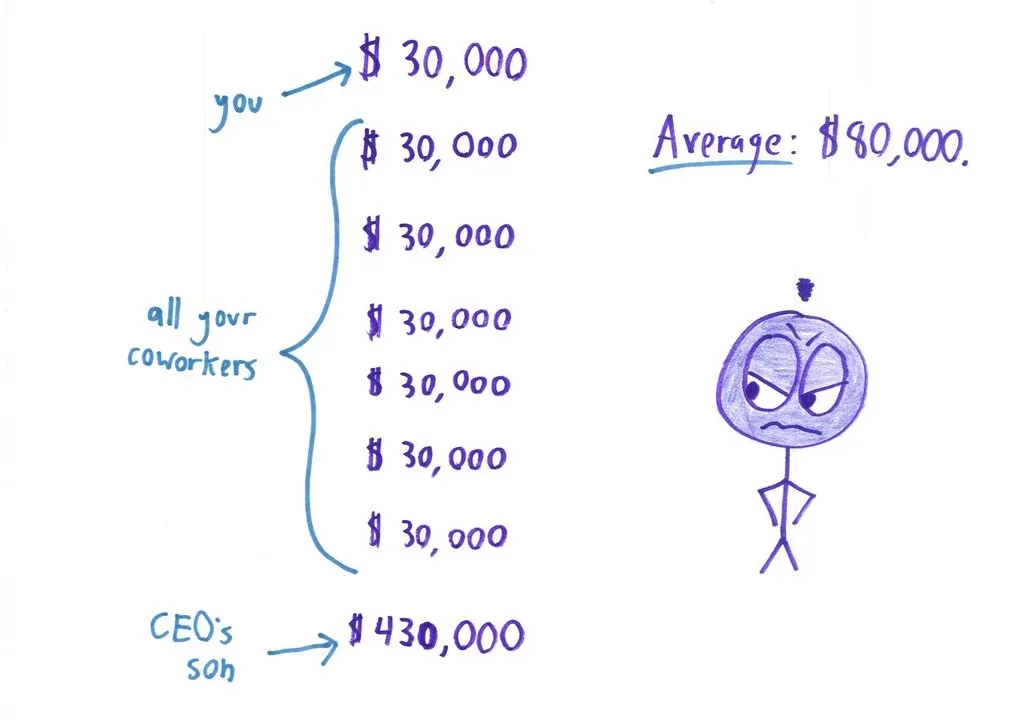
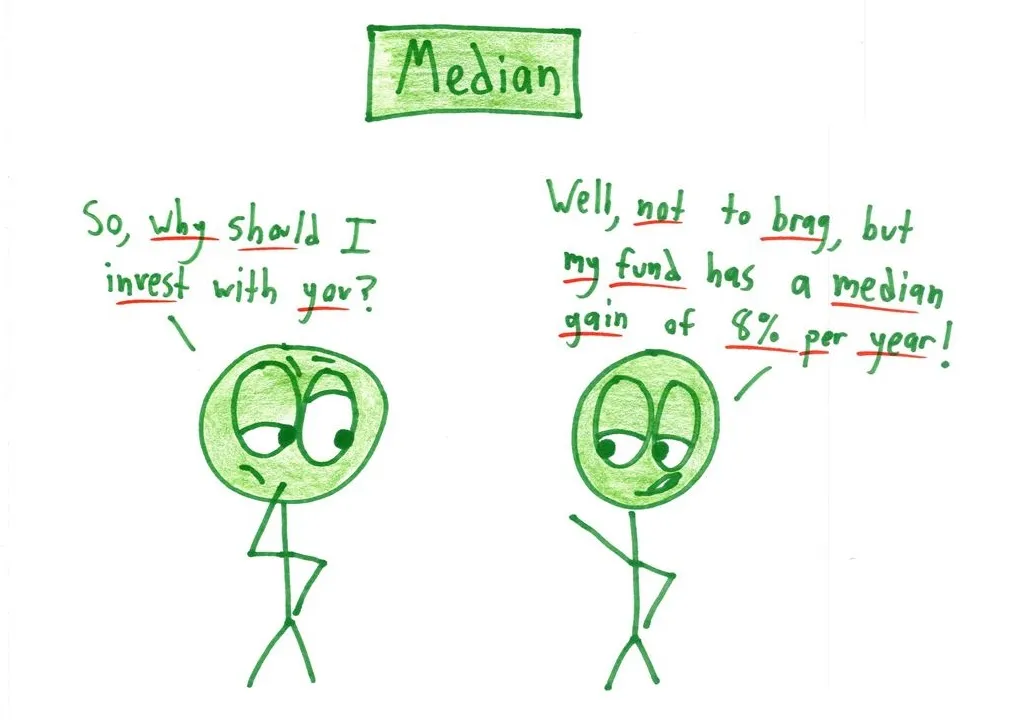
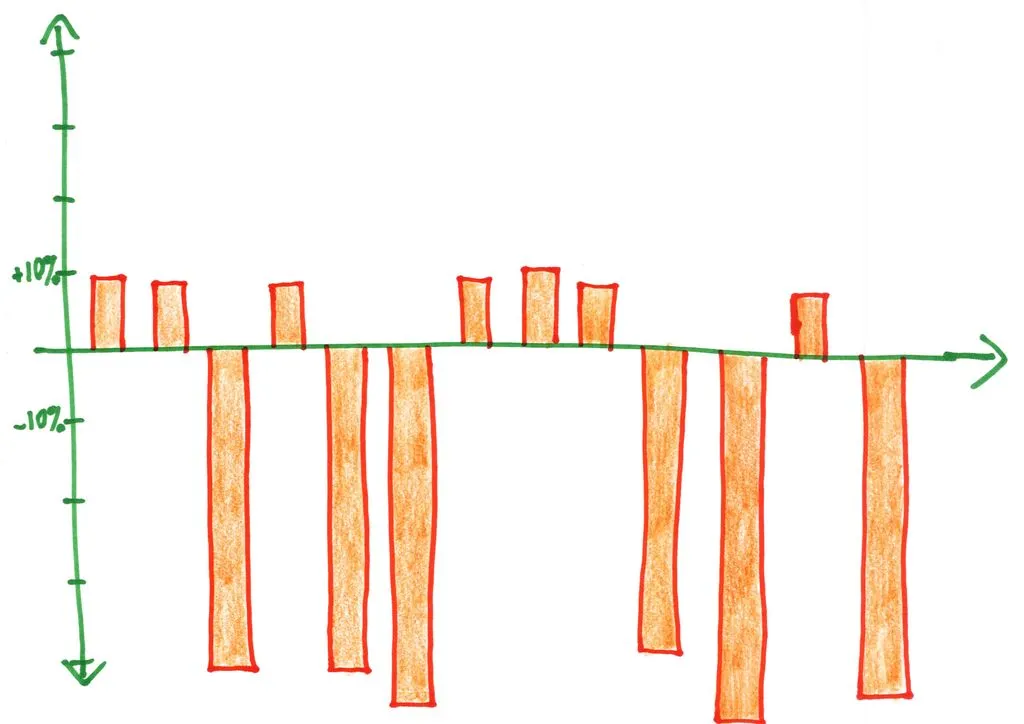
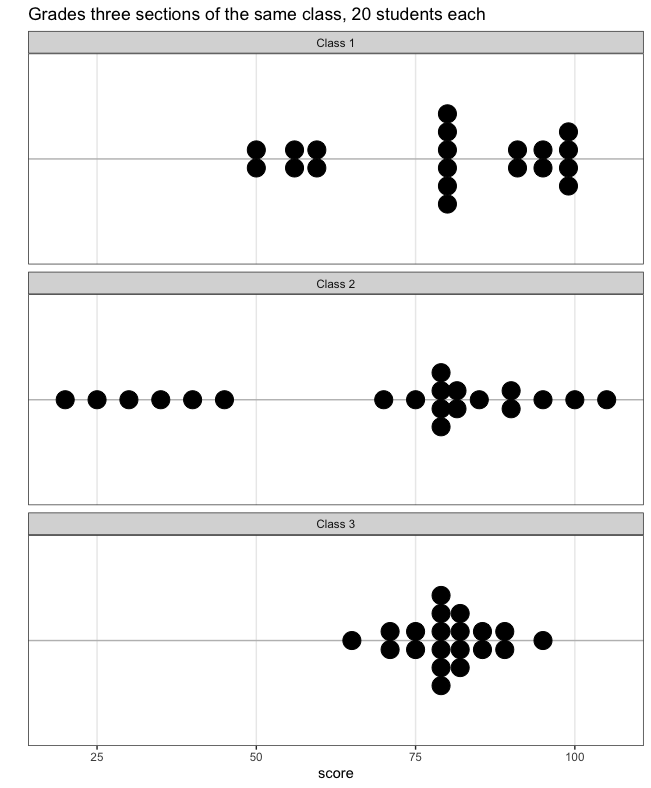
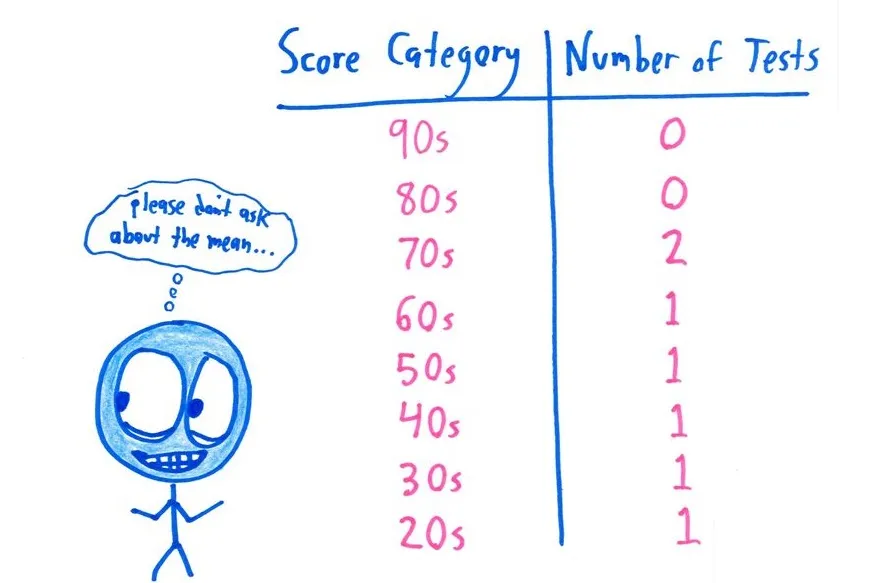
Median Grade: 80%
Median Grade: 80%
Median Grade: 80%
Examples
Ben Orlin — Math with bad drawings
Ben Orlin — Math with bad drawings
Ben Orlin — Math with bad drawings
Ben Orlin — Math with bad drawings
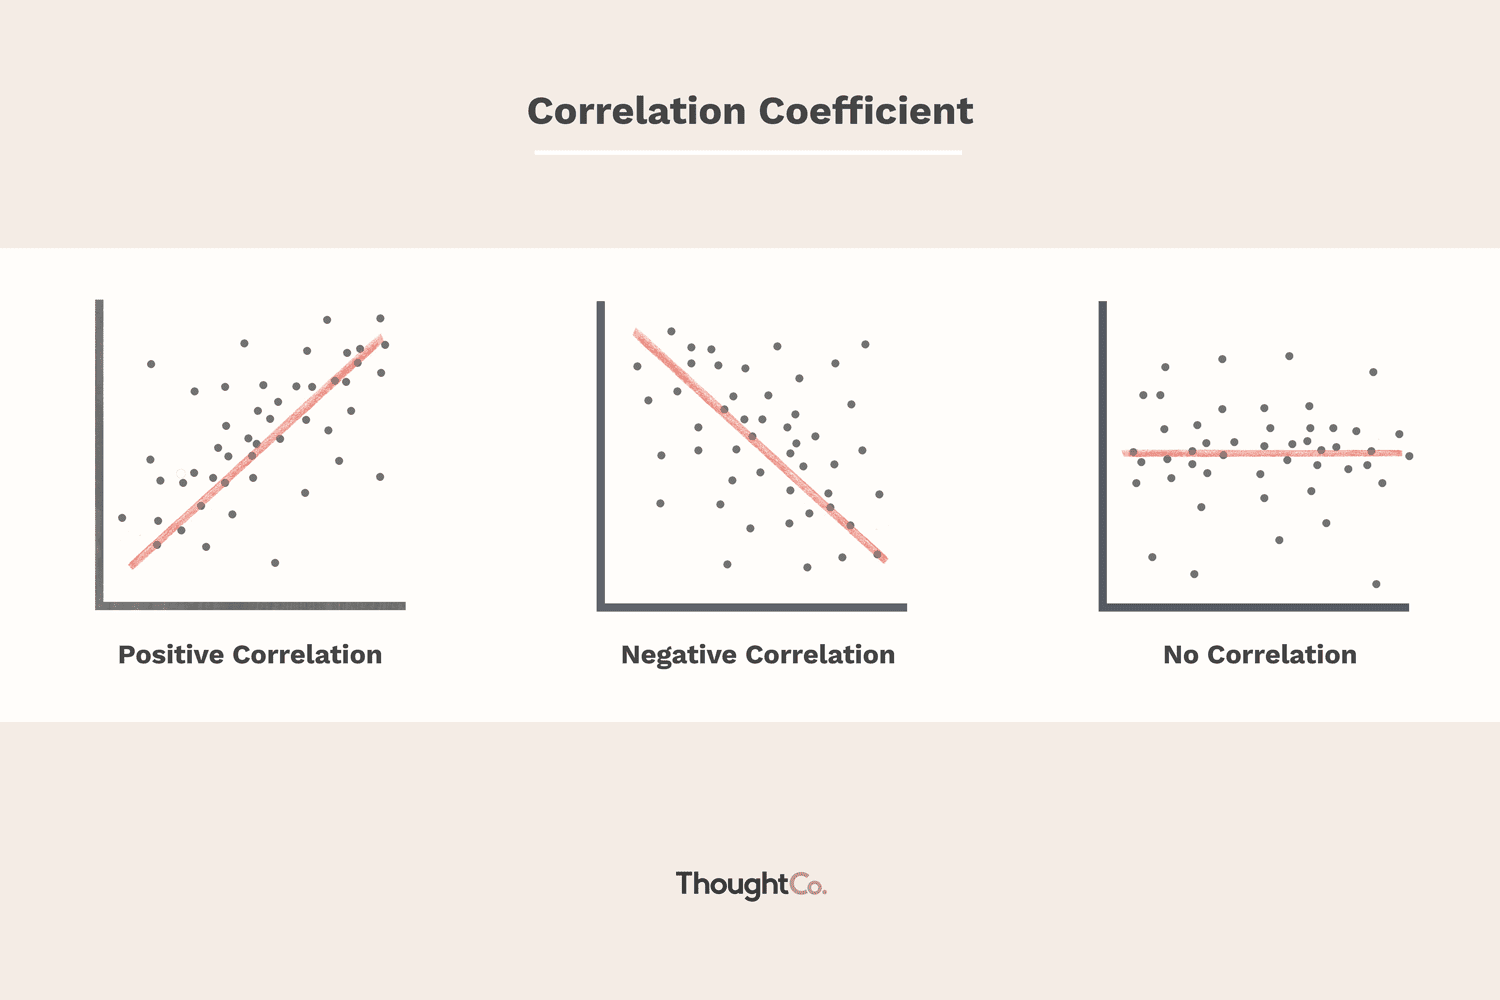
https://www.investopedia.com/terms/n/negative-correlation.asp
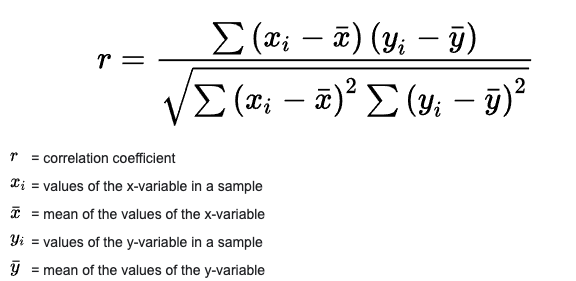
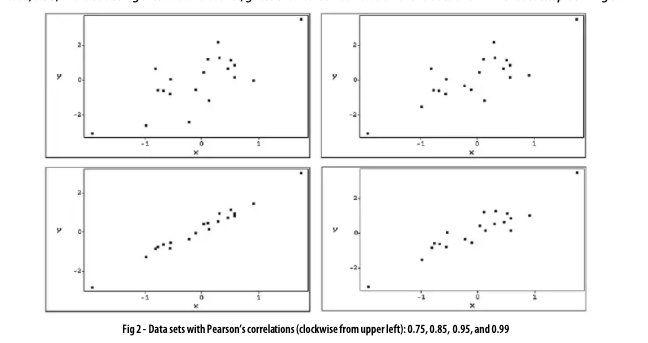
Pearson's Correlation Coefficient
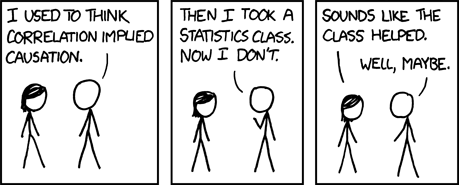
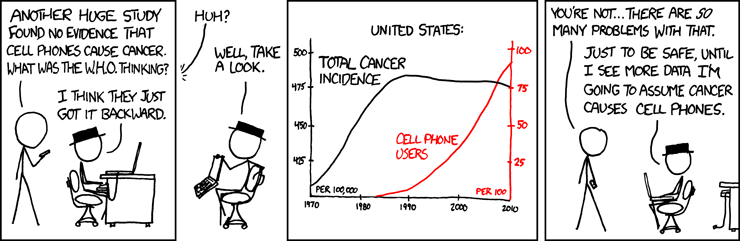
Correlation doesn't imply causation, but it does waggle its eyebrows suggestively and gesture furtively while mouthing 'look over there'.
Ben Orlin — Math with bad drawings
Ben Orlin — Math with bad drawings
Examples
Examples
Ben Orlin — Math with bad drawings
Ben Orlin — Math with bad drawings
Learning Objectives
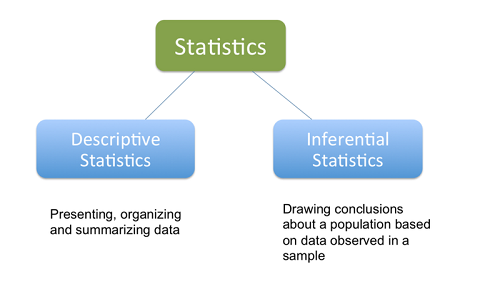
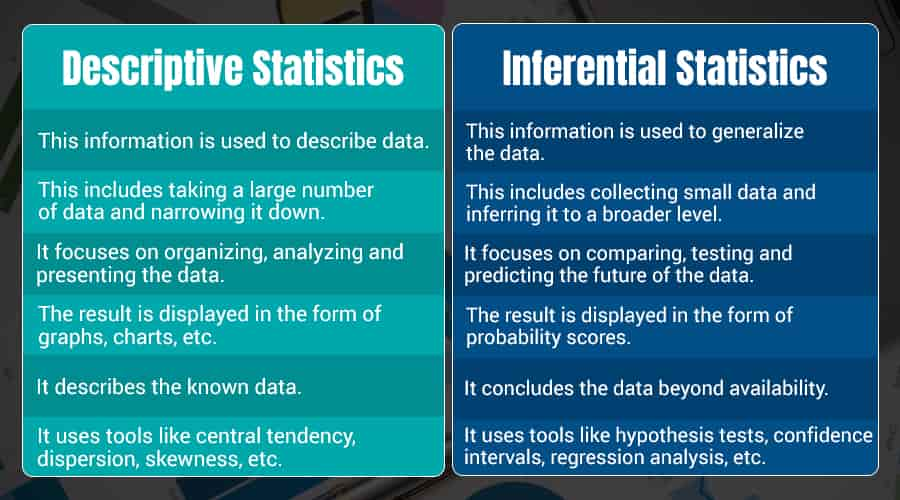
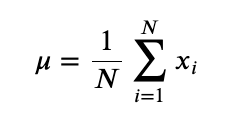
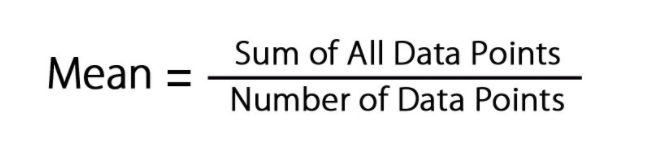
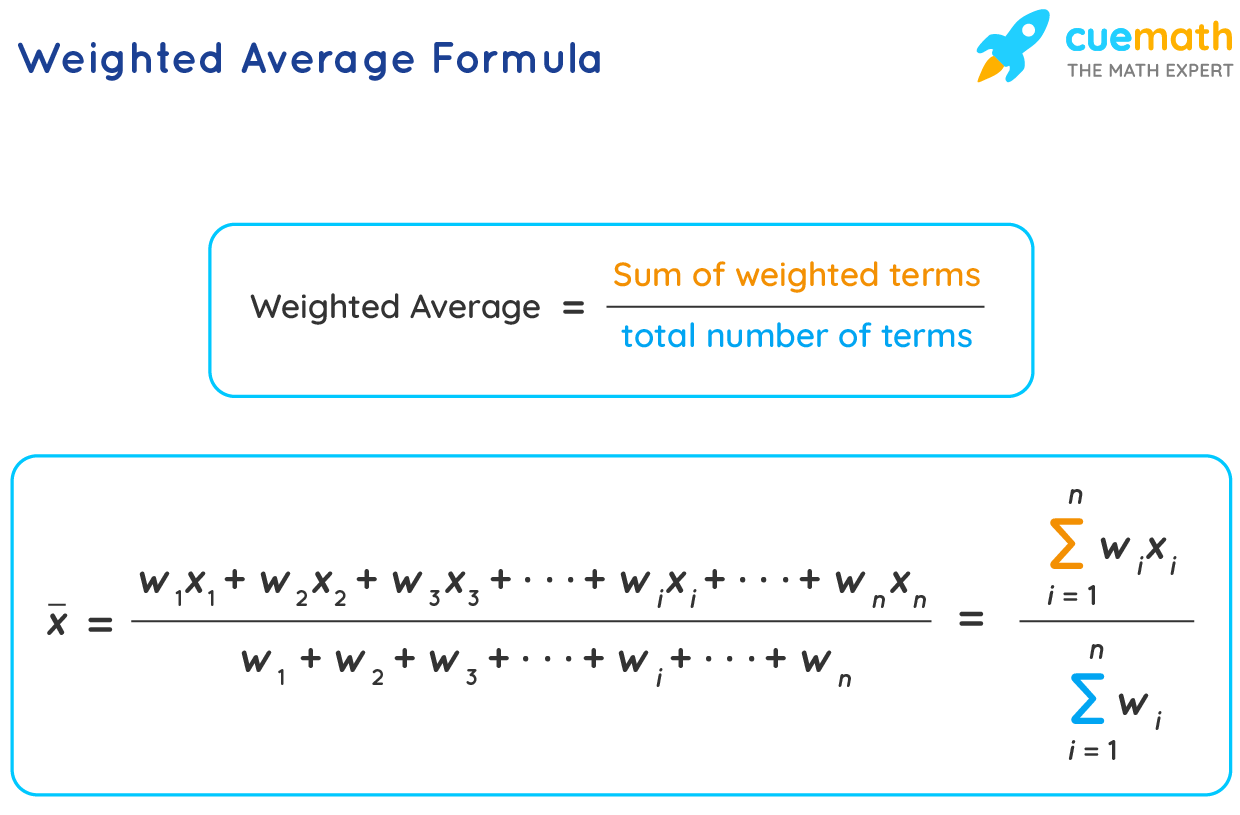
✔️ Understanding summary statistics
✔️ Practice formulas and pivot tables in spreadsheets
✔️ Learn to make charts in spreadsheets
https://docs.google.com/spreadsheets/d/1ObVYCOeTgGK_n9rhVFG05I-VIjzriO-F6mCDIpdd_lo/edit#gid=0
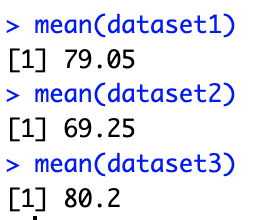
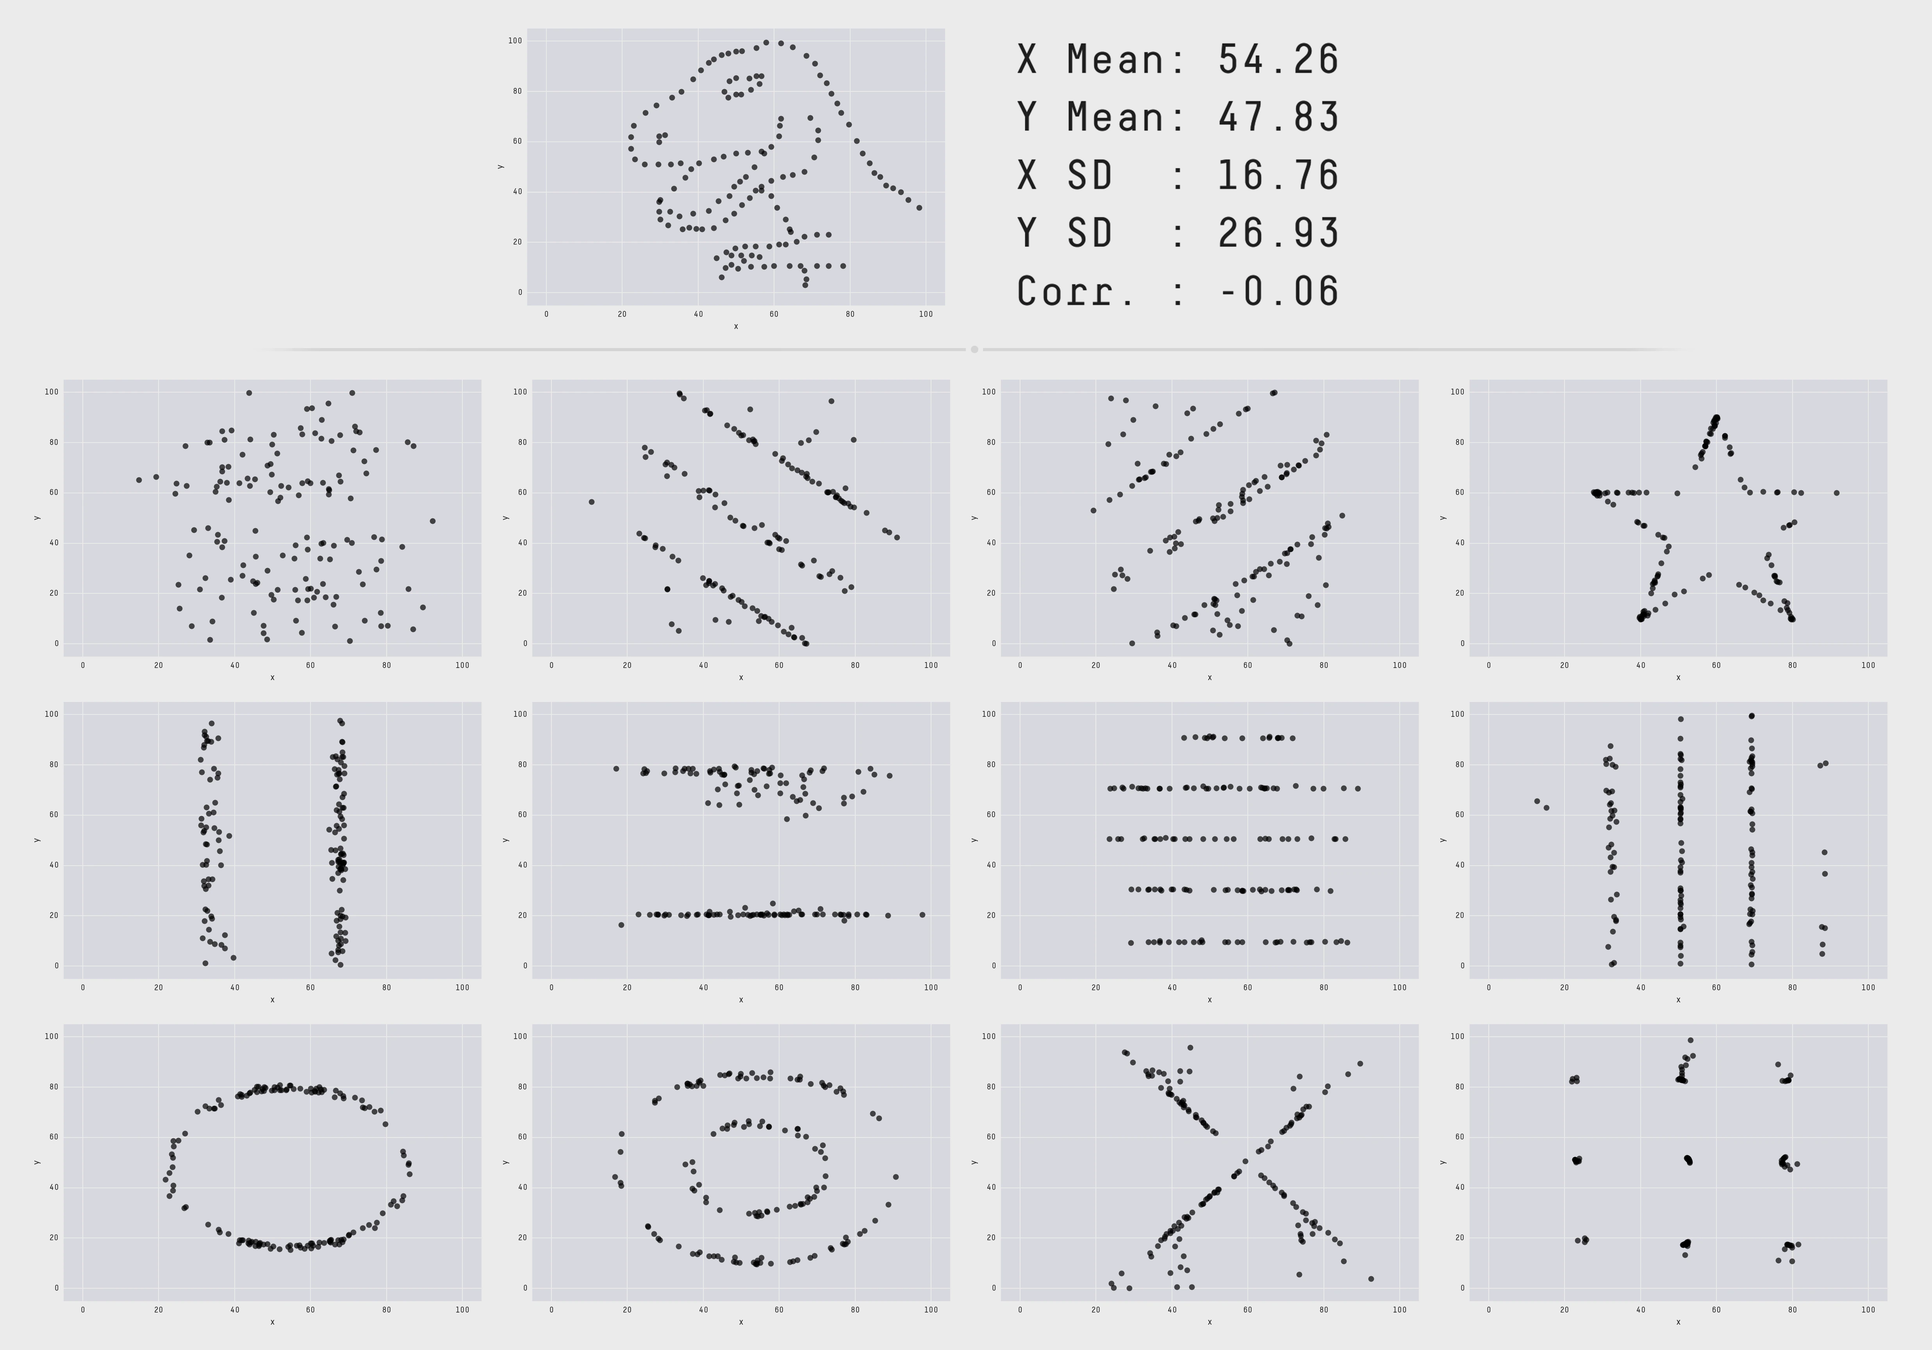
Describe 4 mystery datasets with summary statistics...what can you tell me about these mystery data?
Calculate:
- Mean
- Median
- Mode
- Correlation
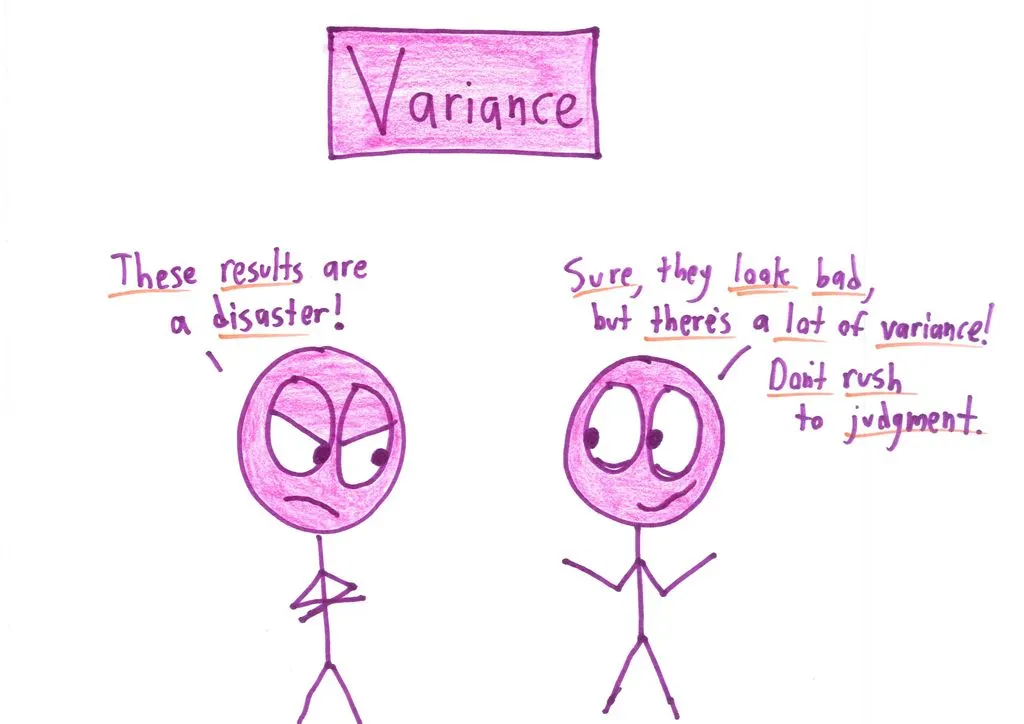
- Variance
Do it twice
- Use formulas on WIDE tab
- Use pivot tables on LONG tab
Done? Help out a classmate...or poke around the BONUS tab. How might you describe that data?
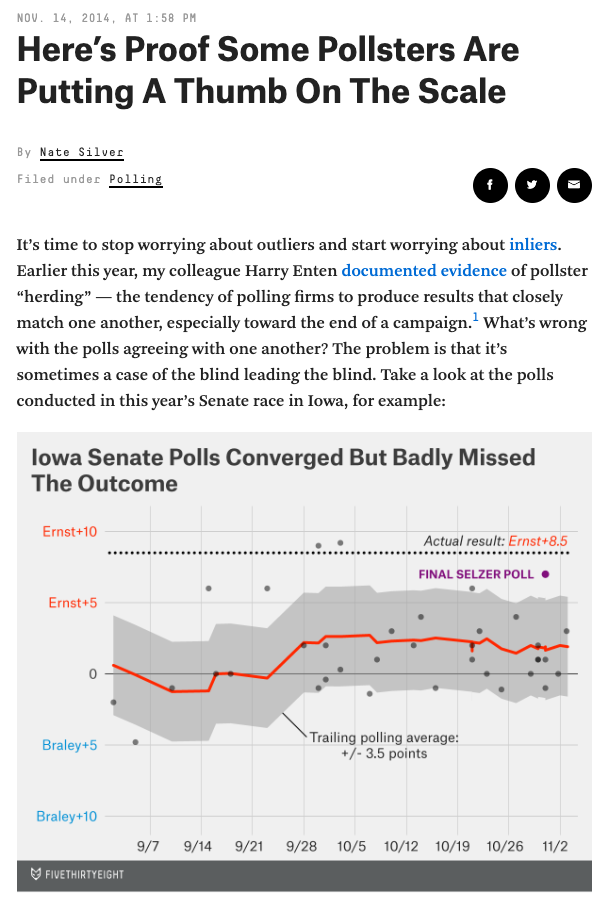
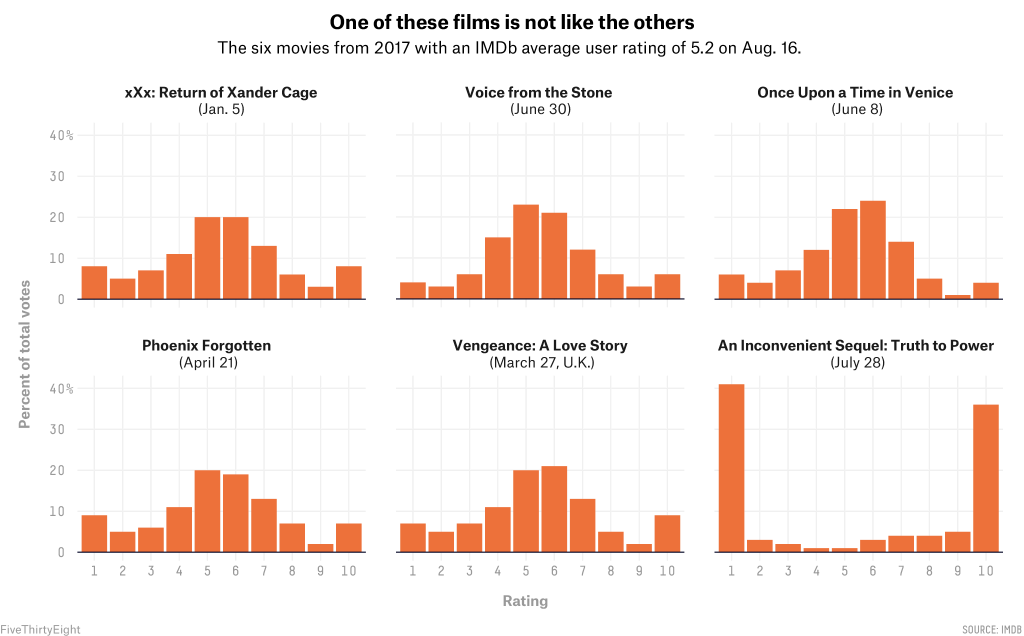
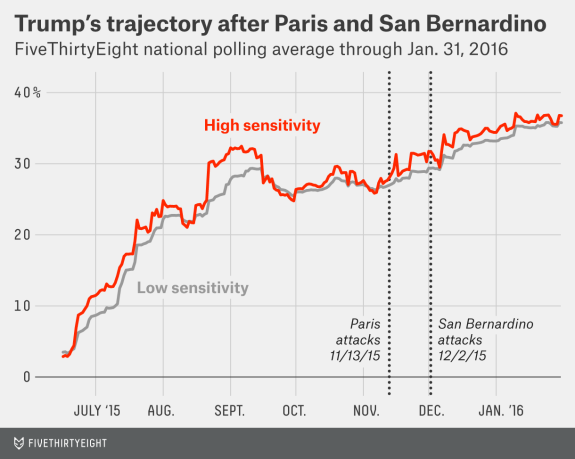
https://fivethirtyeight.com/features/al-gores-new-movie-exposes-the-big-flaw-in-online-movie-ratings/
Exploratory Data Visualization
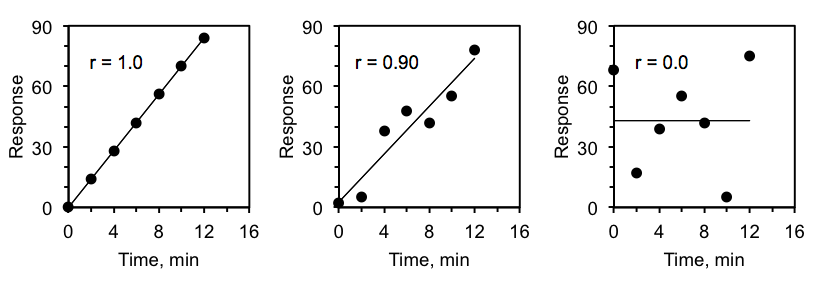
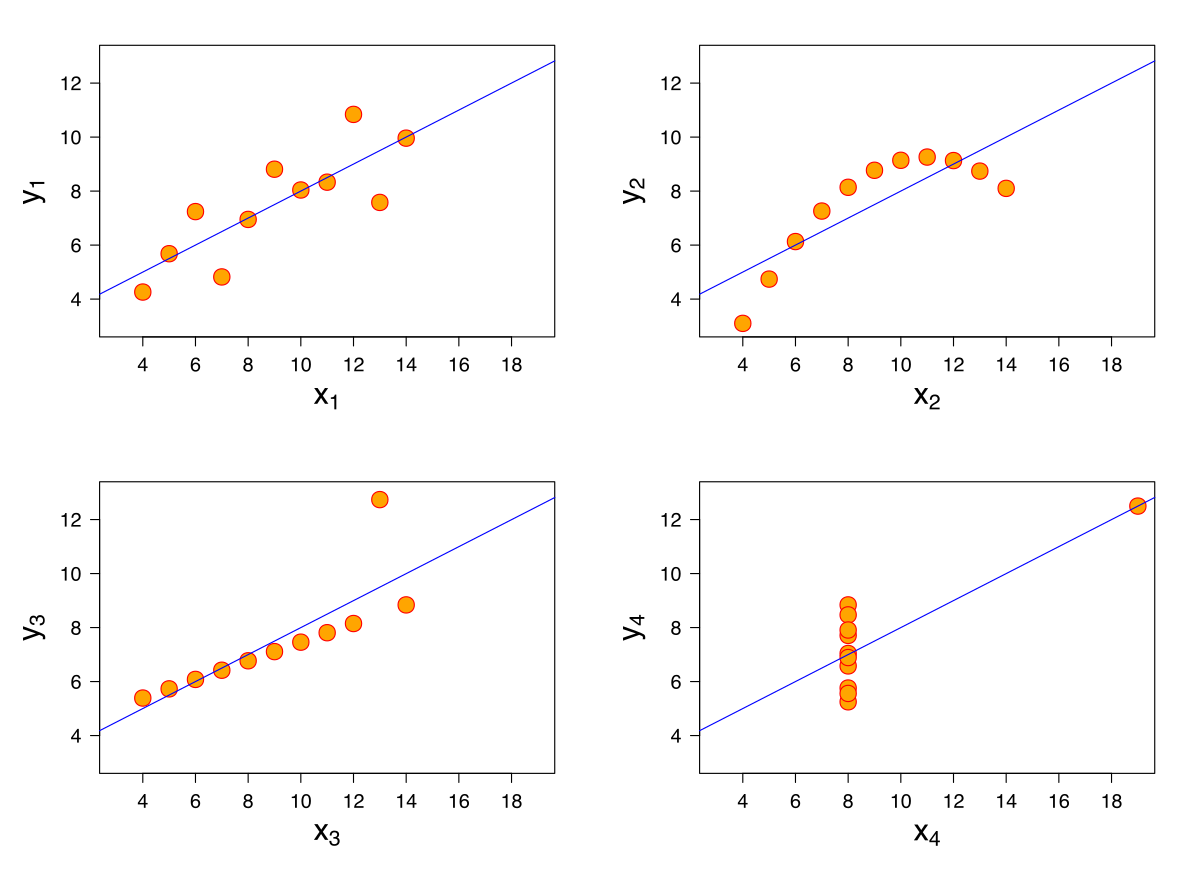
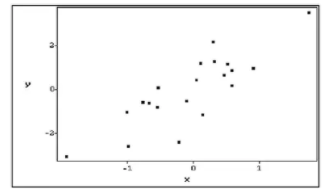
Pearson correlation is ????
Pearson correlation is 0.9909
because there are 40 duplicate data pts in top right and bottom left corner
1977
Read and annotate using Hypothes.is
https://dmil.notion.site/A-Hypothesis-Is-a-Liability-5f8ccf30771042fabbf76d842ef99a8c?pvs=4
Your chance to explore and do "night science", no pressure to form a hypothesis, just #inspo.
https://dmil.notion.site/Exploring-NYC-Data-3bed8f11bbf1455e811f940b573e05e7?pvs=4
By Dhrumil Mehta
intro stats


