Reading Balance Output
What Does It Mean?????
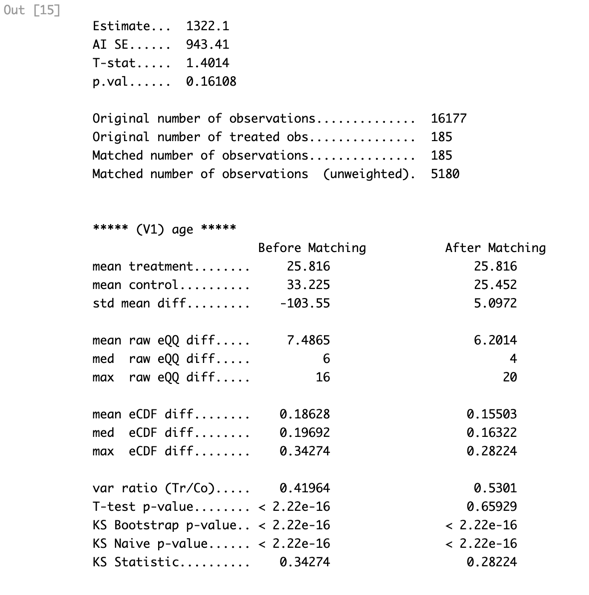
These numbers all refer to the treatment effect.
The estimate of the TE based on the matched sample.
The Abadie-Imbens standard error (of the causal effect estimate)
The T statistic and p-value of the estimate.
This tells us about the original data and the matched data.
compare
The standardized mean difference (SMD) is the difference in means of each covariate between treatment groups standardized so that it is on the same scale for all covariates. SMDs close to zero indicate good balance.
Empirical quantile-quantile (eQQ) plots can be used to see exactly how the covariate distributions differ from each other. Smaller numbers, more balance.
EeCDF means empirical cumulative density function difference. It is another visual diagnostic used to see exactly how the covariate distributions differ from each other. Smaller numbers, more balance.
The variance ratio is the ratio of the variance of a covariate in one group to that in the other. Variance ratios close to 1 indicate good balance because they imply the variances of the samples are similar (Austin 2009).
By definition, the KS statistic takes values in [0,1], and the lower the value, the closer the two distributions.
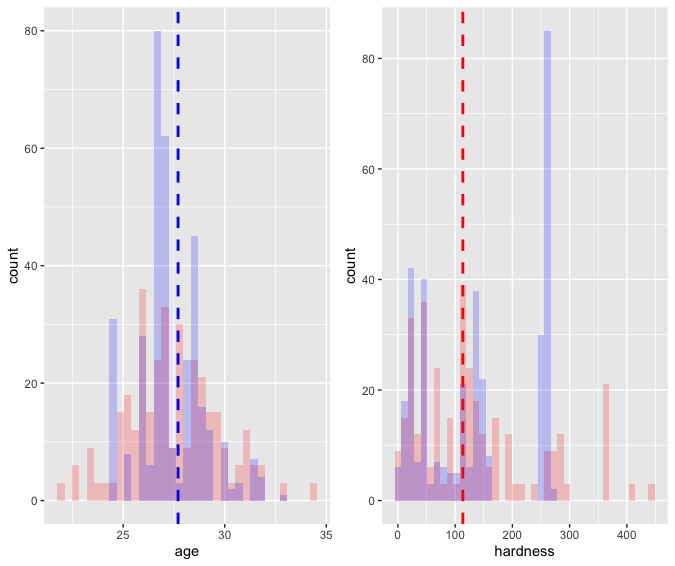
What do you think these histograms show?
Hint: red=treatment, blue=control
Histograms can show the similarity of the distribution of a given covariate in the treatment and control groups.
ICS212 Statistical Matching - Balance Assessment
By Dan Ryan


