ECF5560
Winter term, 2023
Session 3: Policy effects
Cost benefit analysis & economic decision making
Dr. Emilia Tjernstrom
1. Price ceiling
2. Price floor
3. Taxes
0. The sheets
-
PriceCeiling PriceFloor
Taxes
Policy analysis worksheet | the sheets
- experiment with demand & supply curves
- analyse the impact that price ceilings
& price floors have on markets
- examine how price elasticities influence
the incidence of taxes
Policy analysis worksheet | the sheets
As we know, governments can intervene in markets in many ways
Here, we focus on two common policy instruments:
- price restrictions
- per-unit taxes
1. Price ceilings
Price ceilings
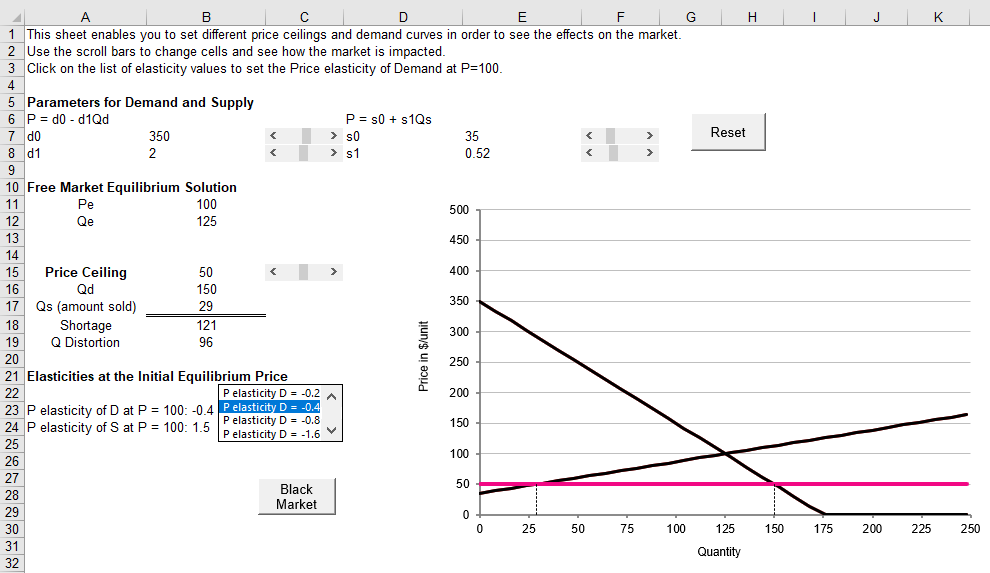
When you open the sheet, it initiates with a price ceiling of $50
Price ceilings
The free-market equilibrium price is $100, quantity is 125 units
Price ceilings
With the price ceiling of $50, producers only supply 29 units
Price ceilings
- Calculate the distortion generated by the price ceiling at $50
- Use the scroll bar to increase the price ceiling to $80
What is the distortion now? Is this better or worse than $50? - Use a figure (can be a screenshot) & your ability to change the price elasticity of demand (PEoD) to explain the relationship between the size of the distortion and the PEoD
- How is price elasticity of supply related to the size of the distortion?
Price ceilings & cheating
Click reset to go back to the original $50 price ceiling
Click the Black market button to reveal the black market values
- Compute the difference between the price ceiling and the black market price as a percentage of the price ceiling value
- Compute the extra revenue that producers would gain if they cheated and sold all that they produce at the black market price
- Use a figure to show the relationship between the black market price and the PEoD
Price ceilings & cheating
- What is the relationship between the PEoS & the black market price?
- What does this all suggest about the overall costs and benefits of price ceilings?
2. Price floors
Price floors
- What is the size of the distortion caused by the price floor (@$125)?
- Set the price floor at $150. How does this compare with above?
- Reset the price floor to $125 and show the relationship between PEoD and the surplus caused by the price floor
- How would you (the policy-maker) keep a price floor at the desired level? In other words, why doesn't the market adjust to eliminate the distortion?
Price floors
- What is the cost of whatever you answered in 4)?
- If you were a government considering price floor policy, would you want demand to be price elastic or inelastic?
3. Taxes
Taxes
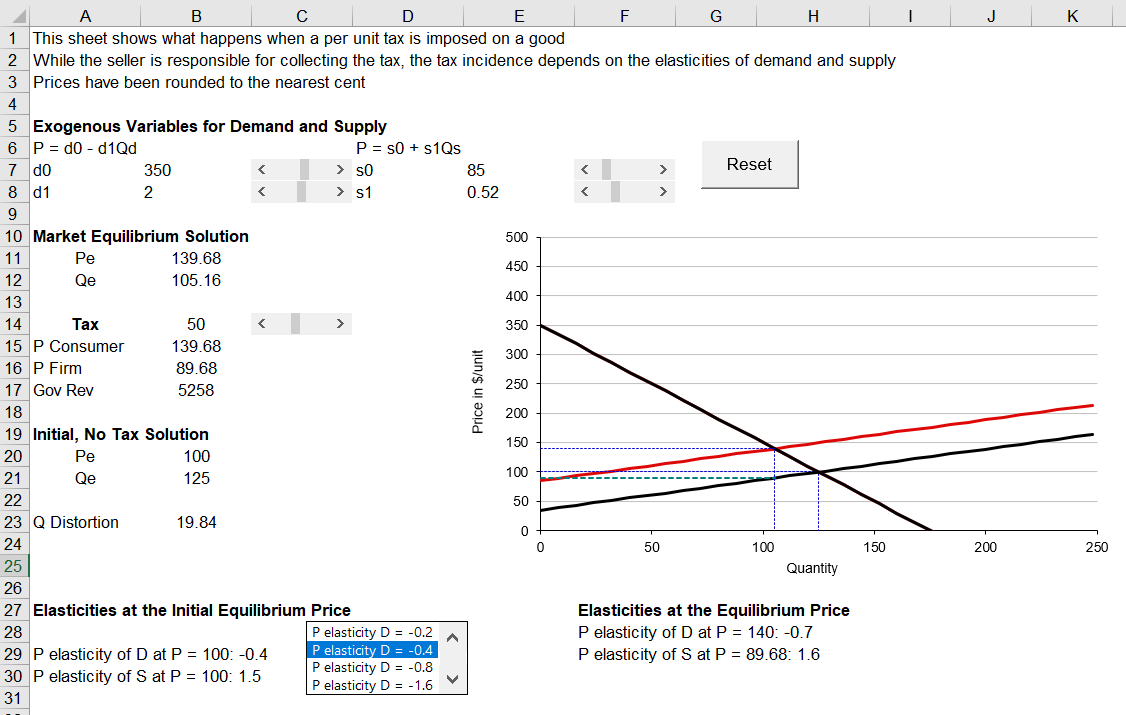
Use the scroll bar to set a tax of $50 dollars per unit on the good
Taxes
Use the scroll bar to set a tax of $50 dollars per unit on the good
- While we illustrate the impact of a per-unit tax as a shift left
(or up) of the supply curve, what is actually happening? Describe the forces that push the market to its new equilibrium. - What are the drawbacks of a per-unit tax? Do these drawbacks depend on the efficiency of the market prior to the tax?
- Who bears the burden of the $50 tax?
Consumers? Producers? How do we measure this?
Taxes
- Keeping the tax at $50 per unit, change the PEoD to -1.6
- Is the distortionary effect of the per unit tax greater now than compared to the initial situation?
-
What can you conclude about the effect of the PEoD on the distortion created by per-unit taxes?
-
For a per-unit tax of $50, compare
-
the government revenue when the PEoD = -0.4 and -1.6
-
the incidence of the tax when the PEoD = -0.4 and -1.6
-
ECF5560-CostBenefitAnalysis-3
By Emilia Tjernström


