FINCHART
A service for an instant access to any market and financial data
WHAT ARE THE BENEFITS?
Easy to find: just type a request in a field or choose an instrument from a list
You no longer need to compare data by dates from different sources to create a consistent data set
Math operations with simple formulas

FOR WHOM?
ECONOMISTS

TRADERS


INVESTMENT ANALYSTS
INVESTORS

RISK-MANAGERS

ACADEMICS

HOW TO USE
Type formula or choose an instrument from the list

Get data and a chart

Save as EXCEL


OR USE
EXCEL Plugins

API

INSTRUMENTS
Market data


Stocks
Forex
Commodity
Bonds
Financial data

Fundamentals
Financial ratios
Financial multiples
Money market

Interest rates curves
Economy

Macroeconomic indicators
FINCHART IS ABLE TO
Build and save personal indices via formula designer
Get historical multiples and financial rates
Perform mathematical calculations and indicators
Screener
Flexible search
References and description
Integration
Dashboard for quotes and indices tracking

Indices and portfolios
Spreads
Currency conversions
Comparison charts
Assign names to formulas and use in others
Use default
Or build your own
Use default indicators
Use integrated mathematical and financial functions
Web site with charts and Excel export
Share the formula via link or save for tracking
Excel plug-ins
API
Assets
Exchanges
Currencies and interest rate curves conventions


Custom criteria
Multi asset
LOOK IN MORE DETAILS
What FinChart can

fI
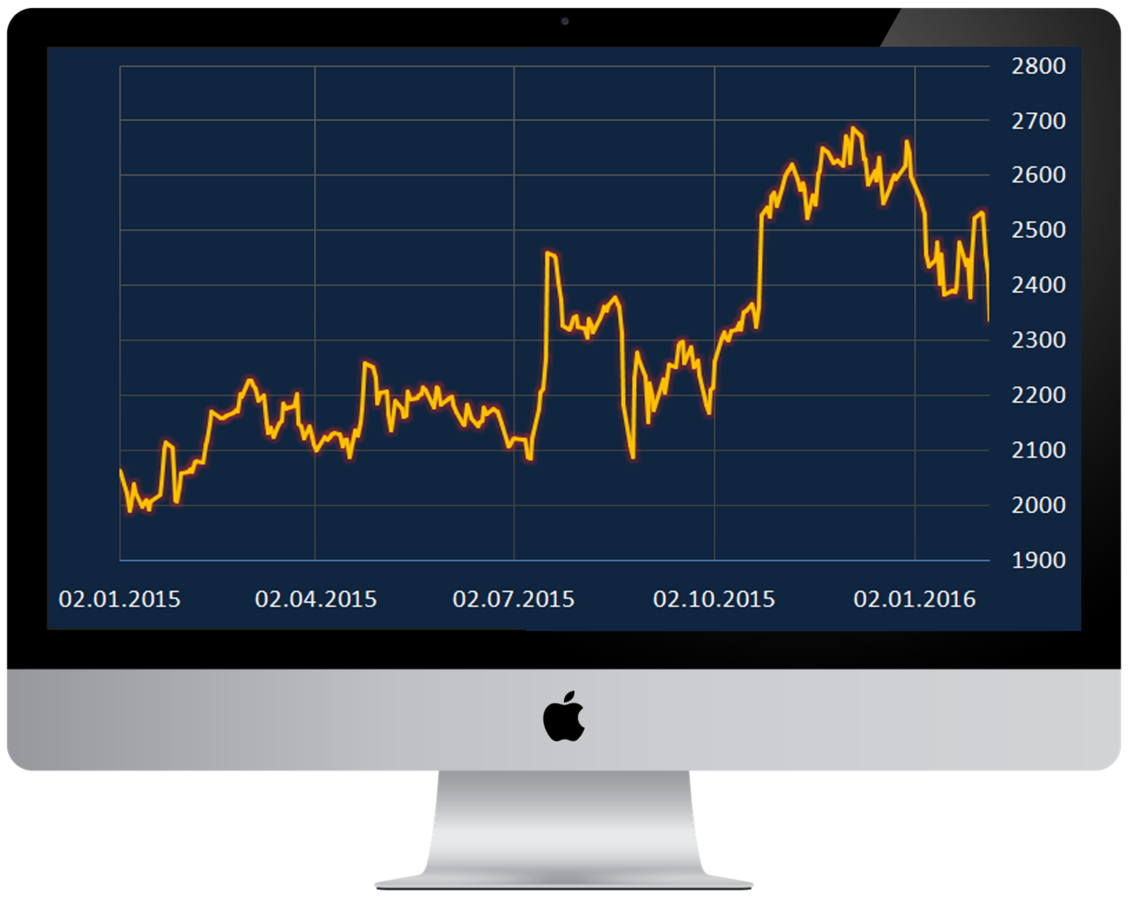
BUILD AND SAVE PERSONAL INDICES VIA FORMULAS DESIGNER
Indices and portfolios
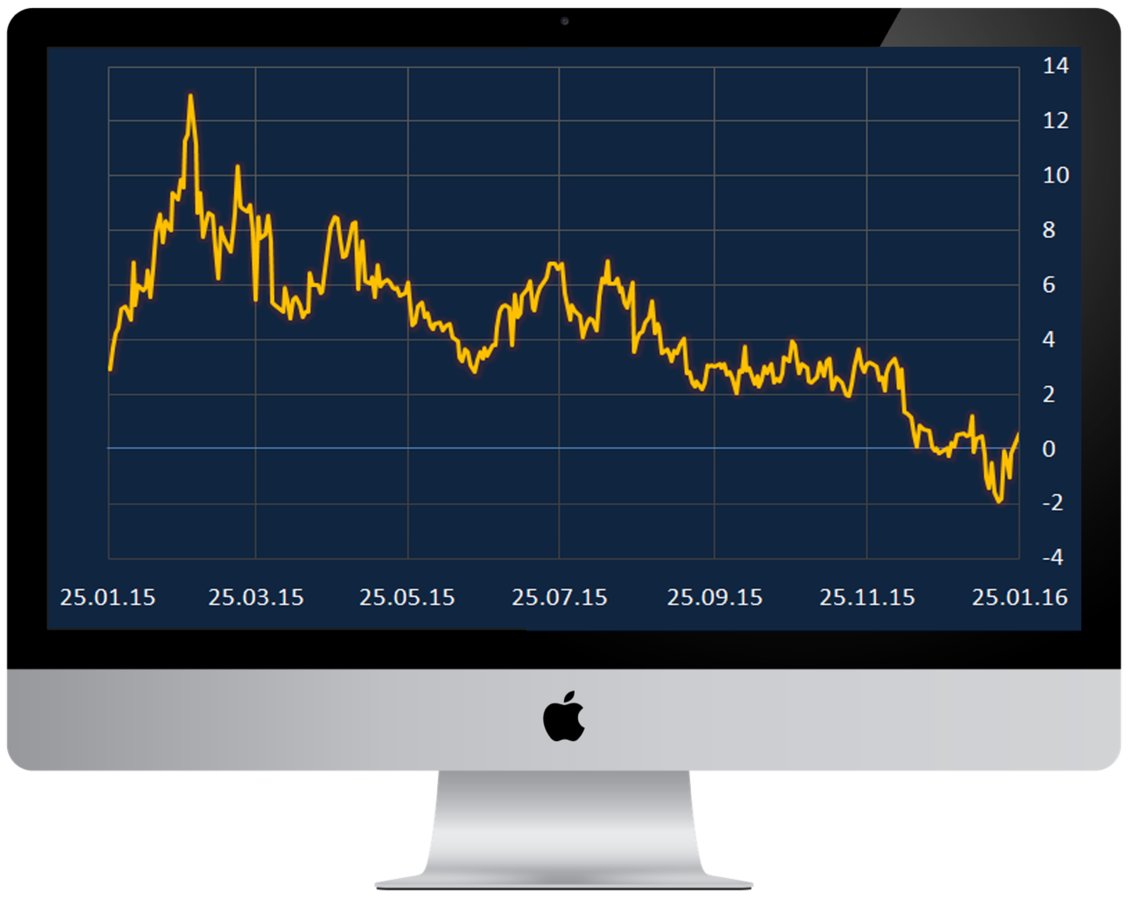
Spreads
(5*AAPL + 10*MSFT + 2*GOOG)
BRENT - LIGHT

BUILD AND SAVE PERSONAL INDICES VIA FORMULAS DESIGNER
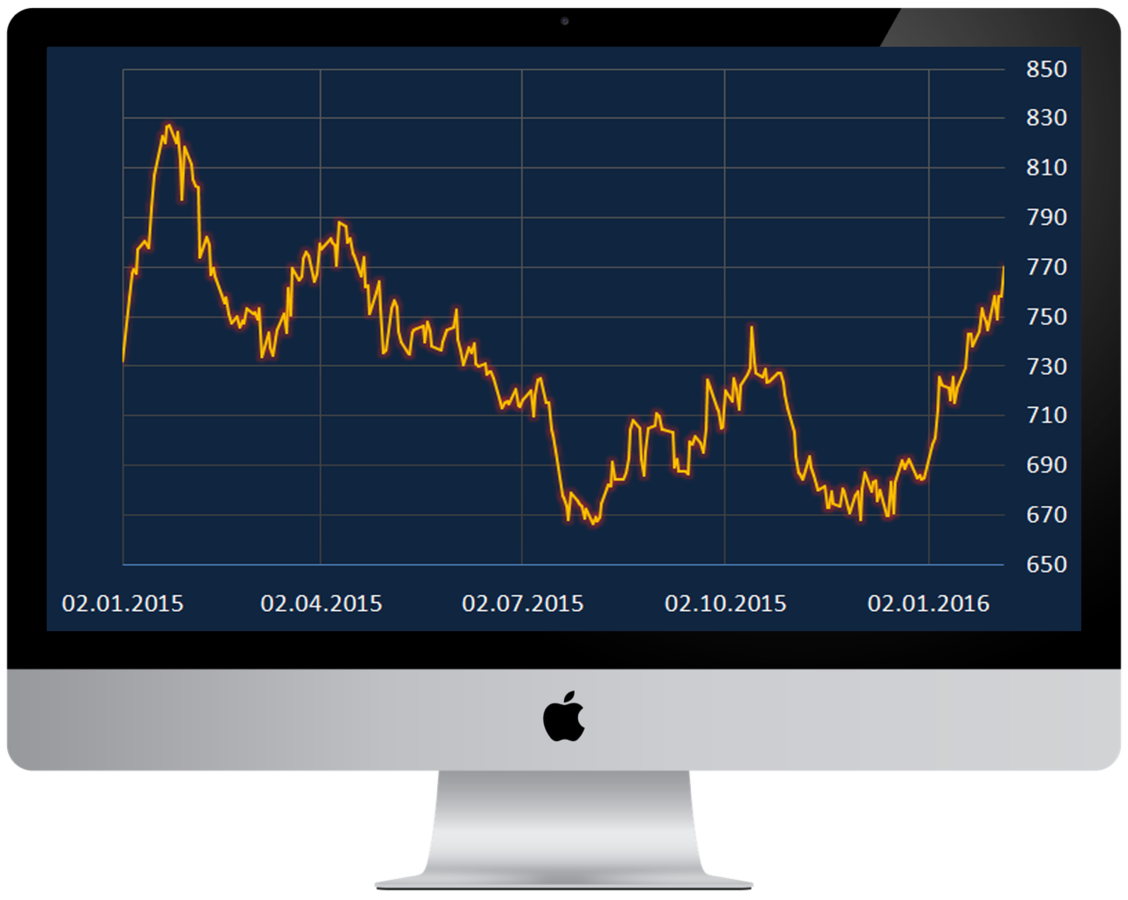
Currency conversion
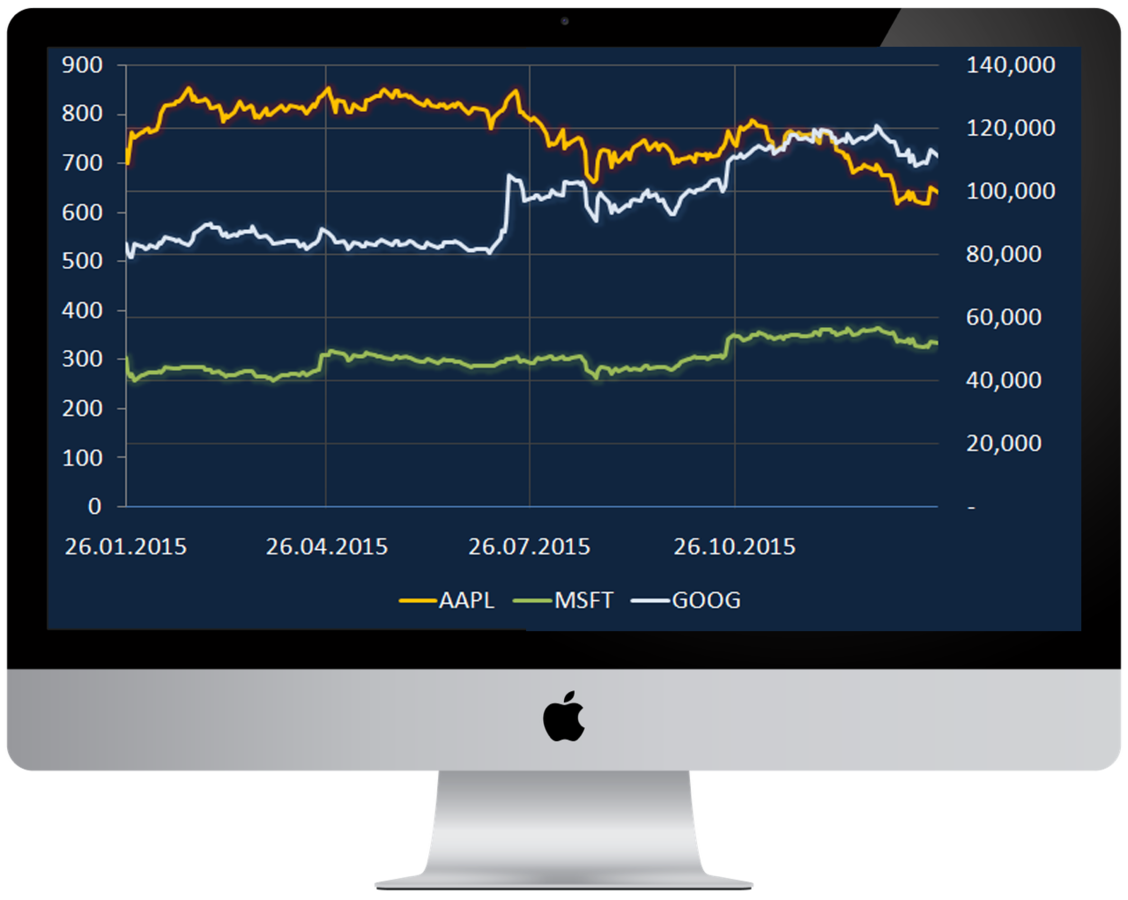
Comparison charts
GOLD*USDGBP
AAPL, MSFT, GOOG
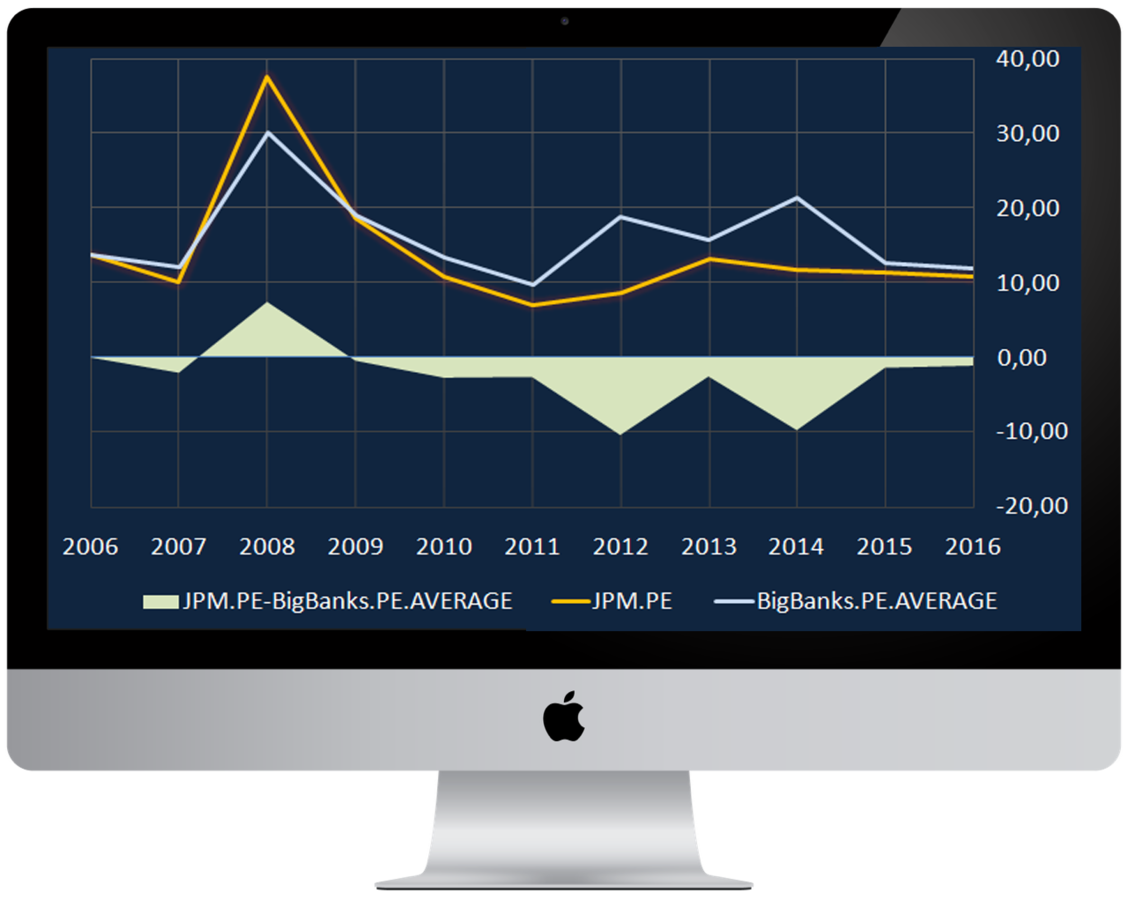
BUILD AND SAVE PERSONAL INDICES VIA FORMULAS DESIGNER
Assign names to formulas and use in other indices
(JPM + BAC + WFC + C + USB) as BigBanks
BigBanks.PE.AVERAGE - JPM.PE,
JPM.PE, BigBanks.PE.AVERAGE

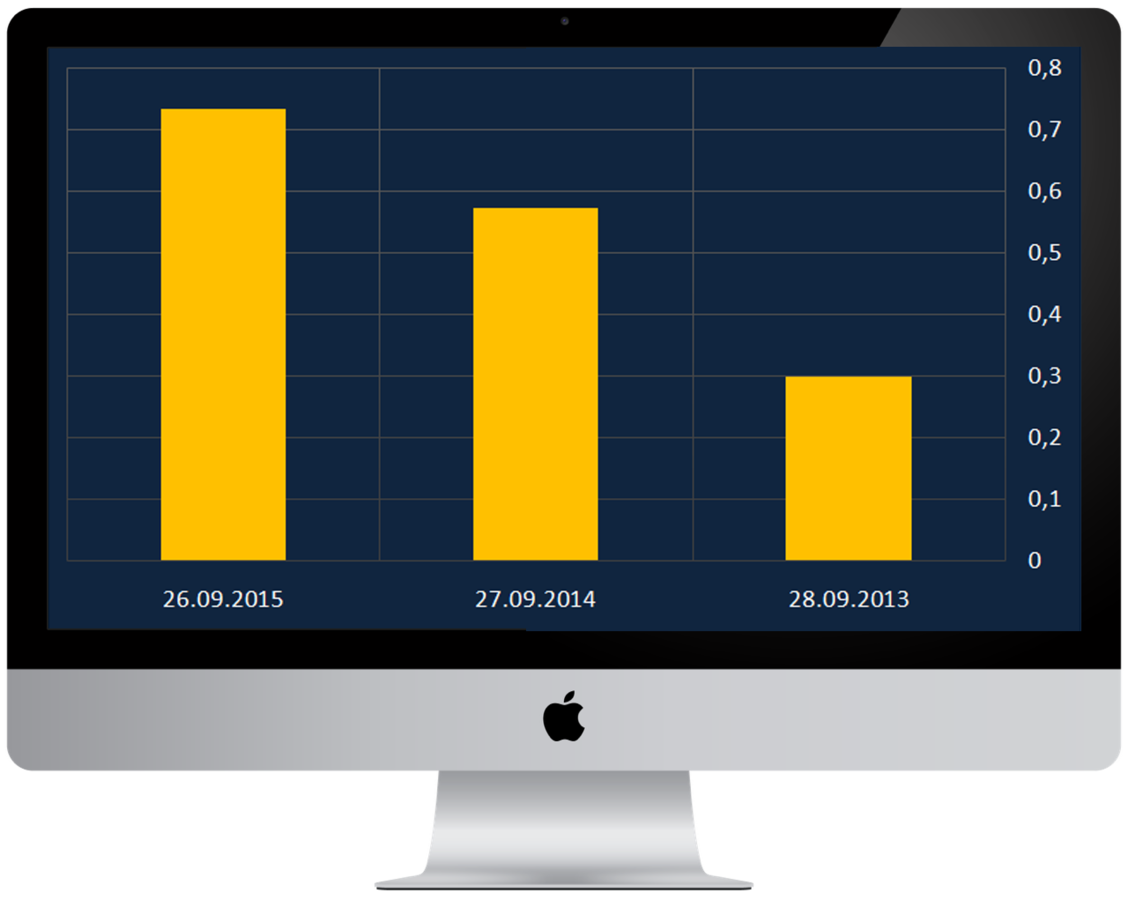
GET HISTORICAL MULTIPLES AND FINANCIAL CHARTS
Use default
Build your own
GOOG.PE
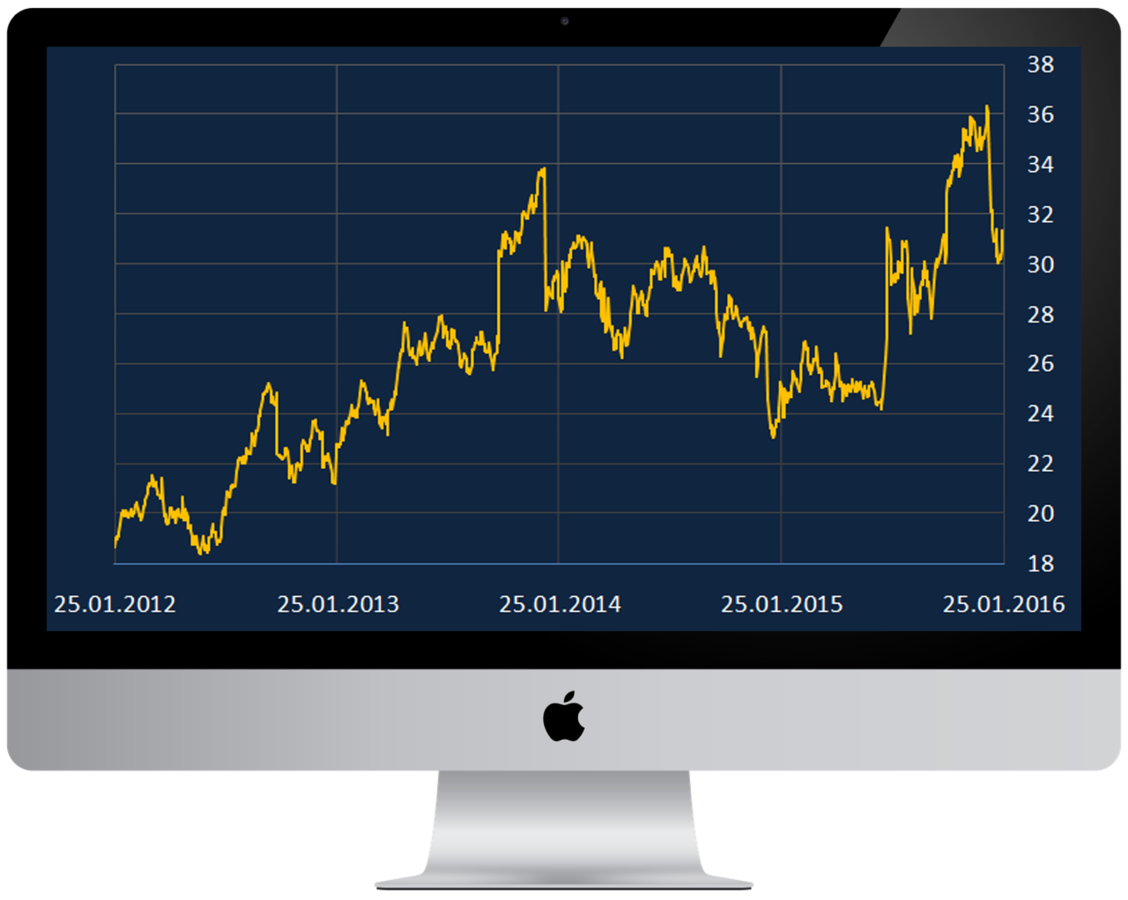
(AAPL.LONGTERMDEBT + AAPL.SHORTTERMDEBT) / AAPL.EBITDA

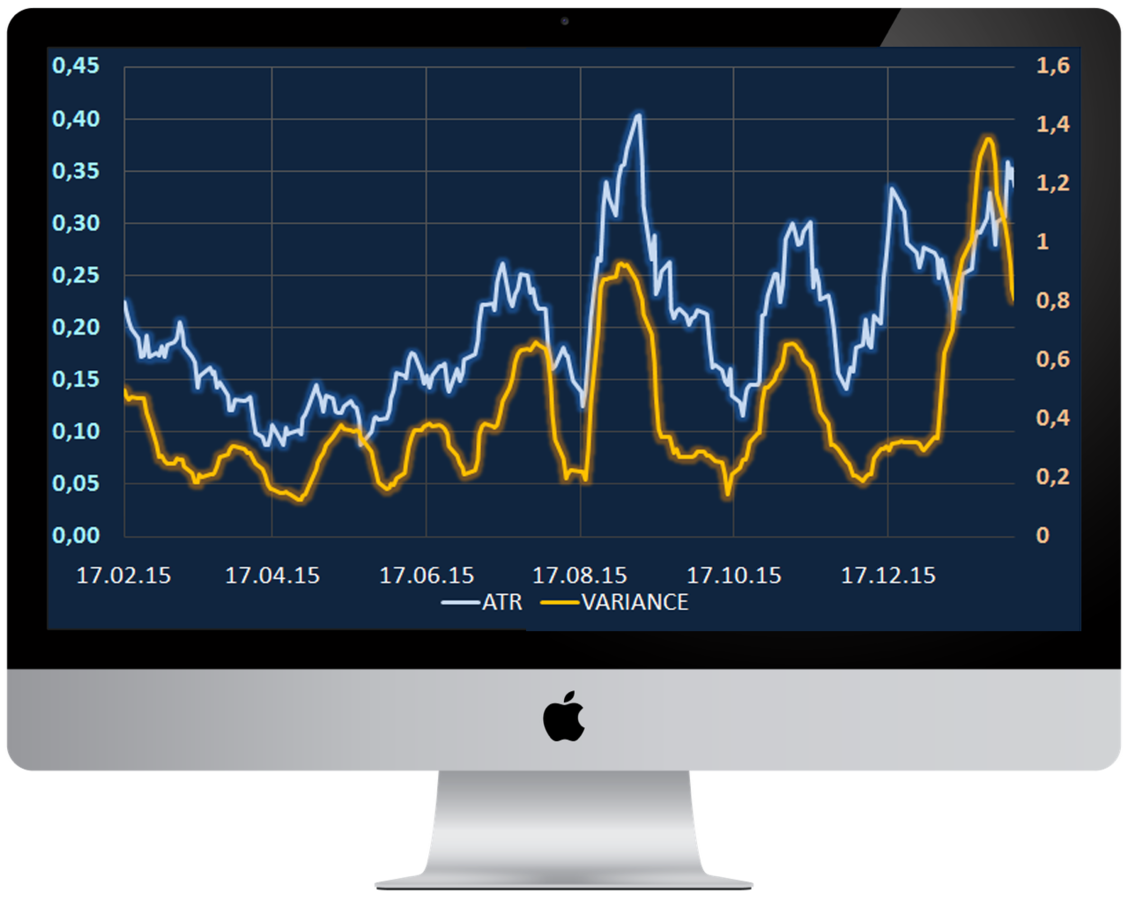
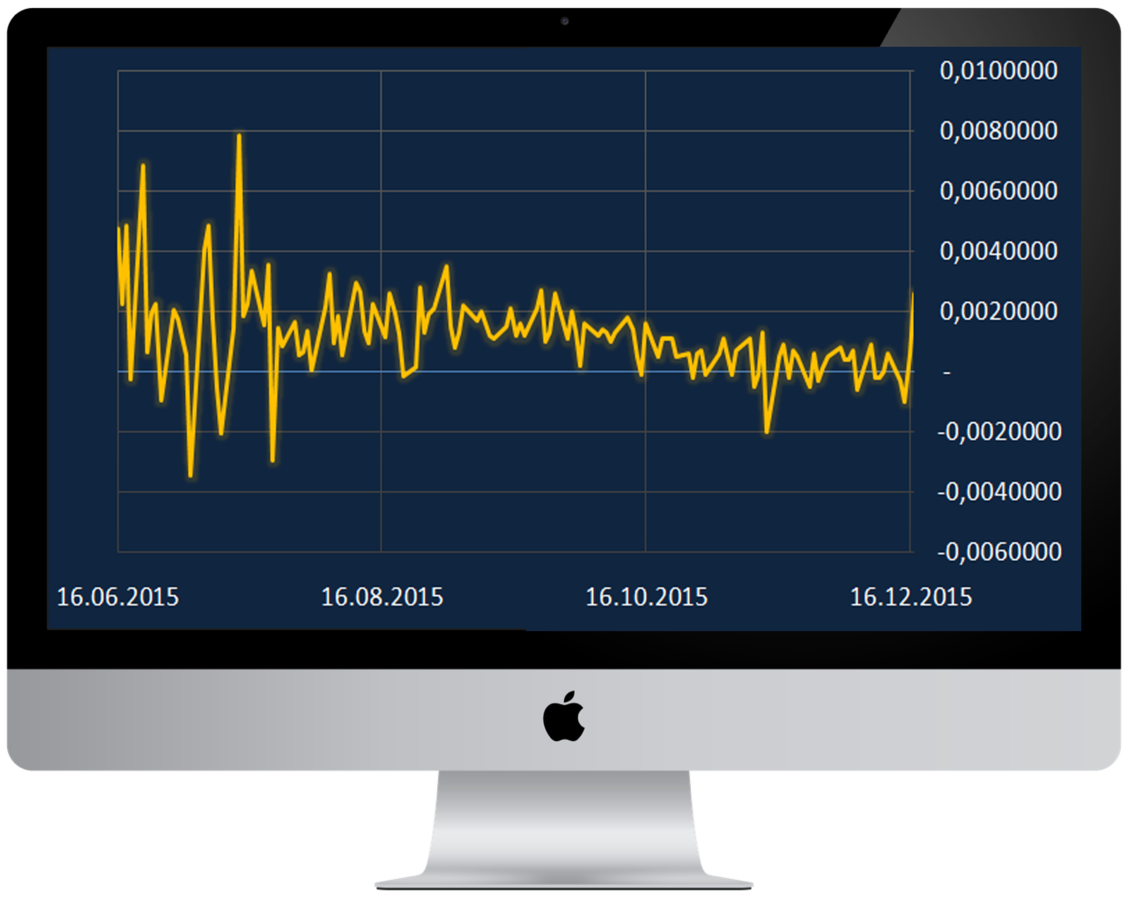
PERFORM MATHEMATICAL CALCULATIONS AND INDICATORS
BAC, BAC.MAX(1M), BAC.BOLLINGER BANDS
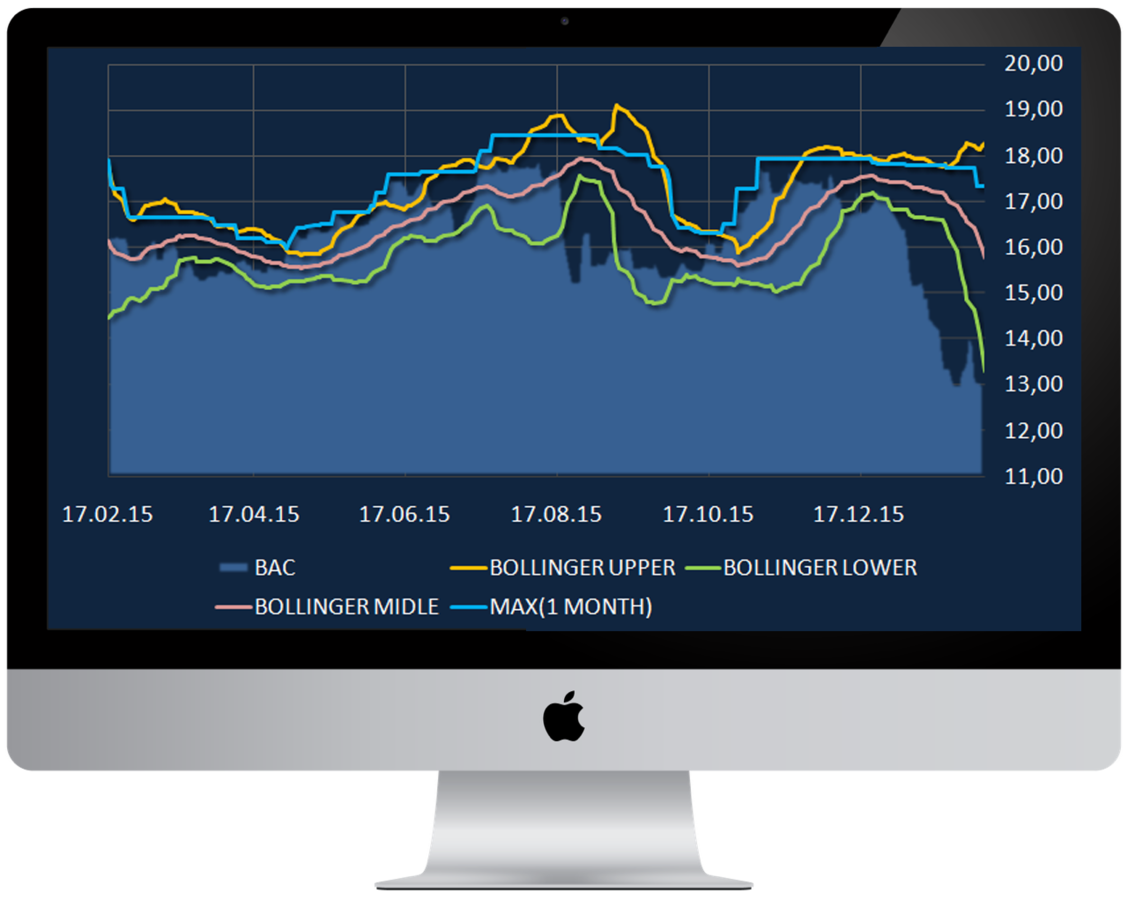
BAC.ATR, BAC.VARIANCE
Use default indicators
For example, classic indicators for Bank Of America (BAC): VARIANCE, MAX, ATR, BOLLINGER BANDS...
PERFORM MATHEMATICAL CALCULATIONS AND INDICATORS
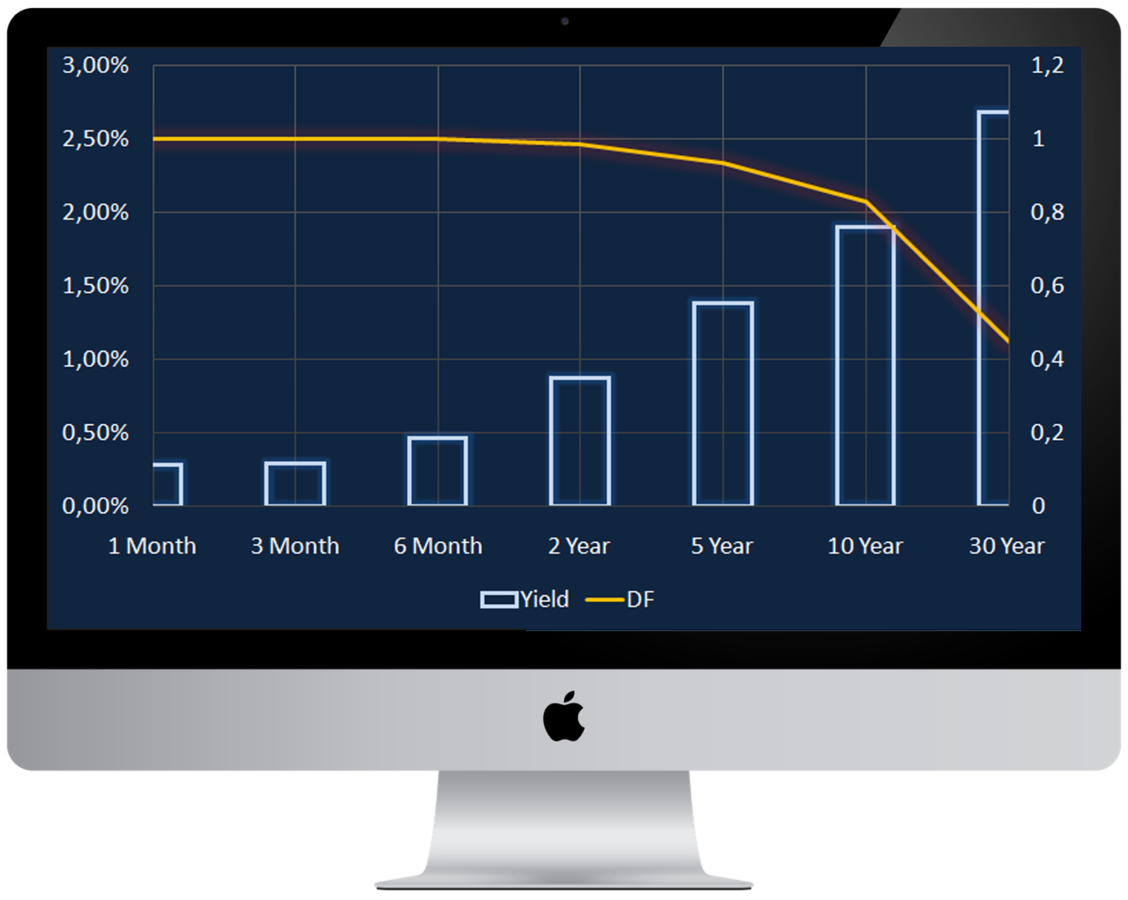
EuZ16-EURUSD*exp(LIBOR(EuZ16.expiration))
Use integrated mathematical and financial functions
EXP, LN, DF, INTERPOLATION, ANNUITY etc.
USDLIBOR(20.02.2016) as L;
L, DF(L)
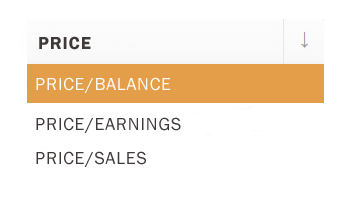
SCREENER
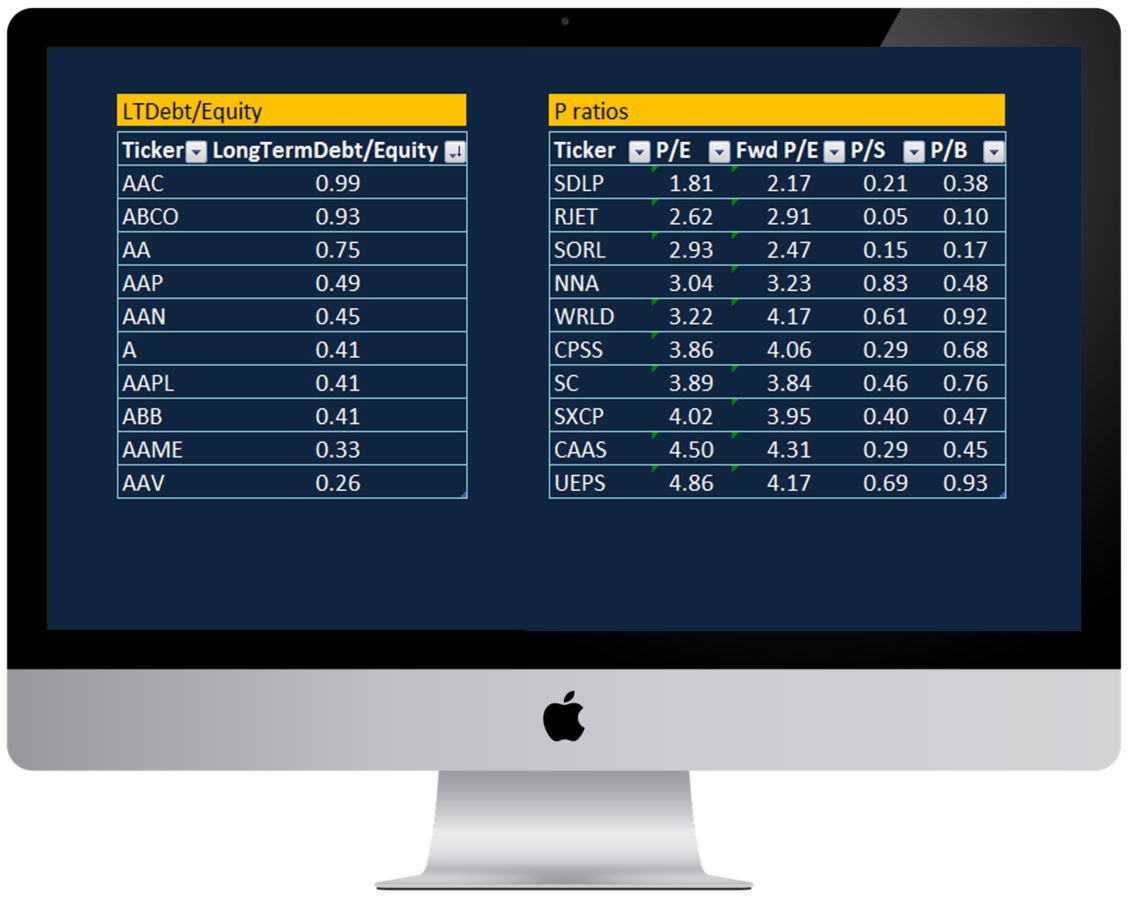
Create your formula or use default multiples as search parameters. This way, you gain access to an absolutely flexible scanner for stocks and other market assets
DASHBOARD

There is no need to search data and build required indices or make calculations. Use the Dashboard to save it and track every time you need
FLEXIBLE SEARCH
We store all data as a big tree model from the highest global level down to the specific metric of a certain company
From global to local:
USA.NASDAQ.MSFT.NETCASHFLOW
To find required asset just type its ticker or full name:
Or you can use the search function
Smart tool-tips: MSFT.pr
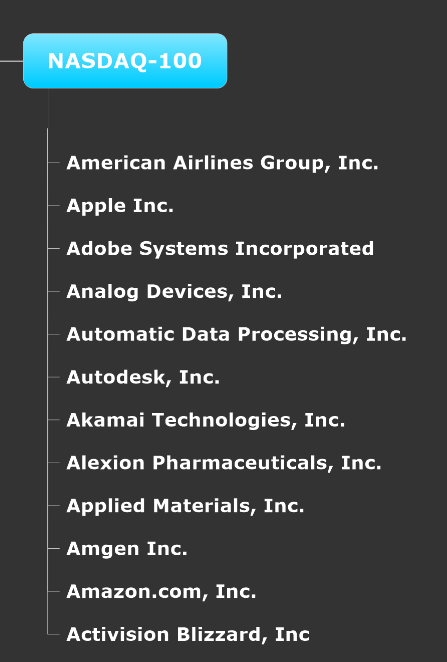
Bank of America BAC
USA.GDP
INTEGRATION
The general idea – to provide a simple tool, which allows the user to acquire any data in two clicks: open web site, type formula or asset name, retrieve chart or excel file. That’s all!
Web site with charts and Excel export
If your basic job instrument is Excel, you can find our integrated formulas very useful. Implement financial ratios, fundamentals and quotes directly into your spread sheet or send requests with your special formulas
Excel Plug-ins
Are you an applications developer? All functions will be available through API, allowing you to focus on your clients
API
Communication is a highly important aspect. If you wish to discuss ideas or share useful concepts with colleagues/partners, just send them a browser link. F.e.: http://FinChart.net/?query=5*aapl%2B6*goog. Following the link, your colleague will be able to view the same screen as you
Share the formula via link


REFERENCES AND DESCRIPTIONS
Before initializing the trading process, ideally you should understand what you are going to trade in great detail. Instead of searching fragmented information you can find all relevant details in one convenient location
Changes notifications
It is very important to be confident in all changes of traded assets, stocks, companies and exchanges. Stocks splits, marginal requirements, or even ticker changes could occur suddenly. To avoid any complications related to these unexpected changes you can use:


RSS subscription
E-mail notifications
API connection
Description of all assets and exchanges
SHARE YOUR OPINION
If you have any ideas or queries about instruments you might find useful in your daily work please don’t hesitate to e-mail feedback@finchart.net
feedback@finchart.net
For feedback:
For requests:
request@finchart.net
We will greatly appreciate if you share with us your review of the instruments presented here to gain insight to which instruments are important for you and which are less so
Thank you!


Welcome
By FinChart
