


Daniel Haehn PRO
Hi, I am a biomedical imaging and visualization researcher who investigates how computational methods can accelerate biological and medical research.
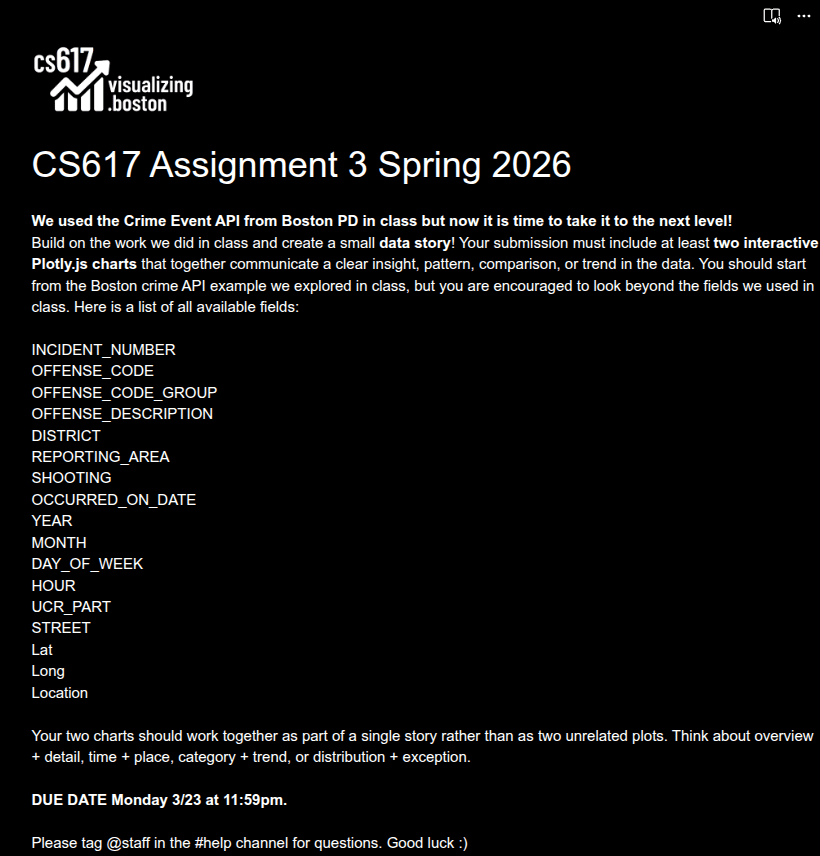
3/23!
Crime API
SELECT "DISTRICT",
       "OCCURRED_ON_DATE",
       "SHOOTING",
       "OFFENSE_DESCRIPTION"
FROM "b973d8cb-eeb2-4e7e-99da-c92938efc9c0"
WHERE CAST("SHOOTING" AS INT)=1
We will grab the data in Colab together!
create a plotly visualization as a team!
3/11 via Zoom!
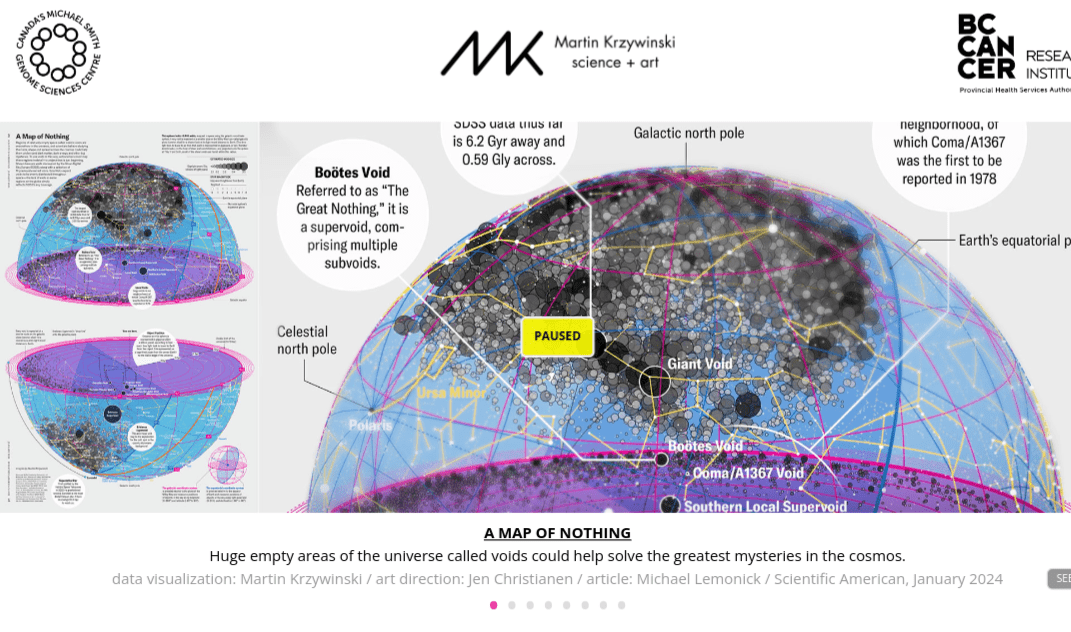
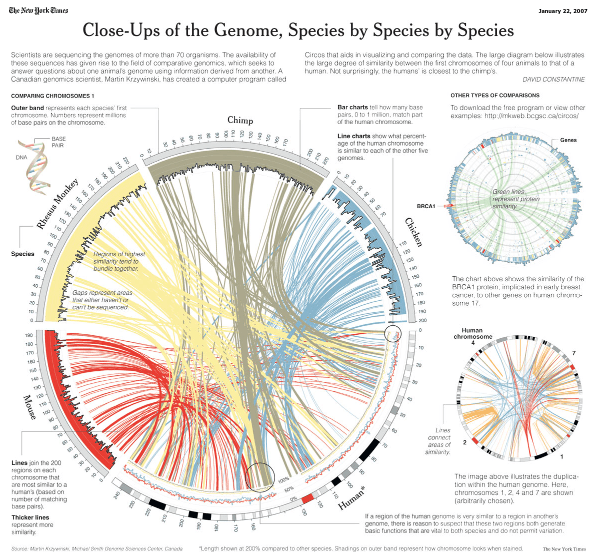
Martin Krzywinski
Fritz Lekschas
Thursday via Zoom!
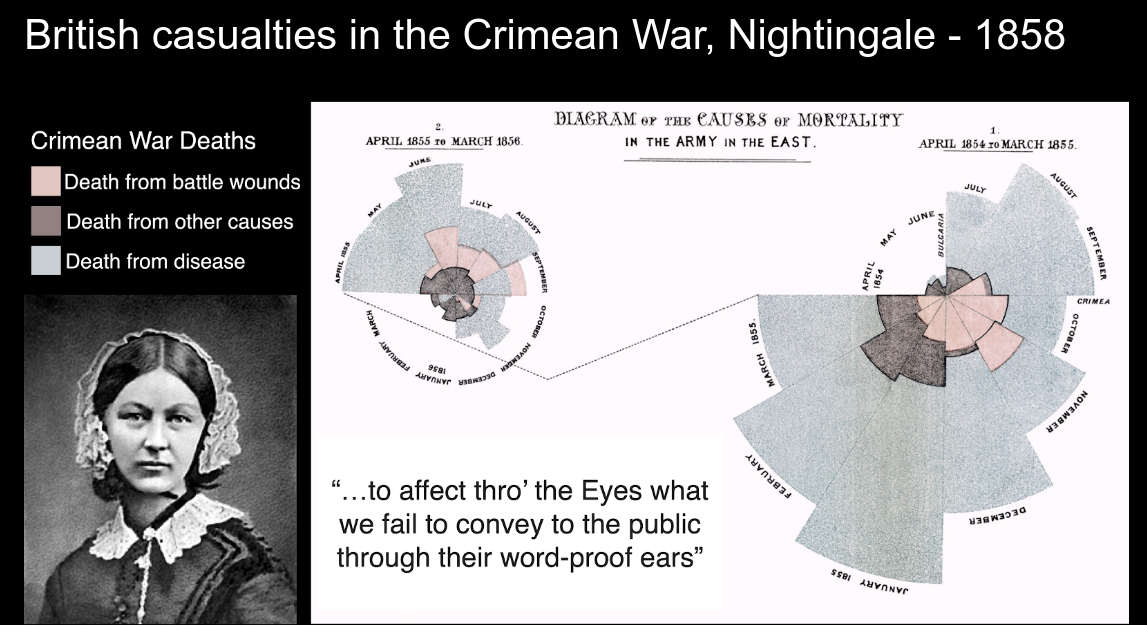
Coxcomb chart or polar area diagram, very popular today
Sankey Diagram
Homework
Create a new circle every second until 100 randomly positioned circles are on the screen with D3!
???
<html>
<head>

  <style>
    body {
      color: white;
      background-color: black;
      width: 100%;
      height: 100%;
      overflow: hidden;
      padding: 0px;
      margin: 0px;
    }

    svg {
      position: absolute;
      width: 100%;
      height: 100%;
    }
  </style>
  <script src="https://d3js.org/d3.v7.min.js"></script>
  <script>

  window.onload = function() {


    s = d3.select('#s');

    setInterval(function() {

      s.append('circle')
        .attr('cx', 1000*Math.random())
        .attr('cy', 1000*Math.random())
        .attr('r', 100*Math.random())
        .attr('fill', 'hotpink');

    }, 100);


      // s = document.getElementById('s');

      // c = document.createElementNS("http://www.w3.org/2000/svg", "circle");
      // c.setAttribute('r', 100*Math.random());
      // c.setAttribute('cx', 1000*Math.random());
      // c.setAttribute('cy', 1000*Math.random());
      // c.setAttribute('fill', 'hotpink');

      // s.appendChild(c);

    }

  </script>

</head>
<body>
  <svg id='s'>
  </svg>
</body>
</html>
Homework
Sankey Diagram
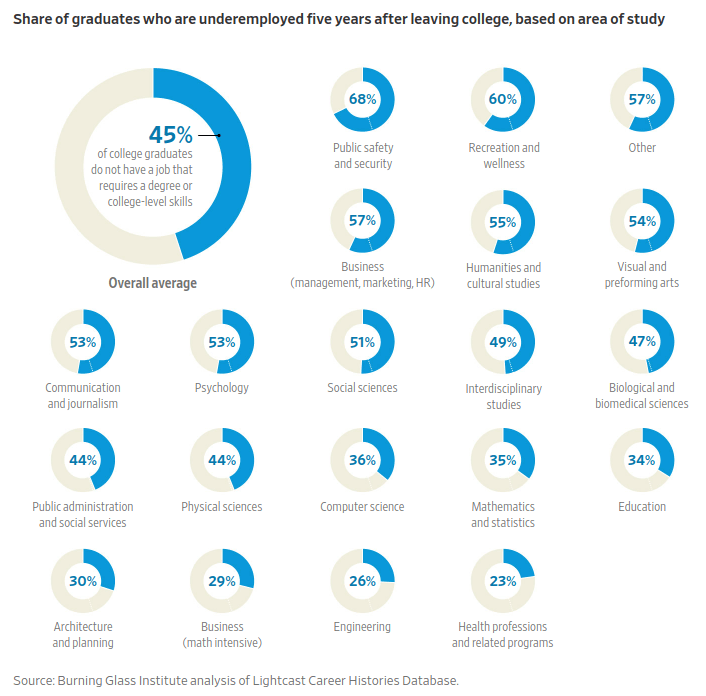
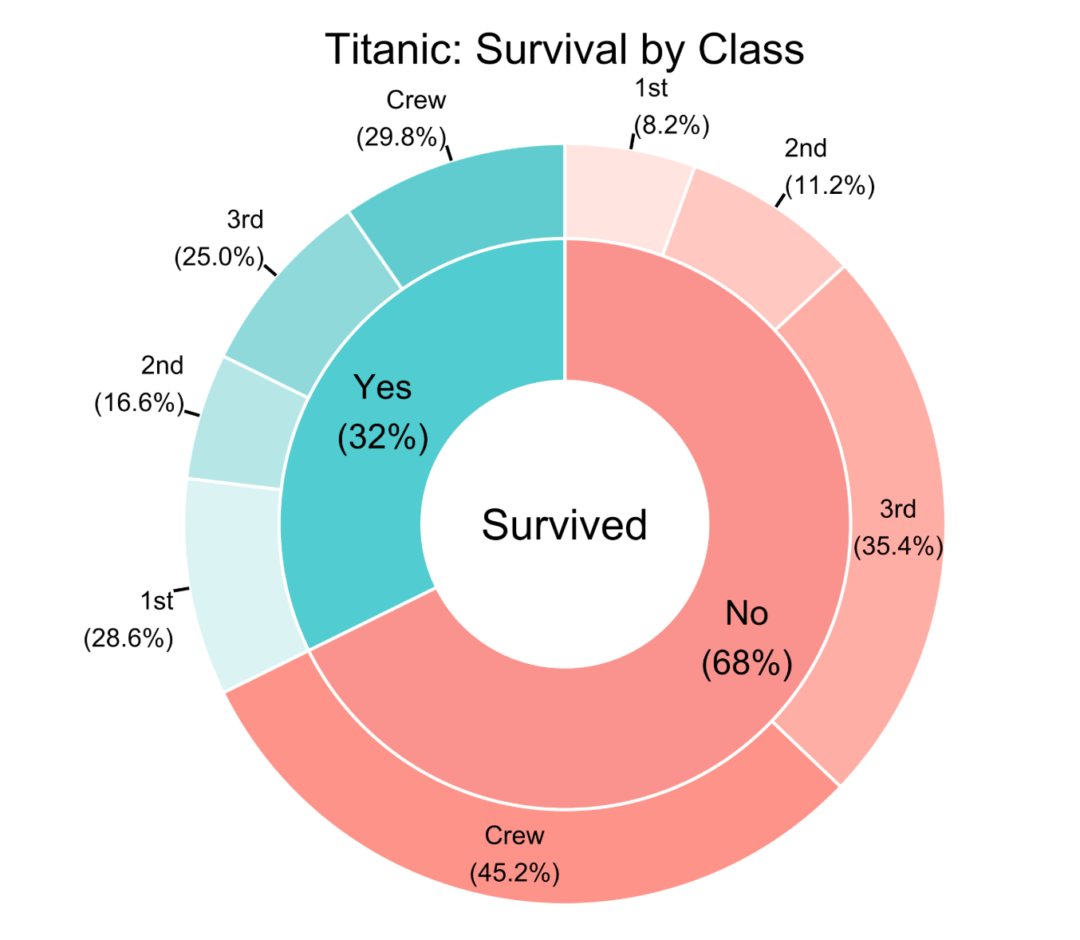
Donut Chart
Donut Chart
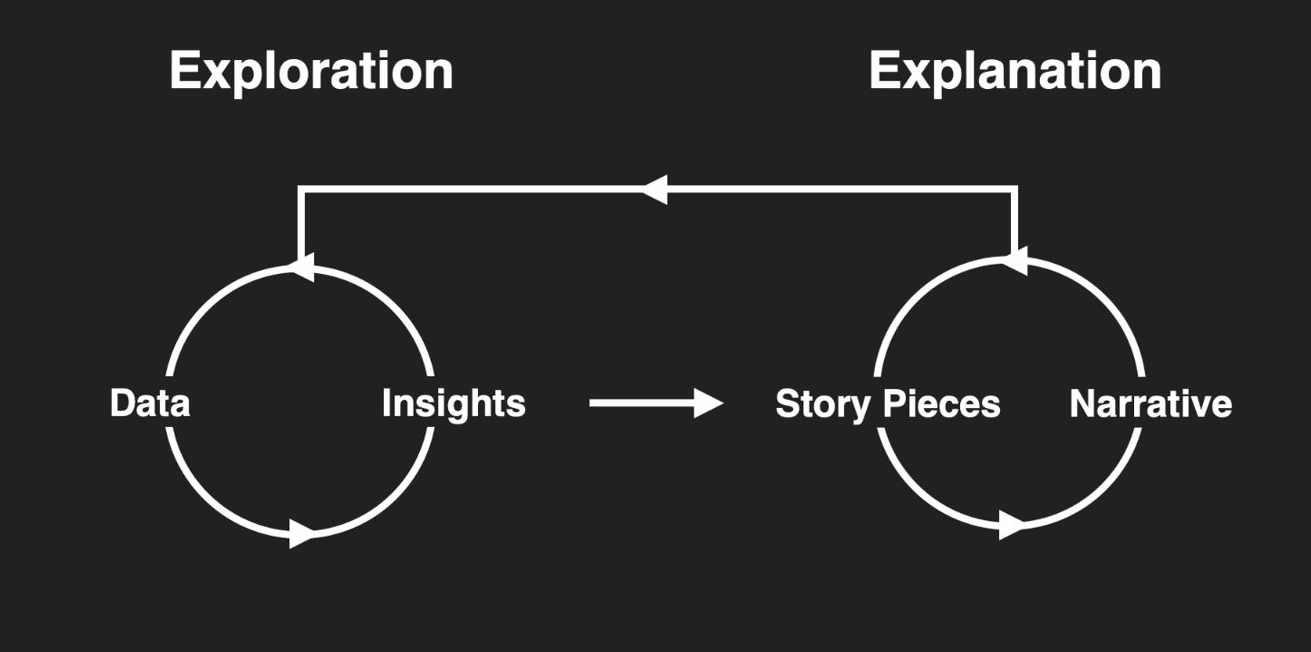
Stories..
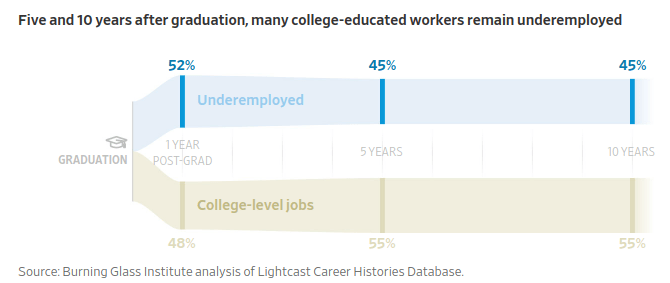
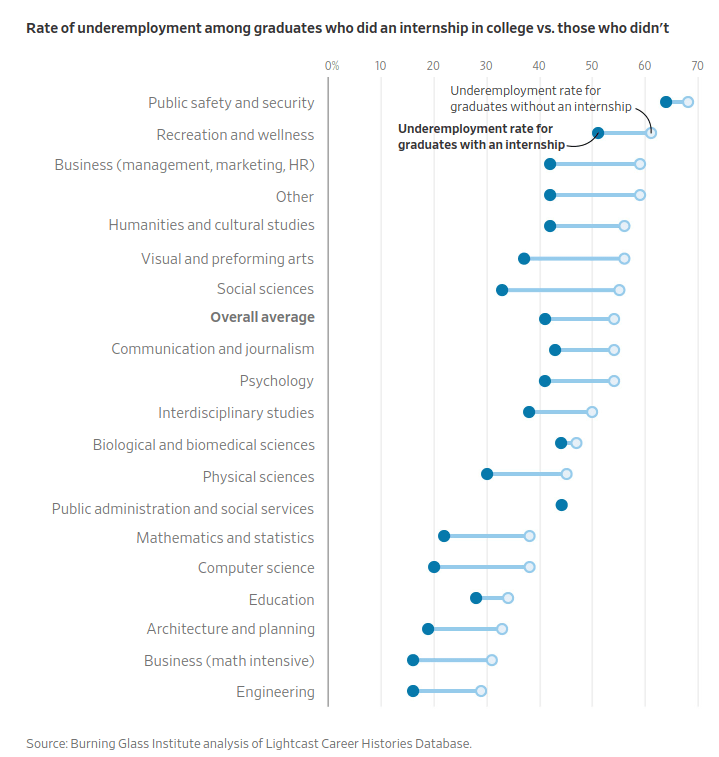
Dumbell Plot
Connected Dot Plot
Ranged Dot Plot
Horizontal Range
Min-Max Plot
Homework
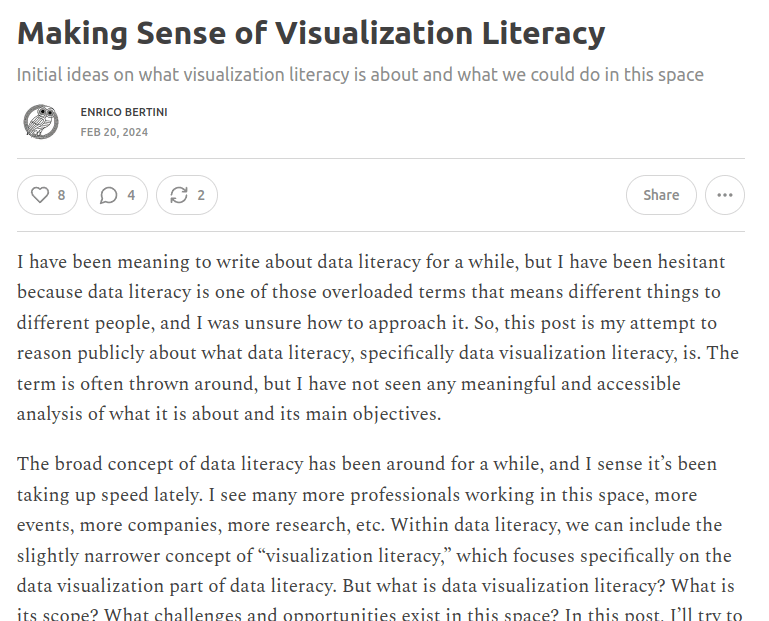
Read Enrico Bertini's take on Visualization Literacy!
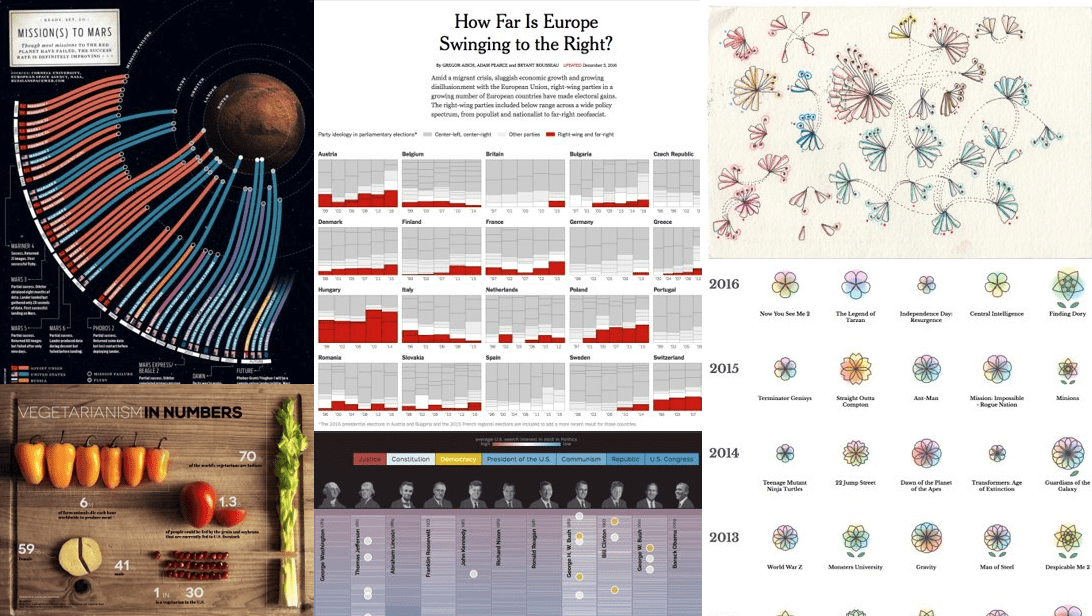
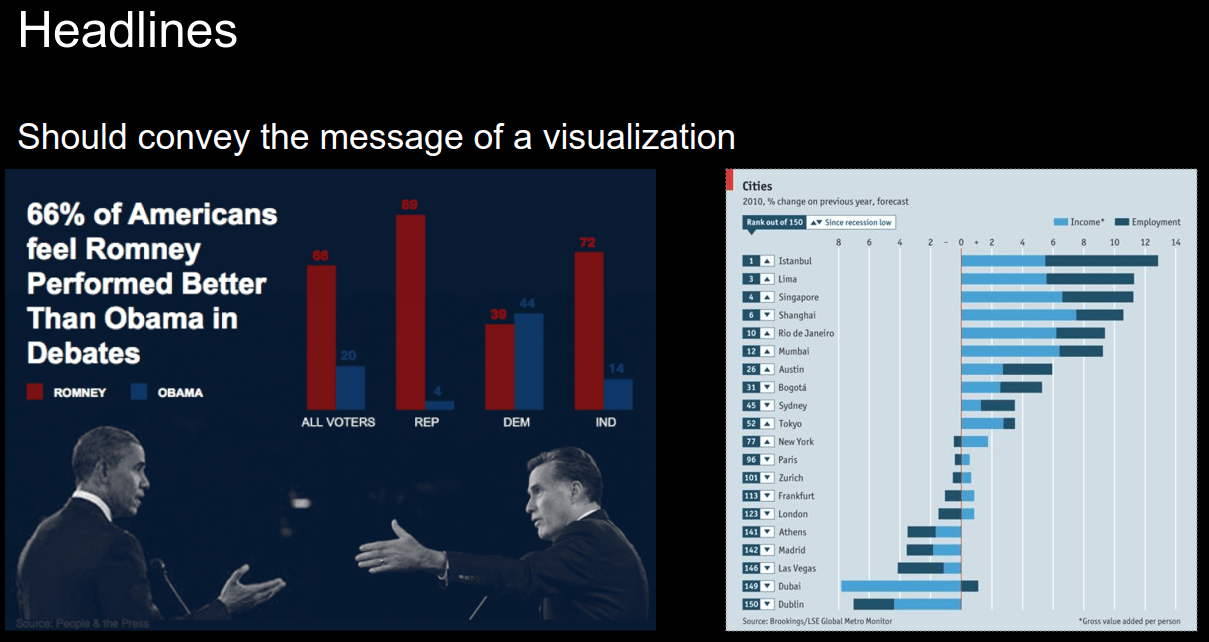
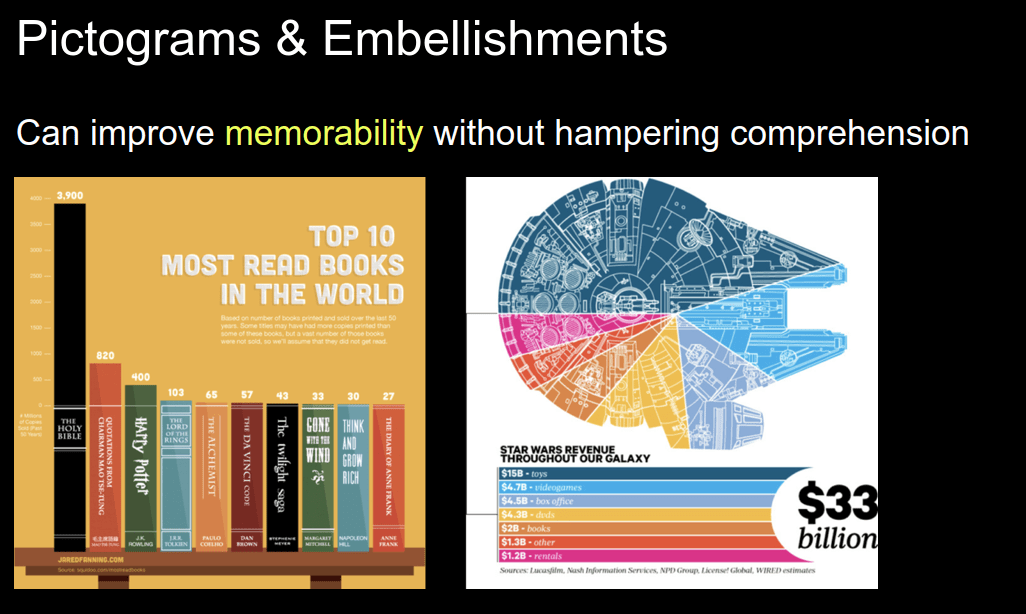
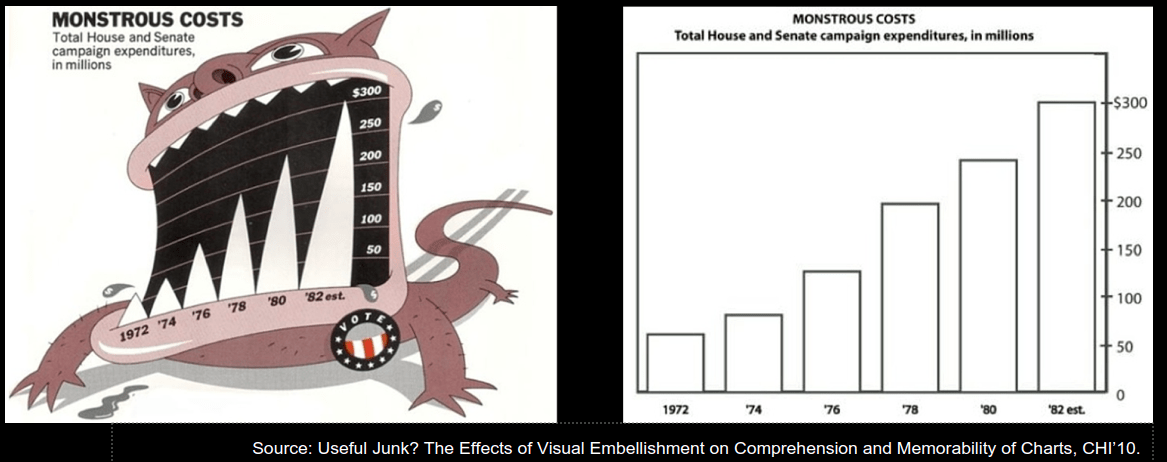
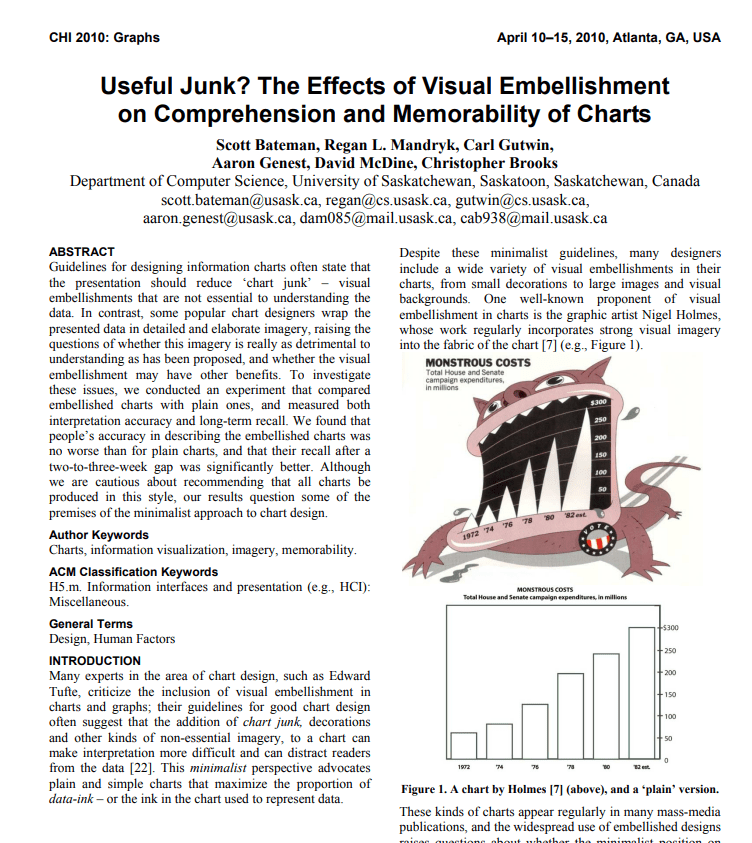
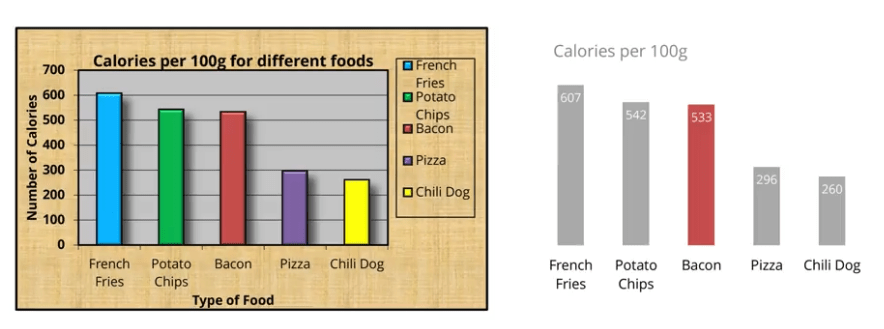
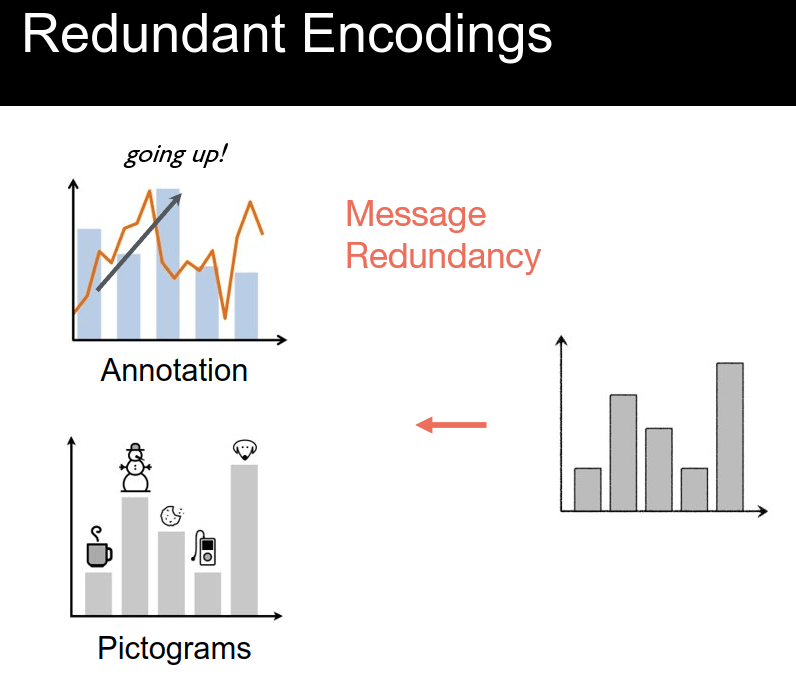
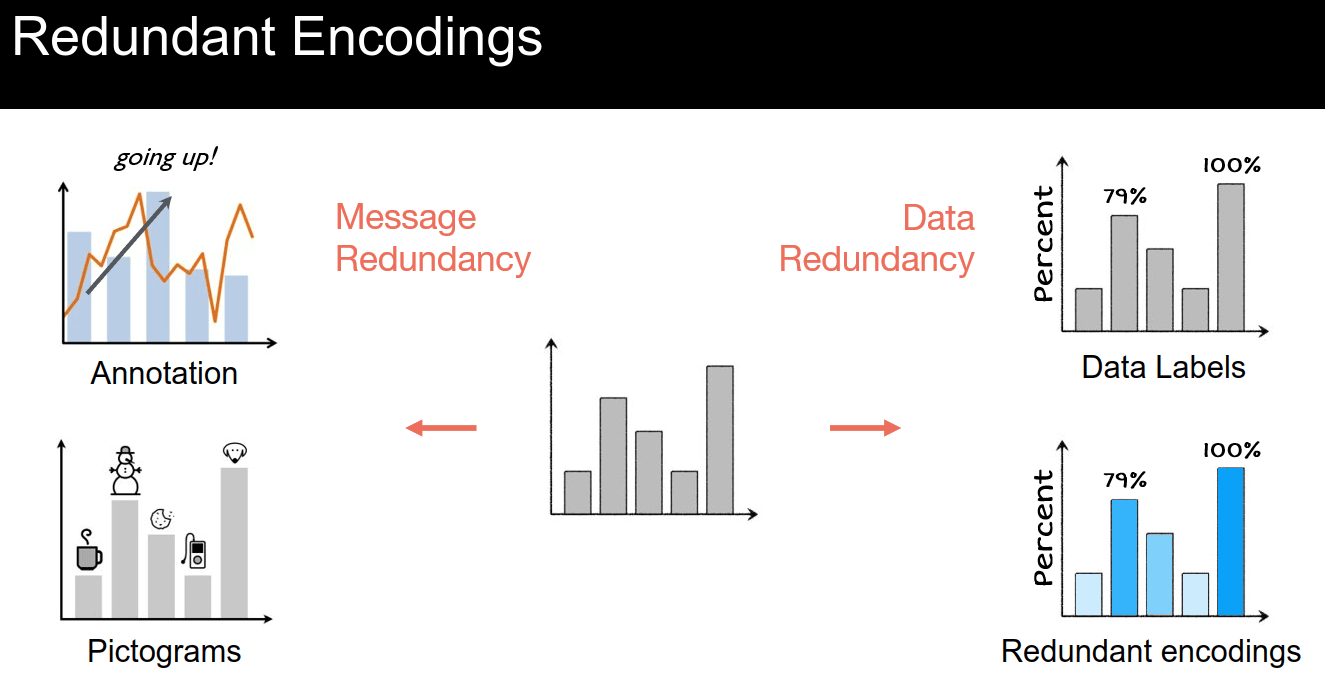
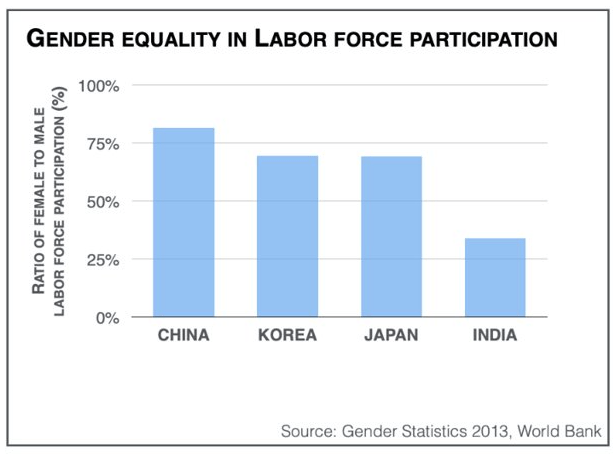
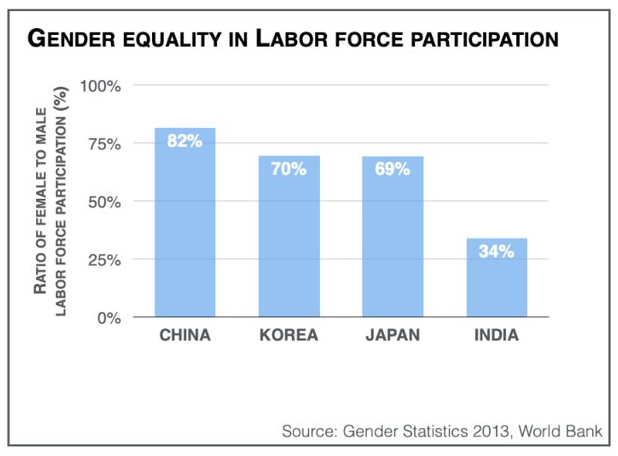
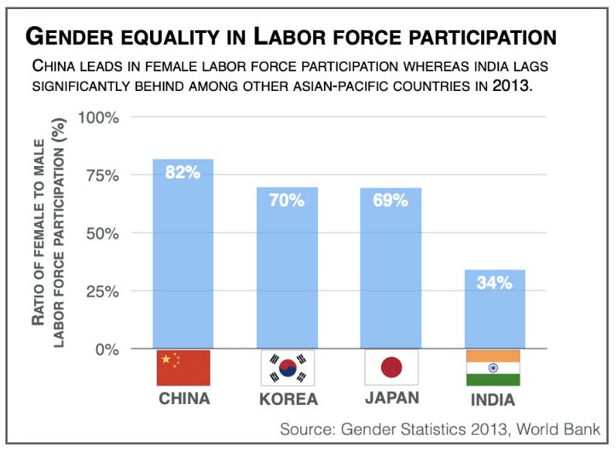
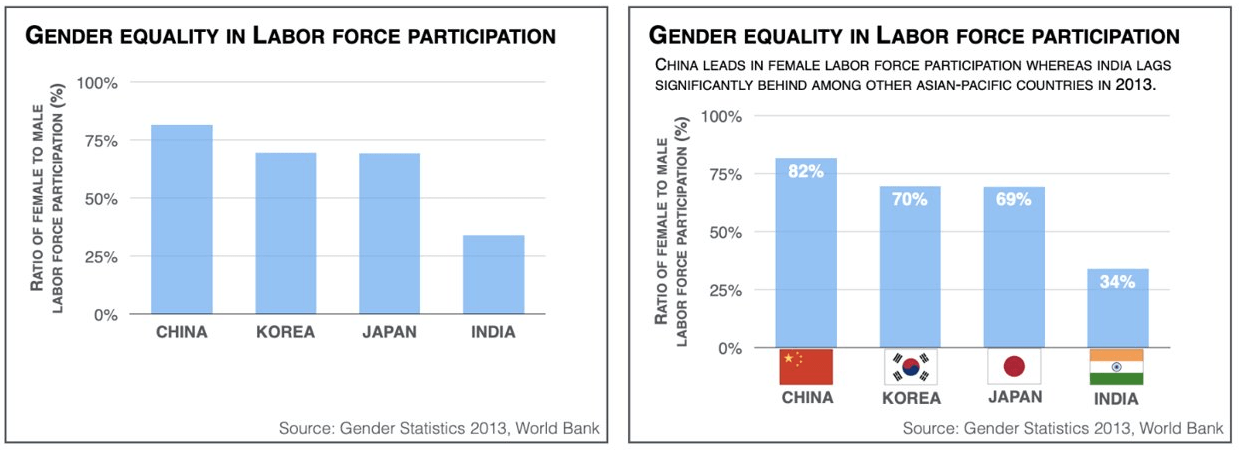
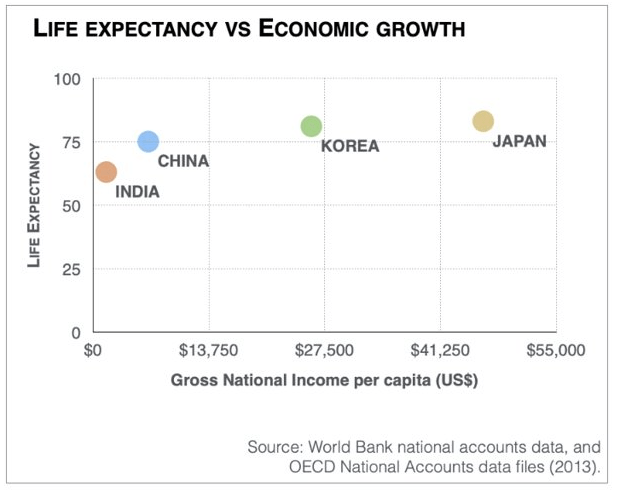
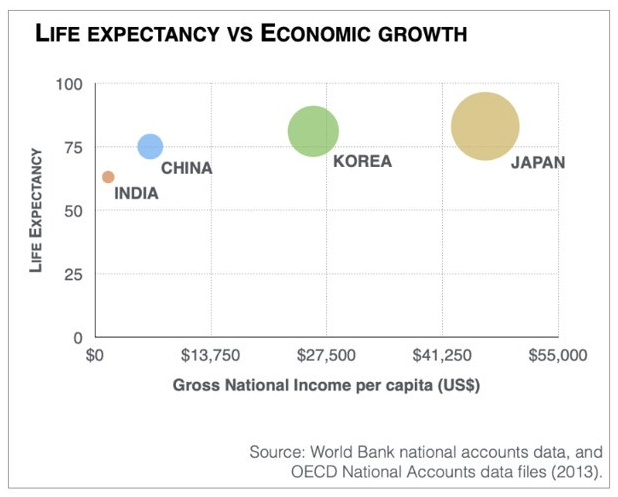
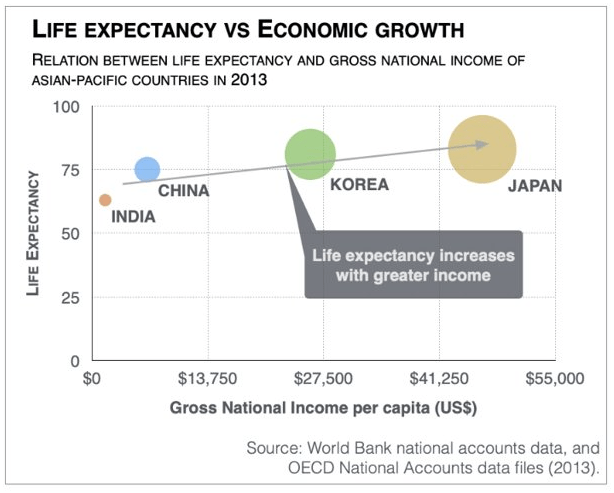
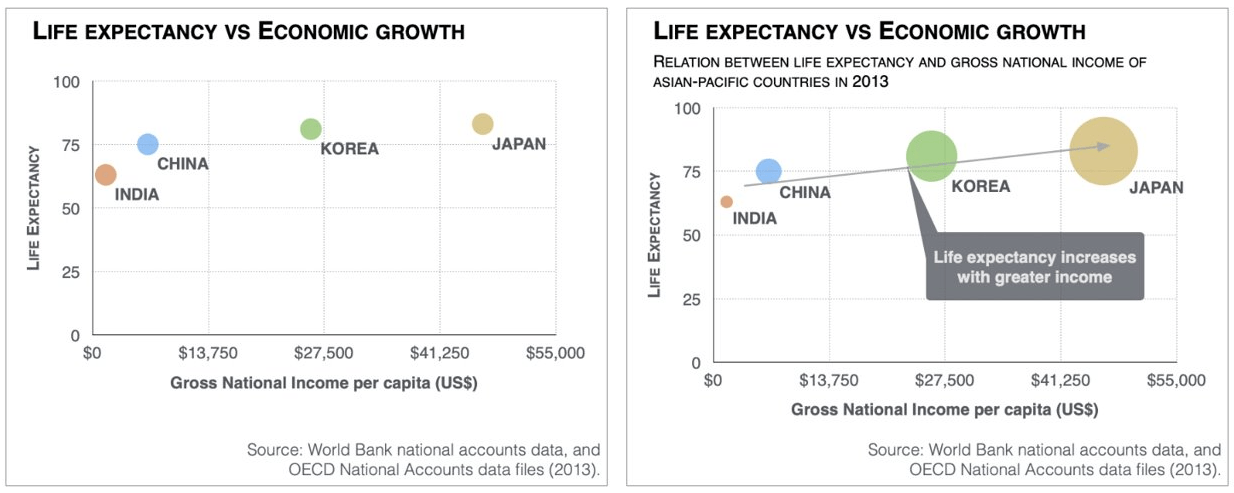
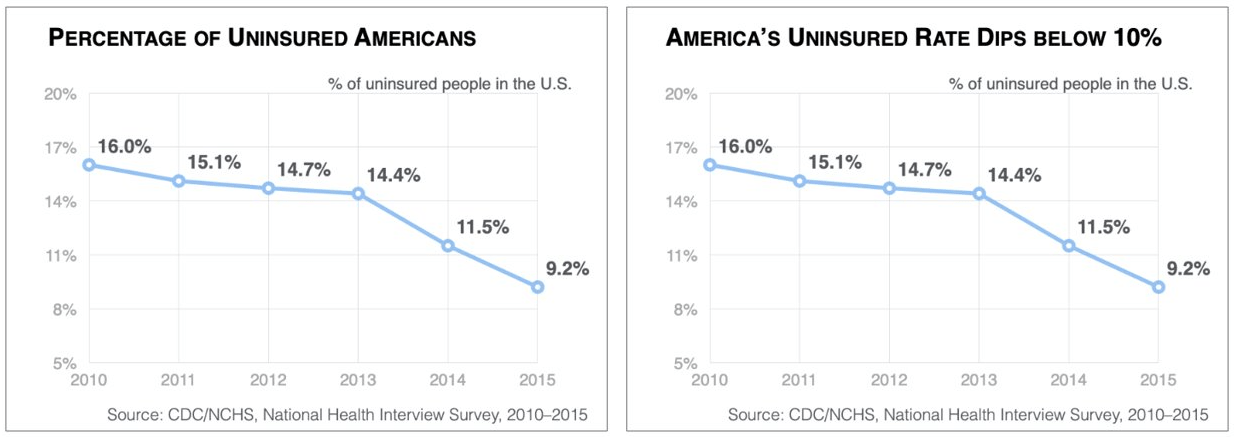
Eye Candy
Eye Candy
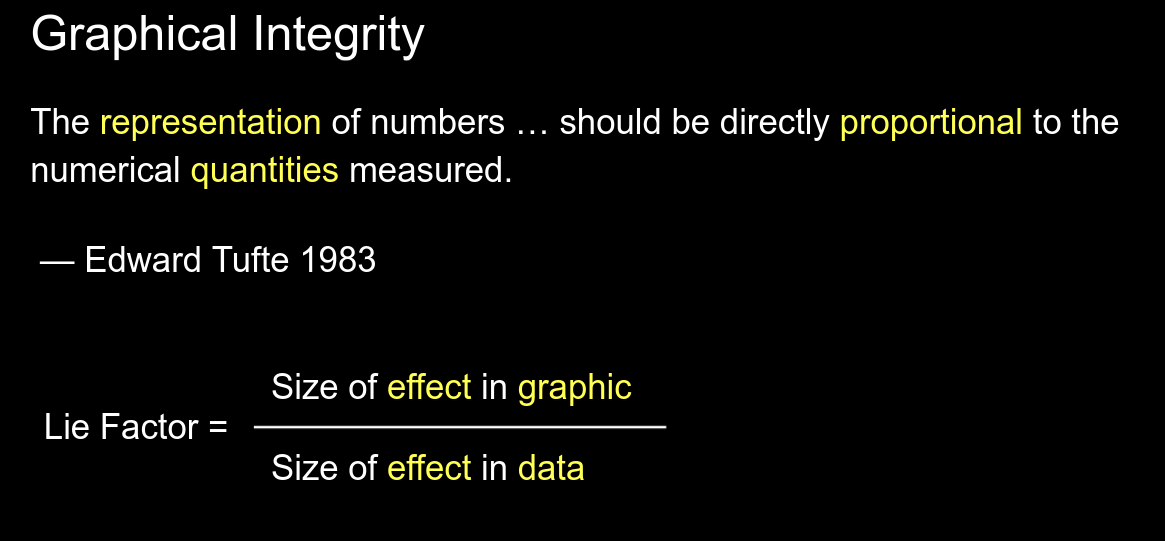
Tufte: Data-Ink Ratio
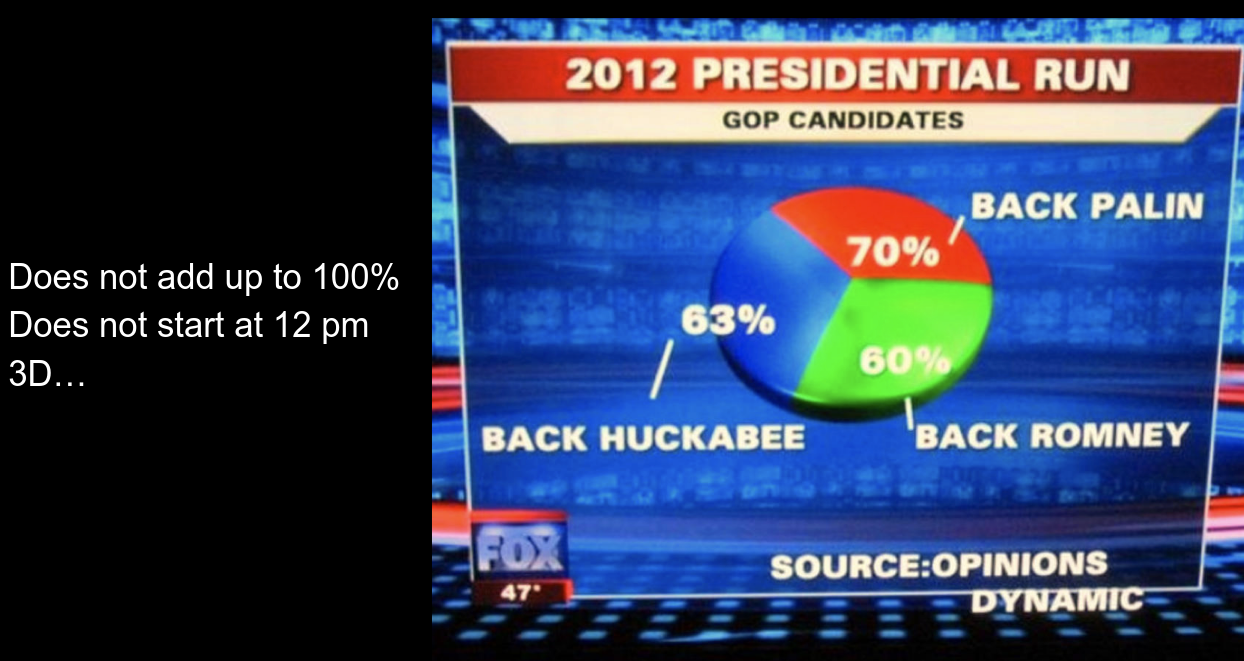
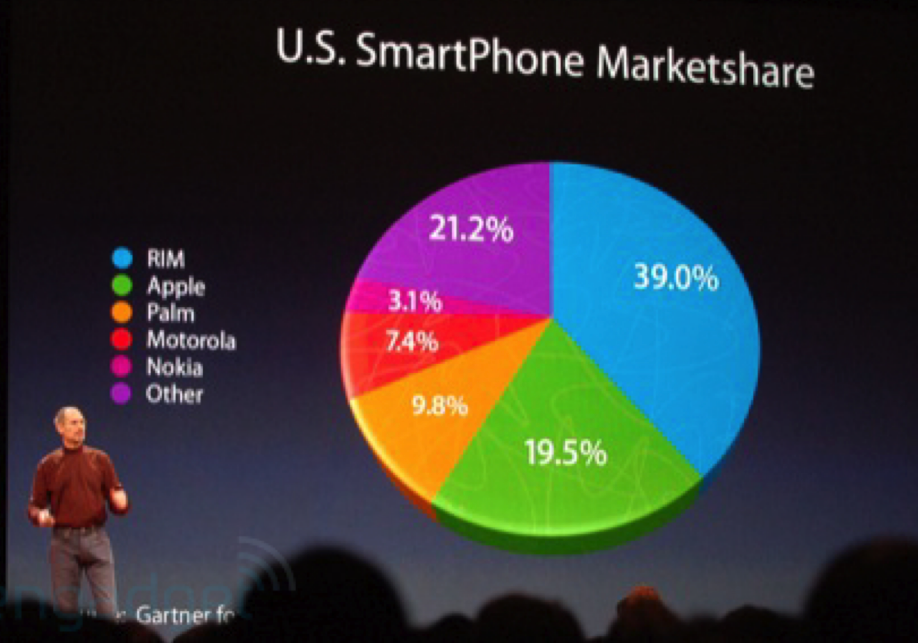
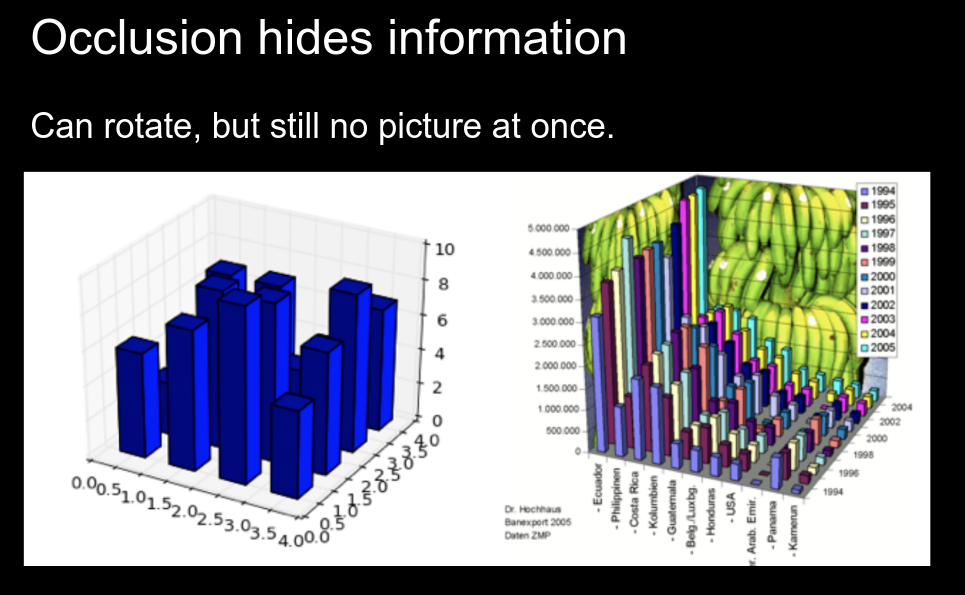
let's look at some examples...
more next time!
Homework
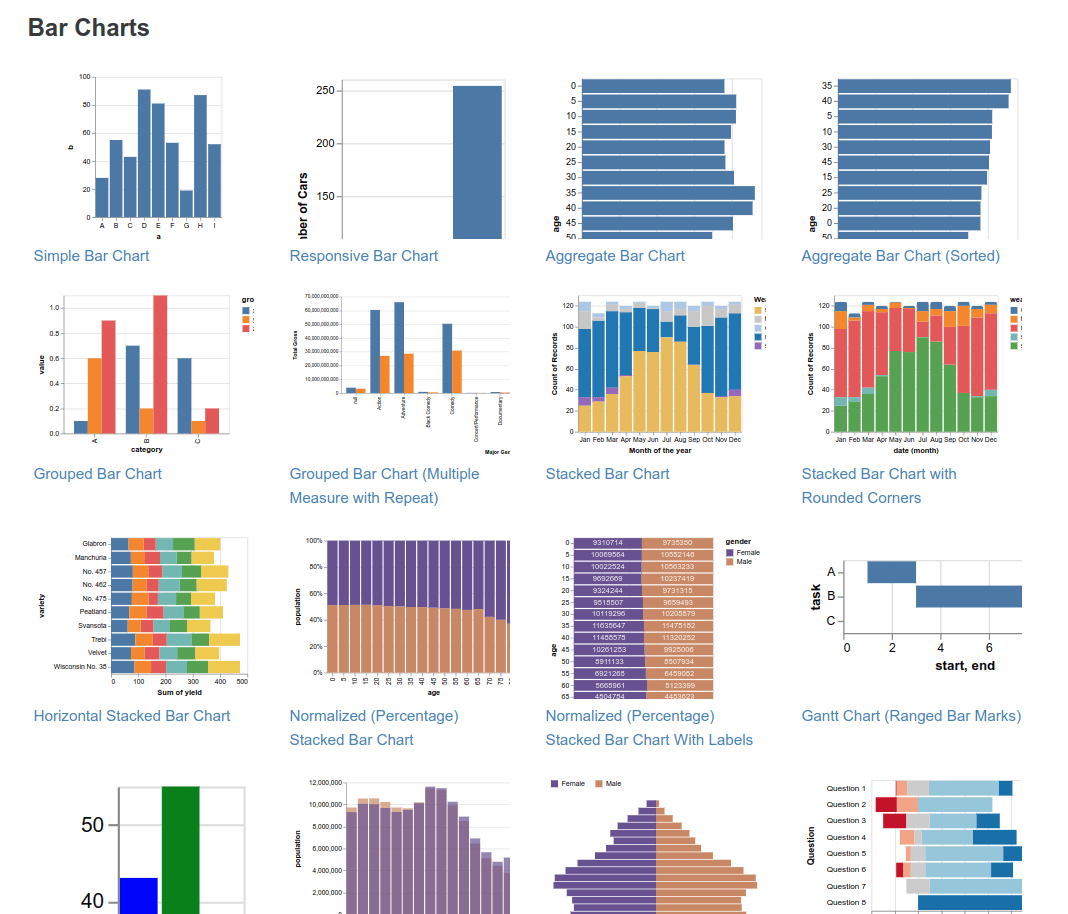
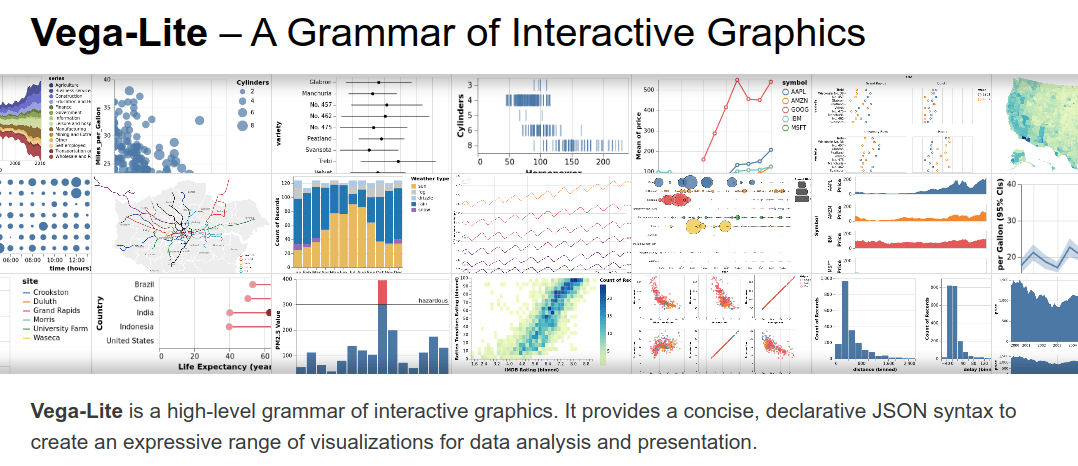
Check out Vega-Lite !
By Daniel Haehn
Slides for CS617 VISUALIZING.BOSTON - See https://cs617.orghttps://cs617.org


