


Daniel Haehn PRO
Hi, I am a biomedical imaging and visualization researcher who investigates how computational methods can accelerate biological and medical research.
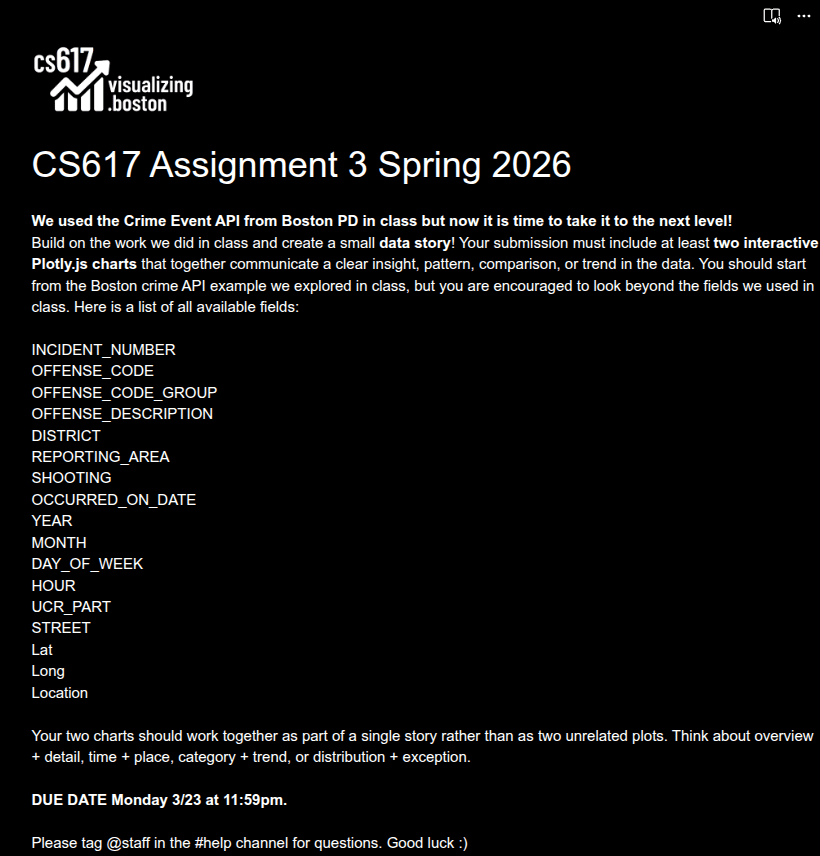
3/23!
Thank you!!
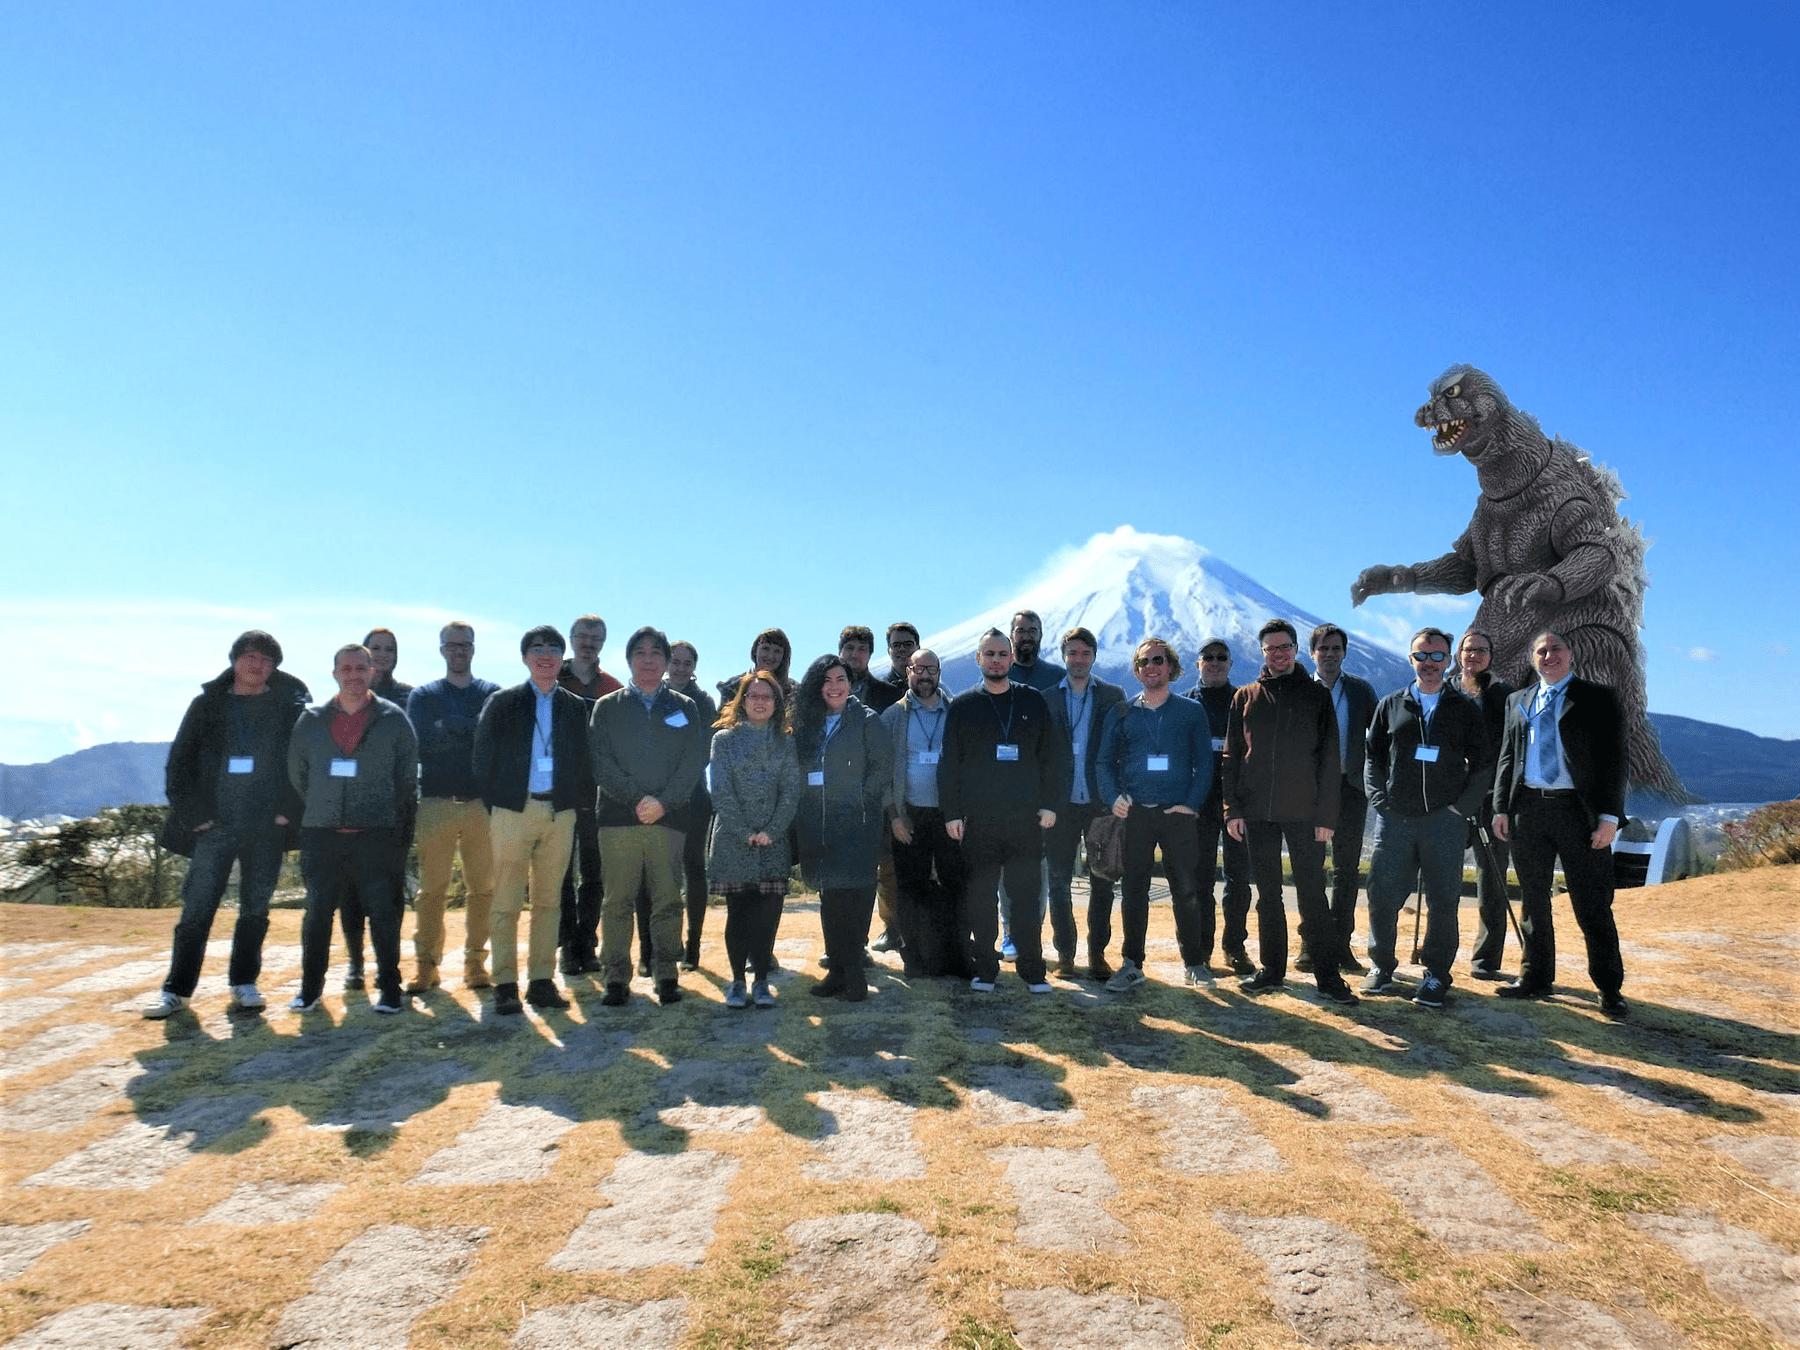
Welcome, Martin!
Fritz Lekschas
Today via Zoom!
Homework
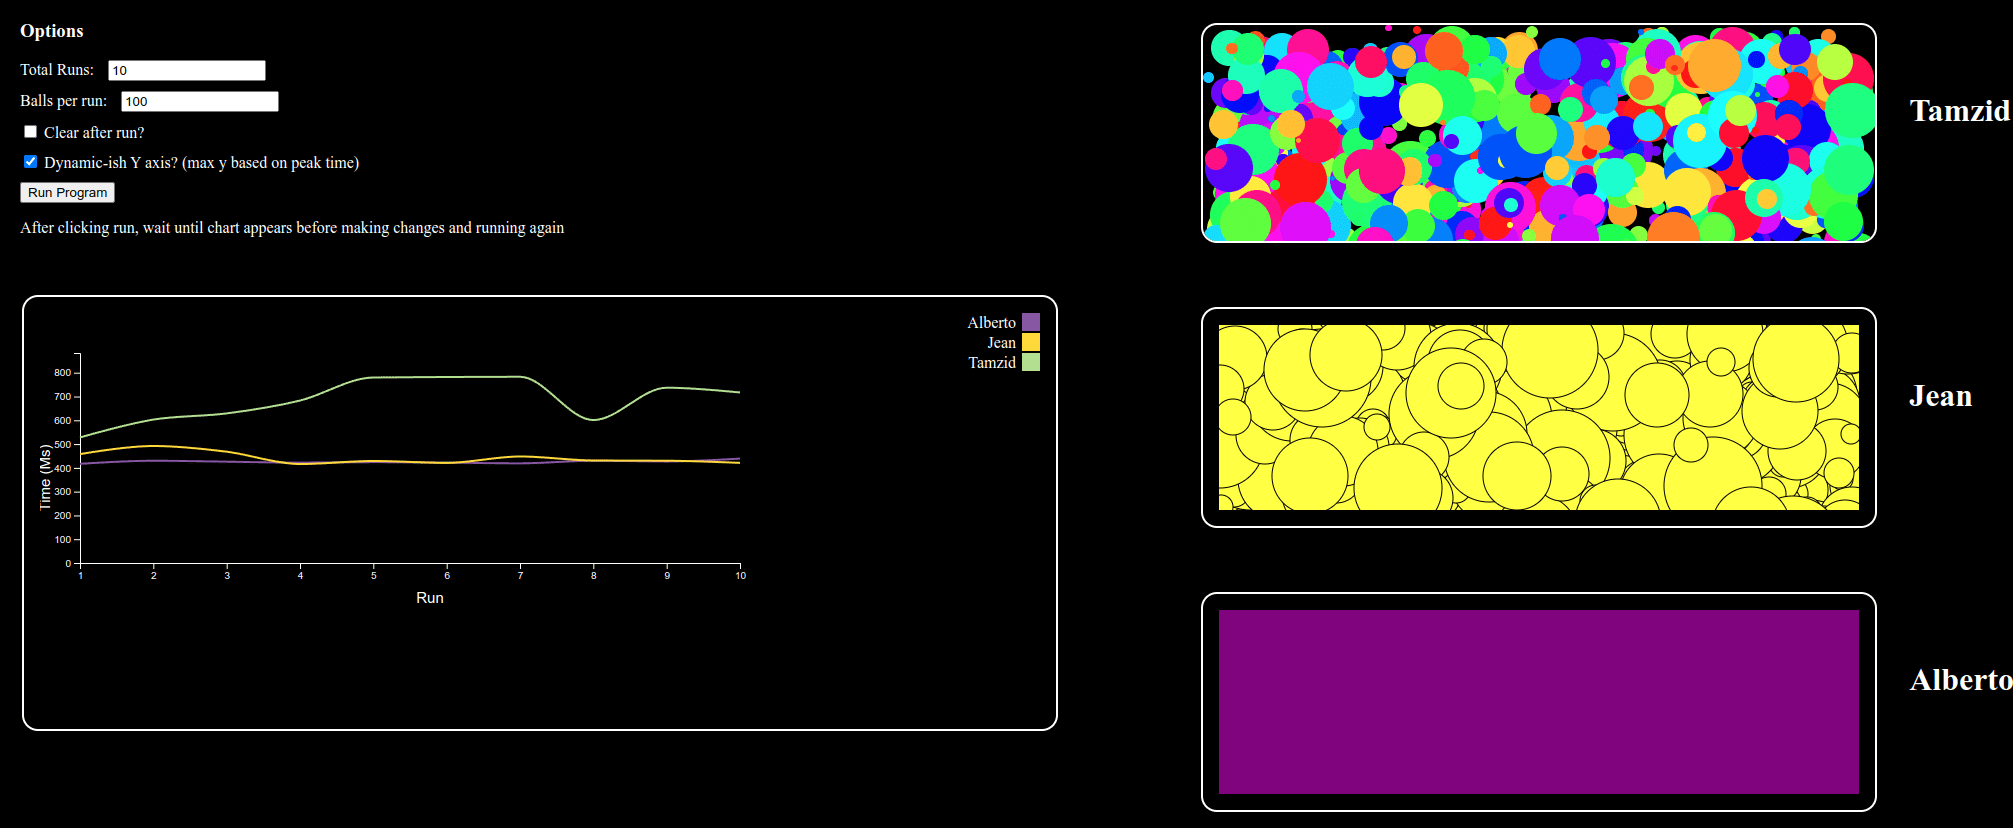
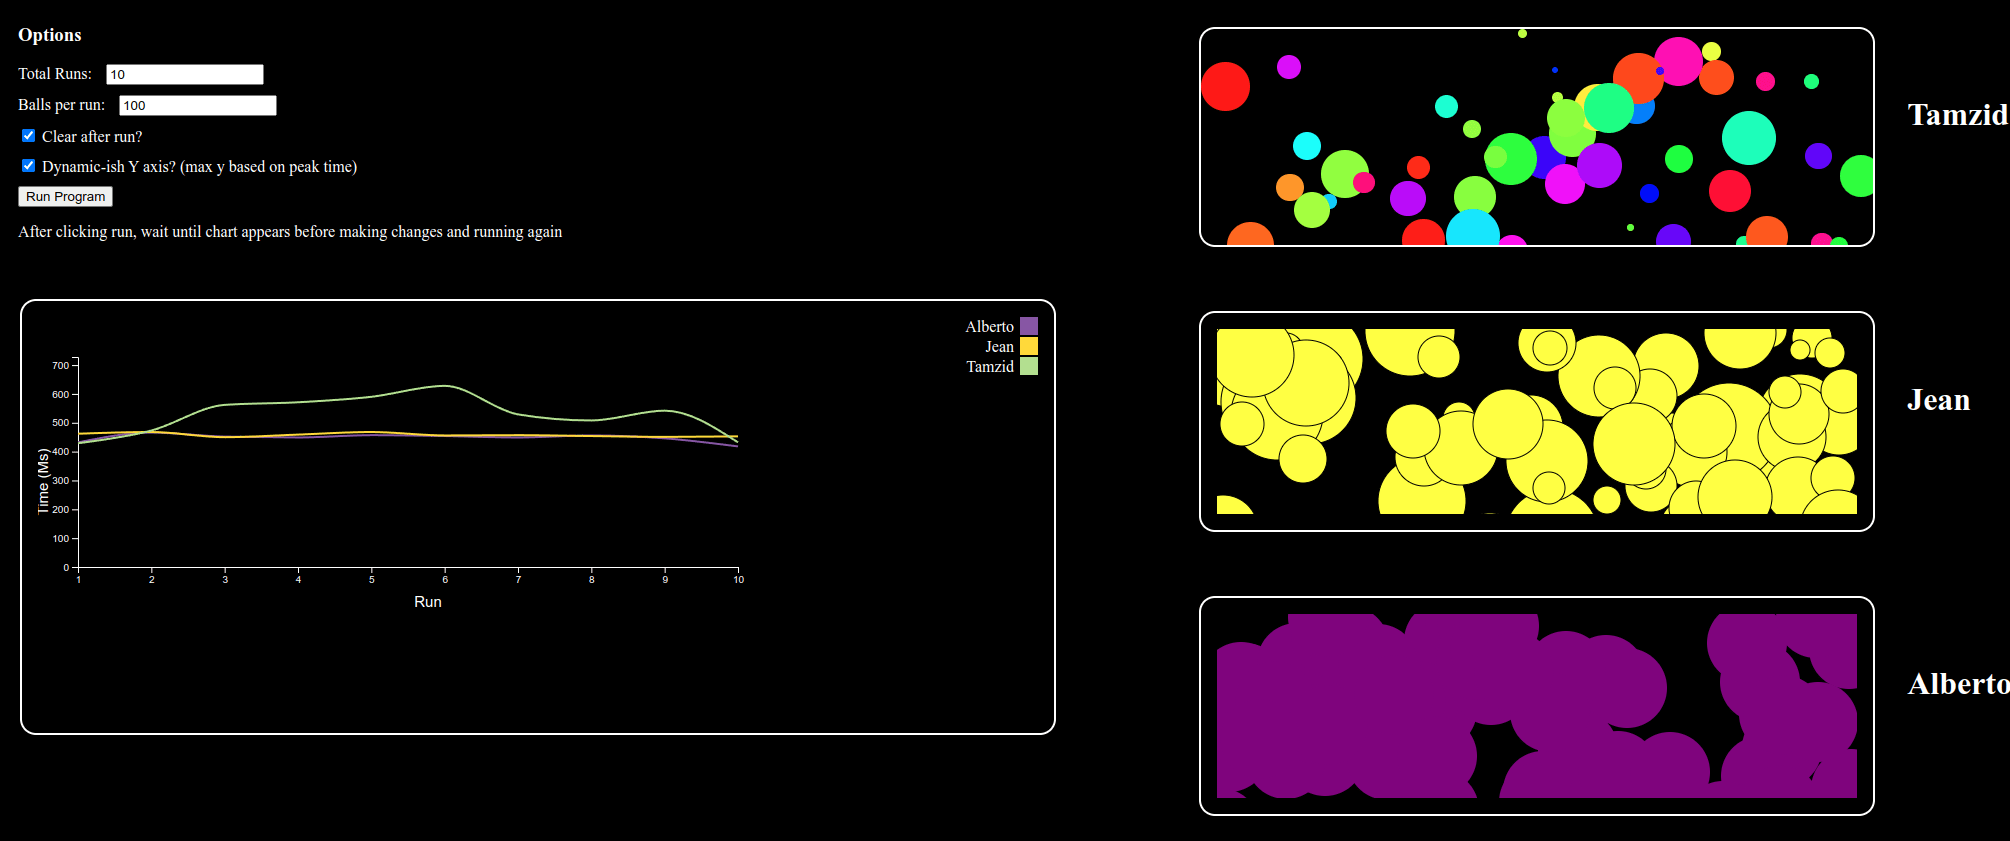
Create a new circle every second until 100 randomly positioned circles are on the screen with D3!
???
Homework
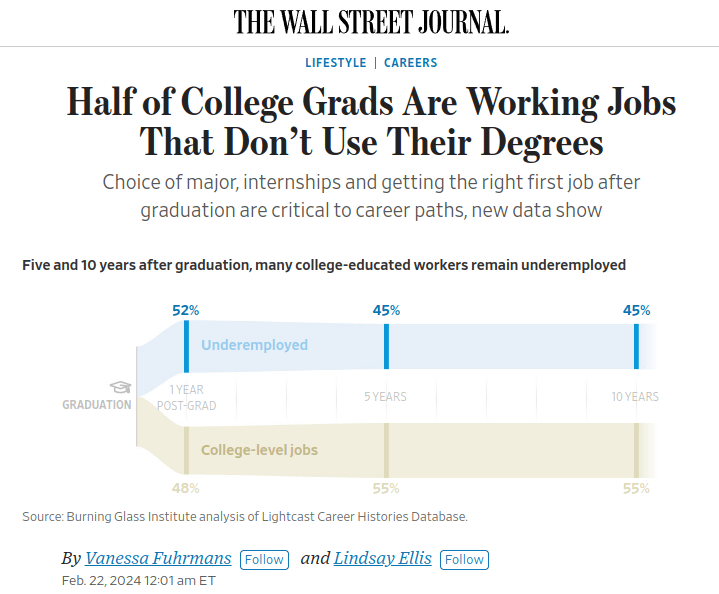
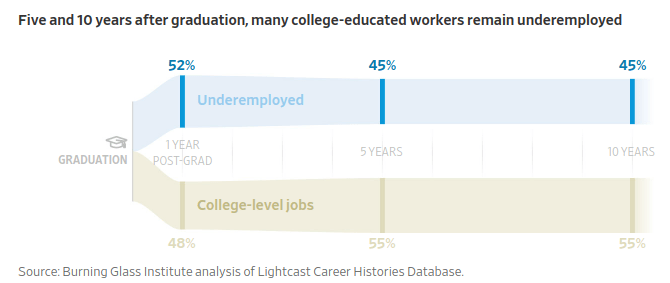
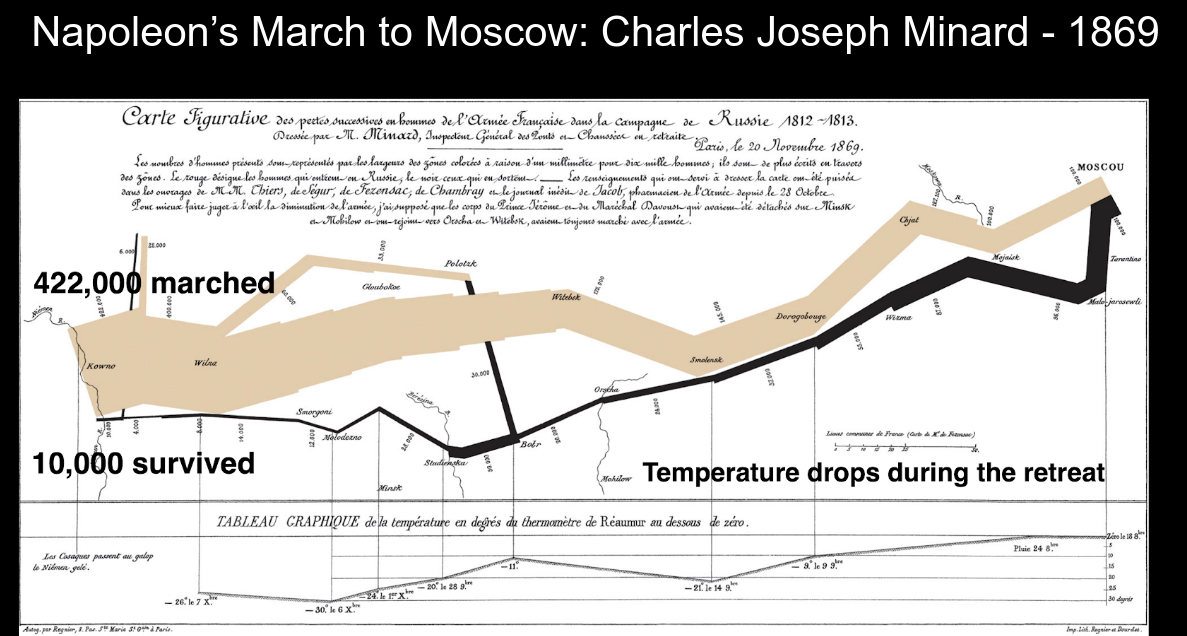
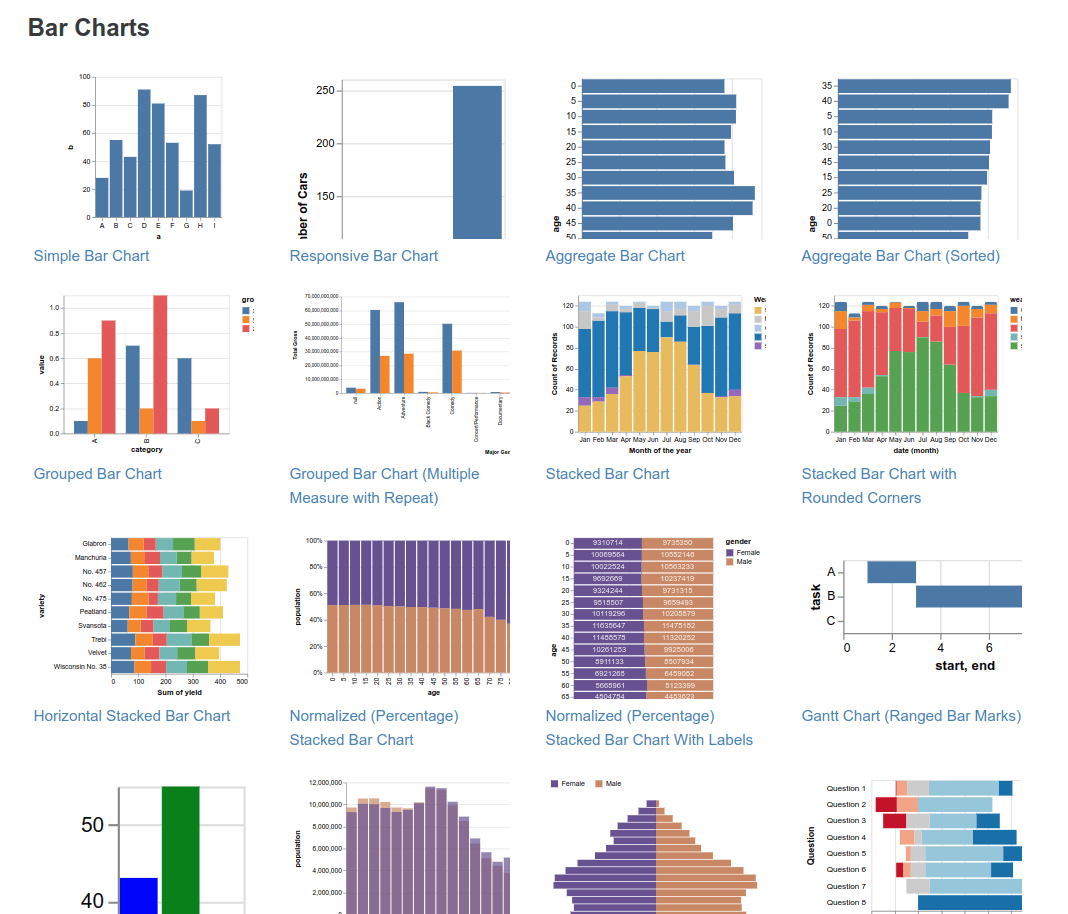
Sankey Diagram
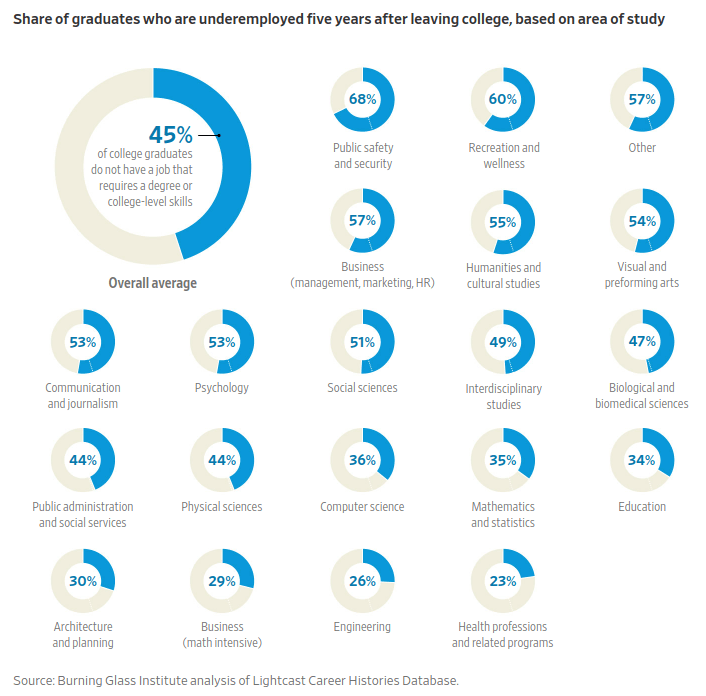
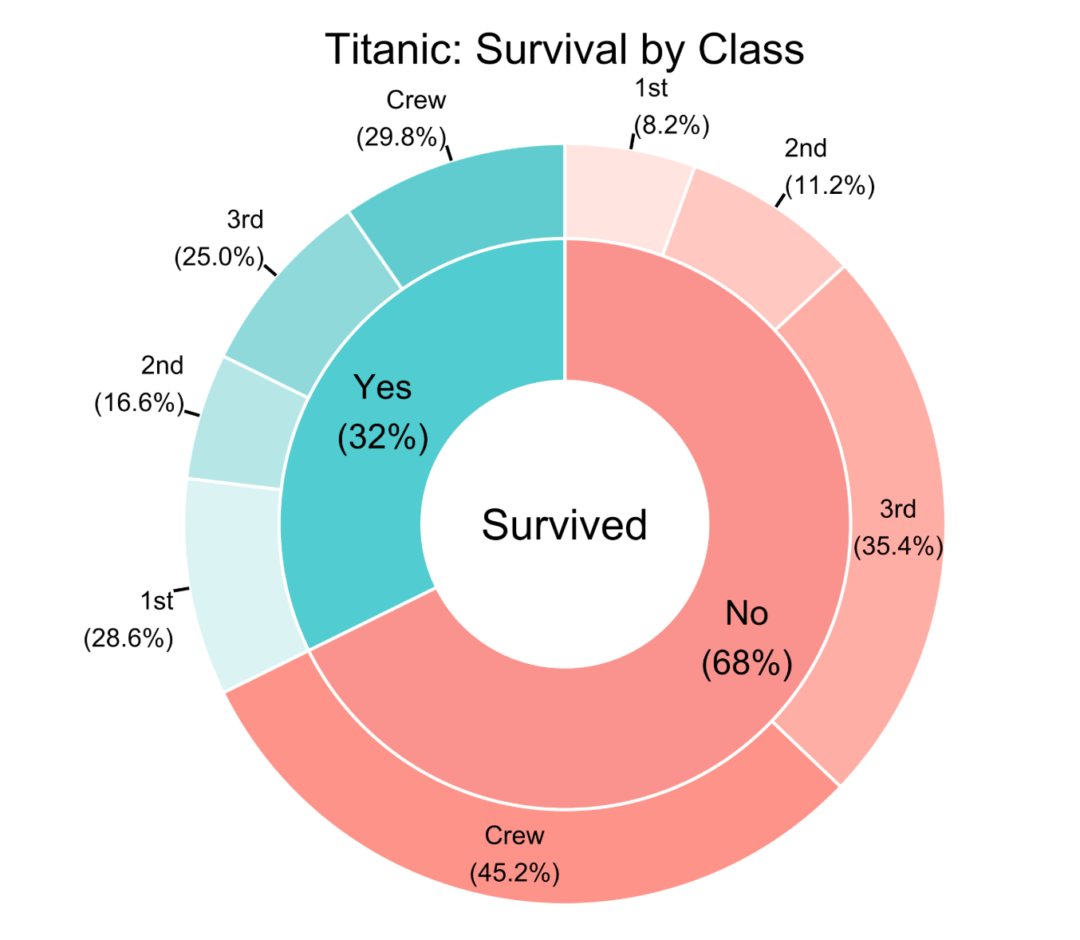
Donut Chart
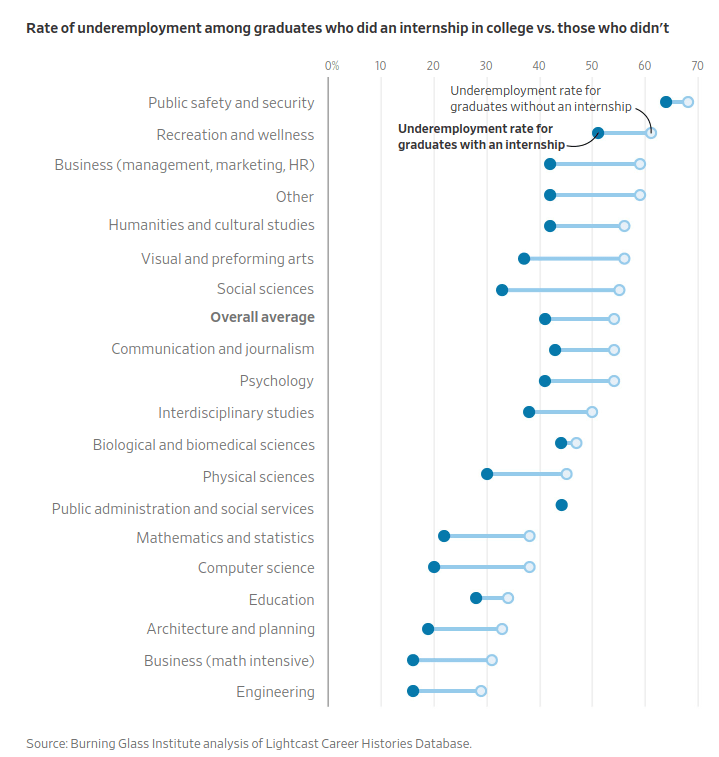
Dumbell Plot
Connected Dot Plot
Ranged Dot Plot
Horizontal Range
Min-Max Plot
Homework
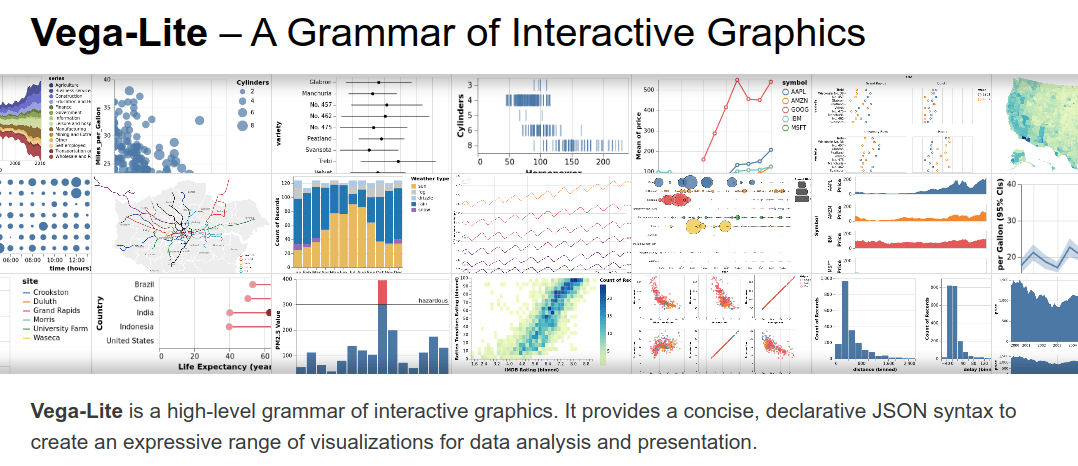
Re-Create your assignment 3 submission with Vega-Lite!
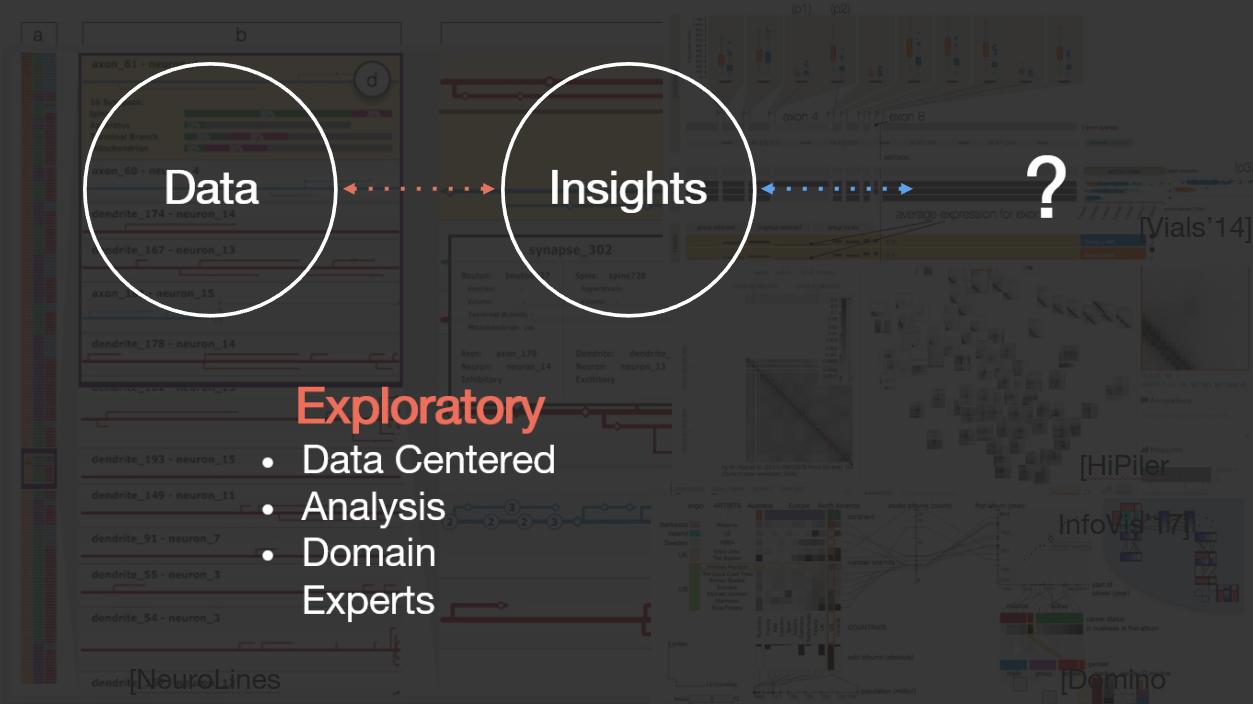
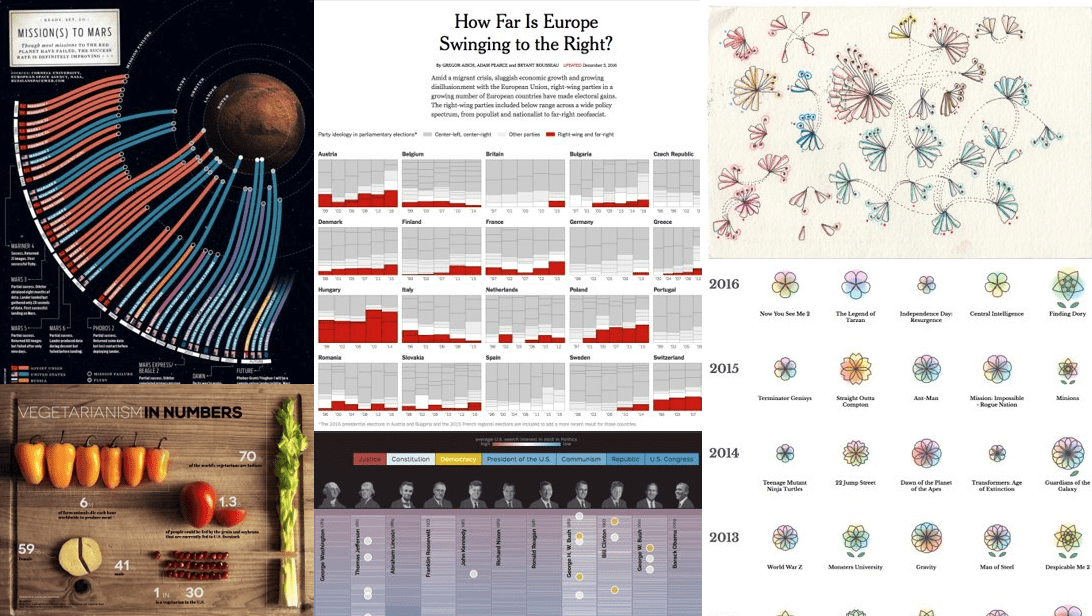
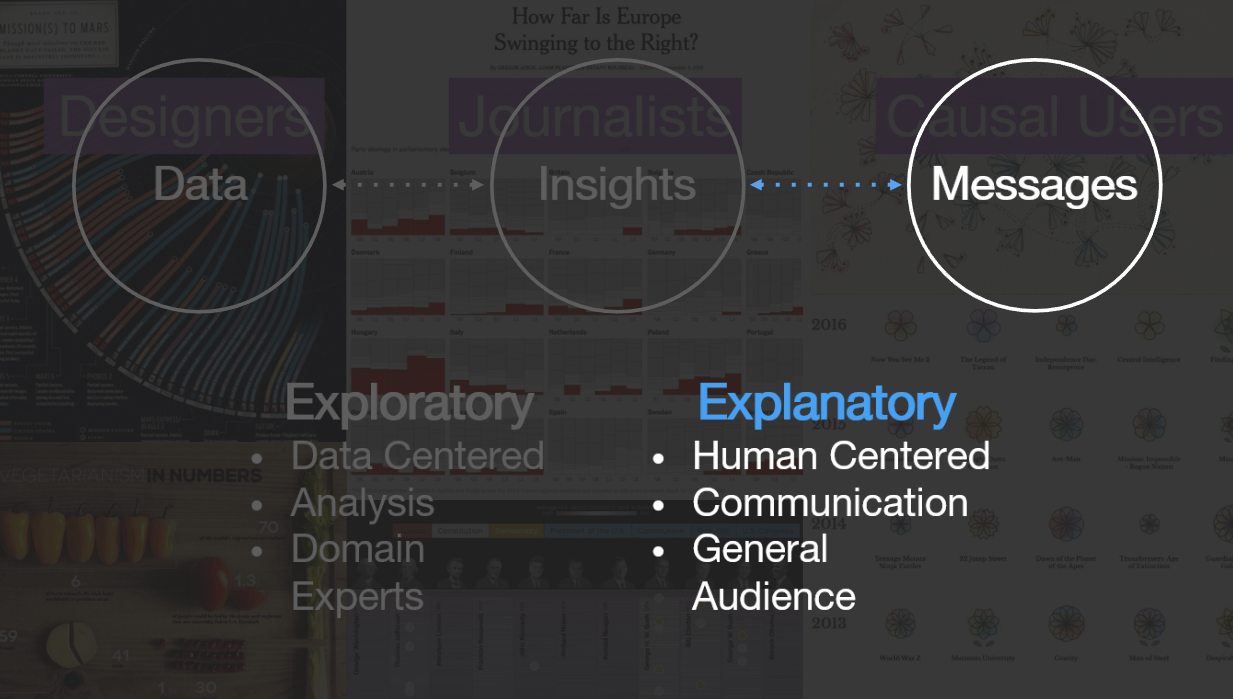
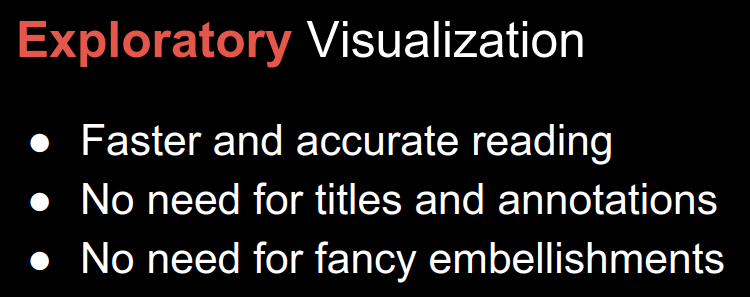
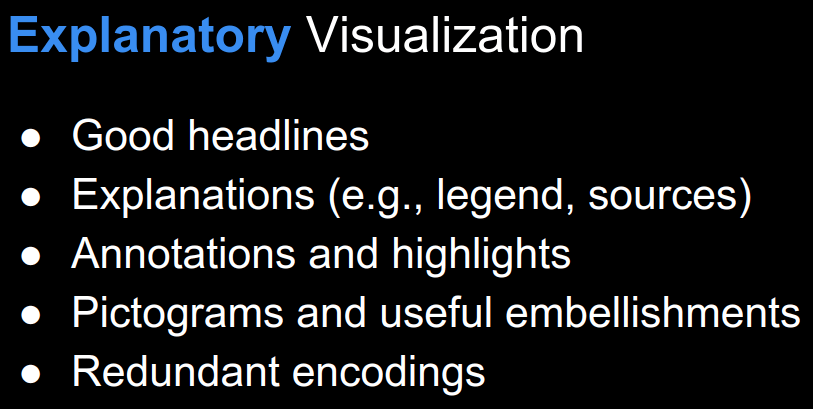
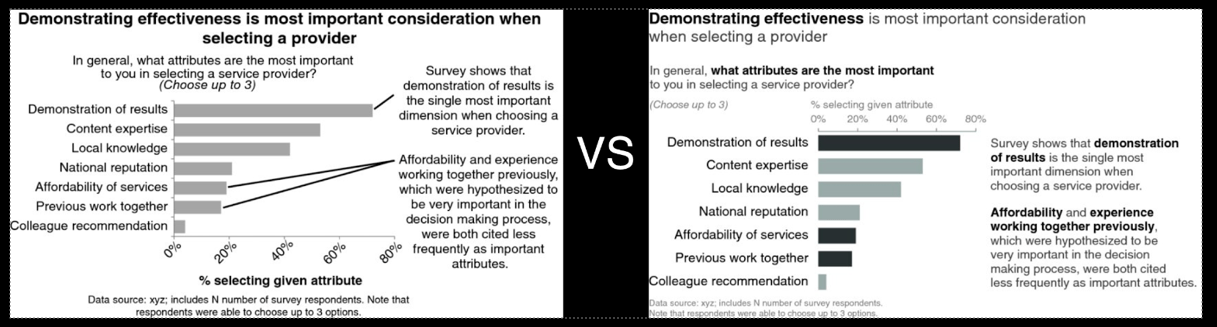
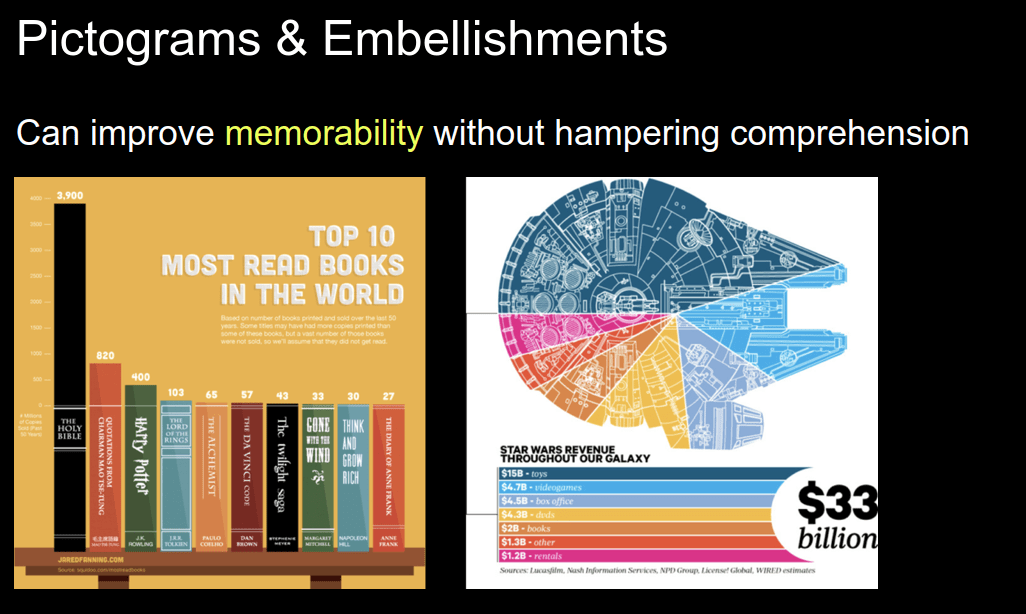
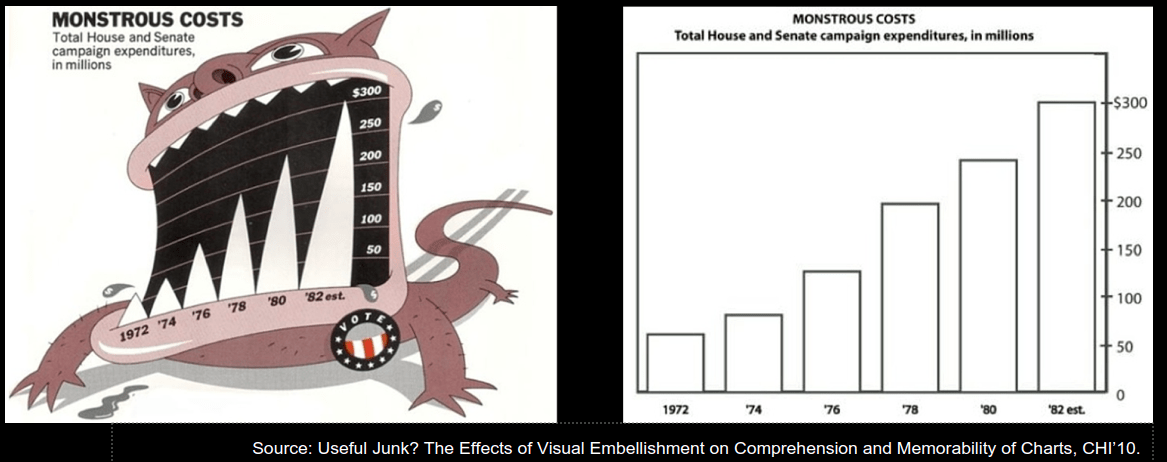
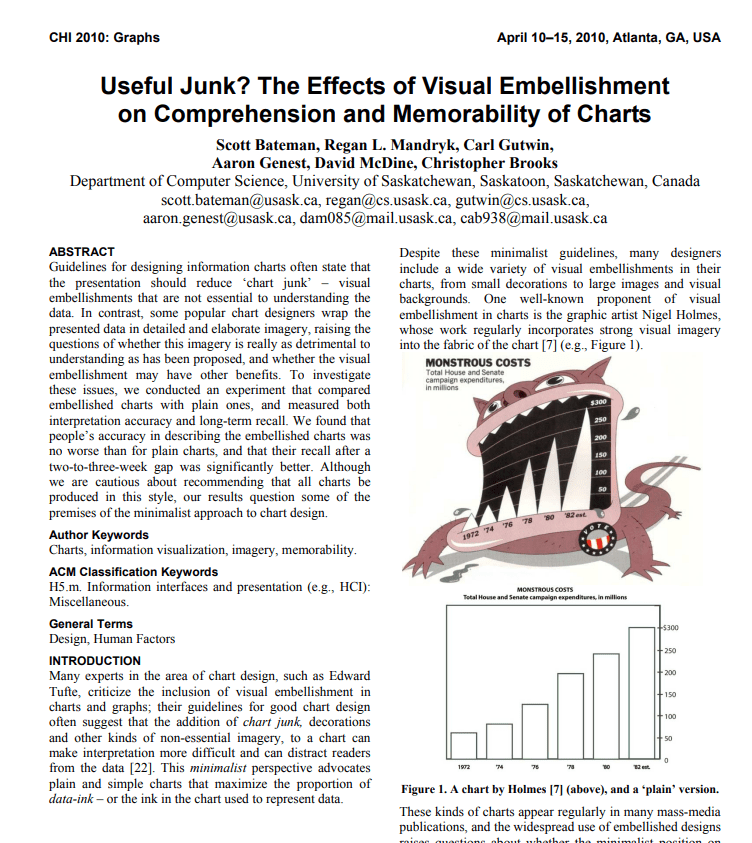
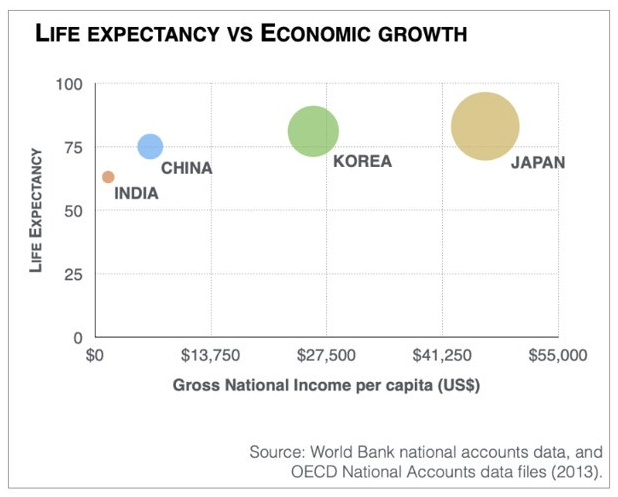
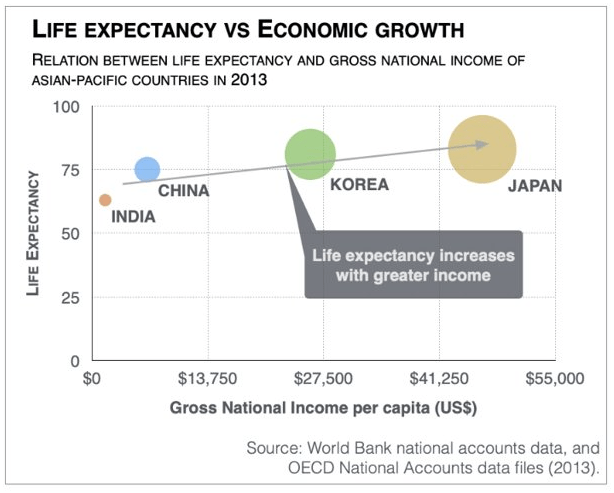
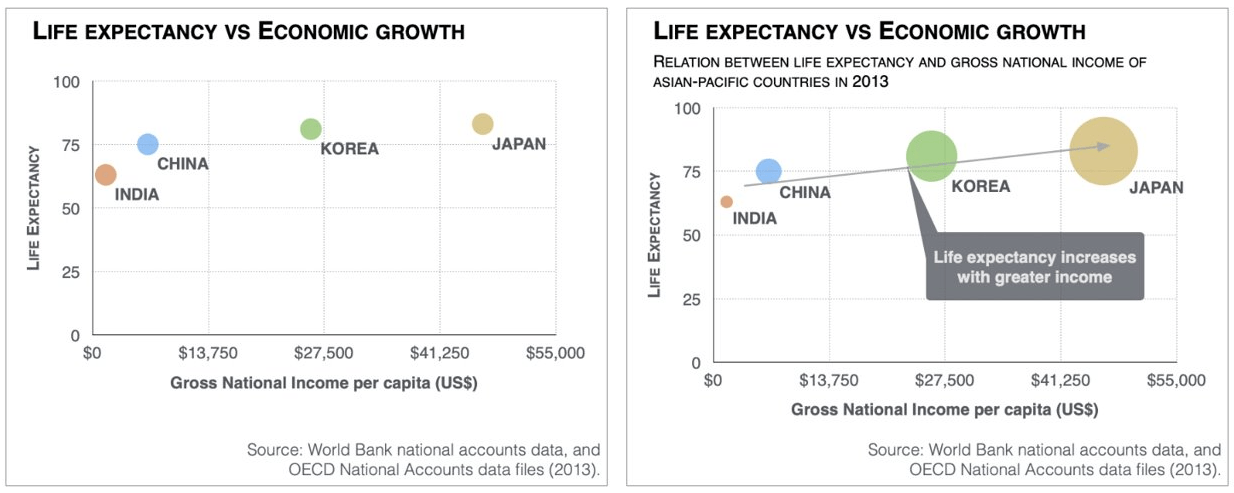
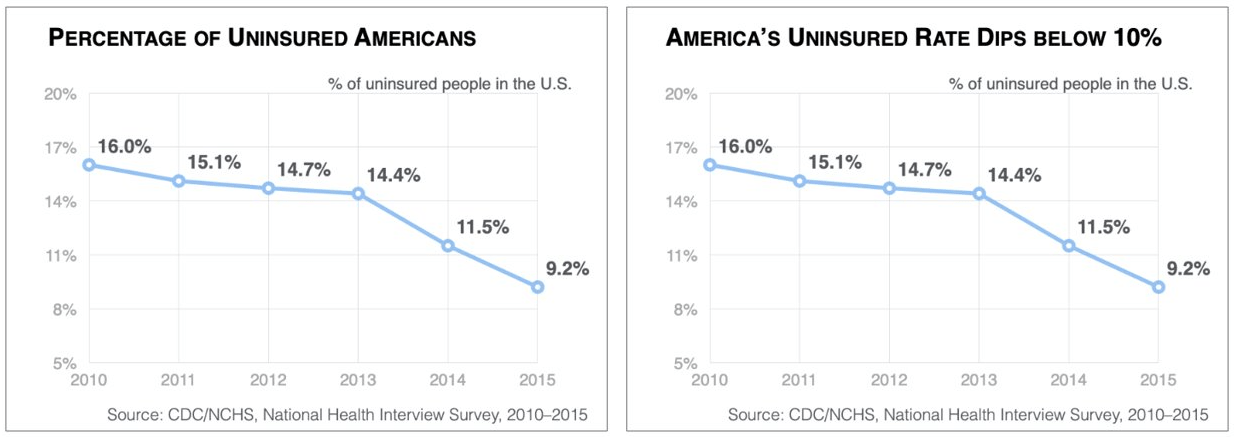
Eye Candy
Eye Candy
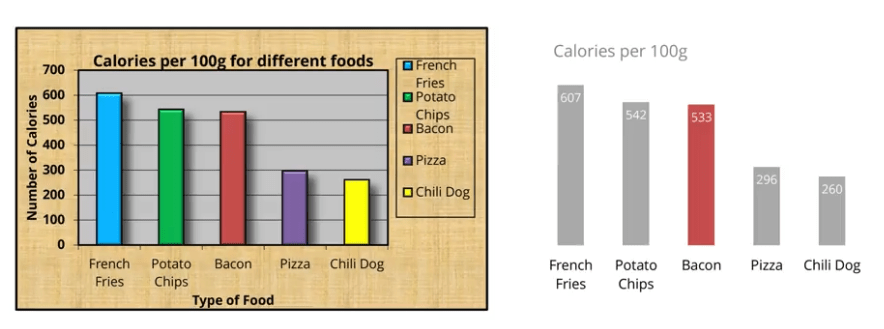
Tufte: Data-Ink Ratio
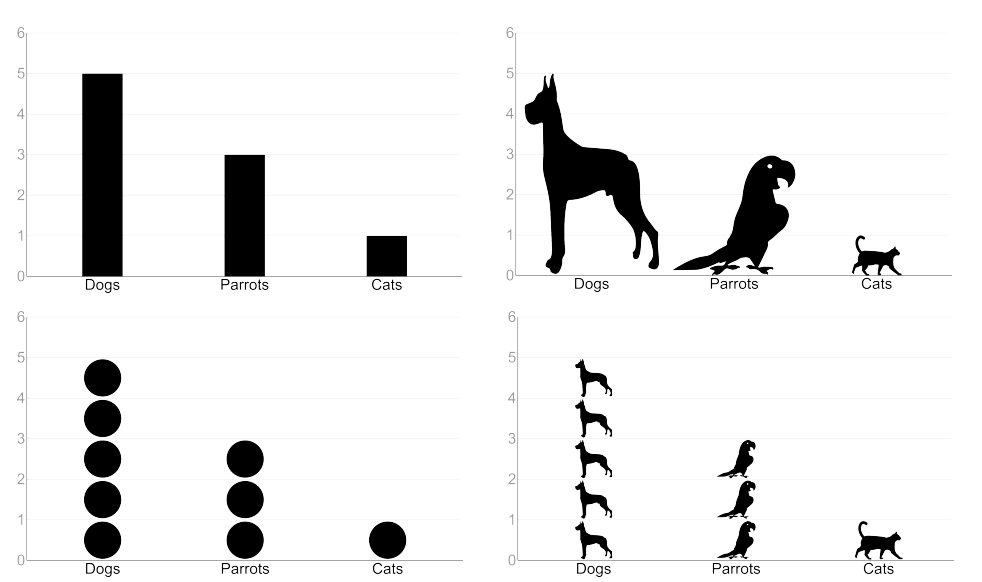
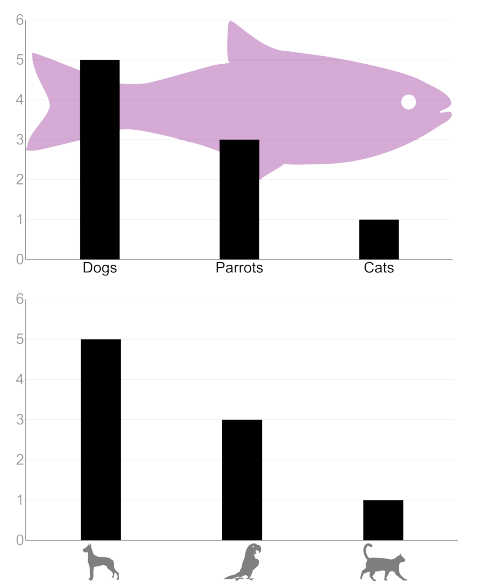
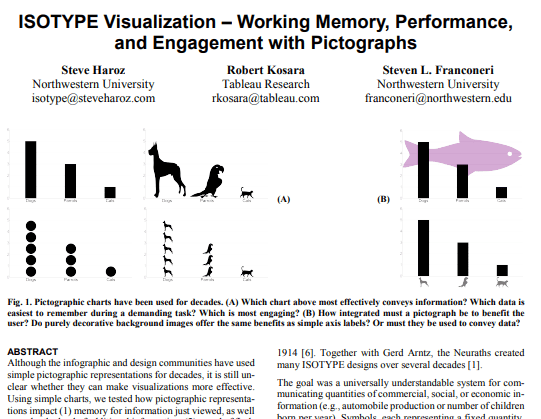
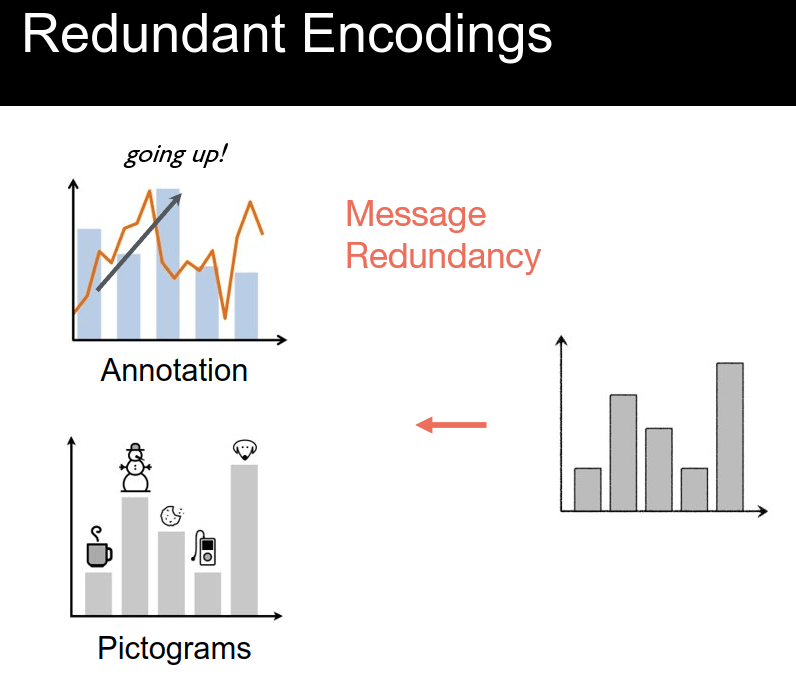
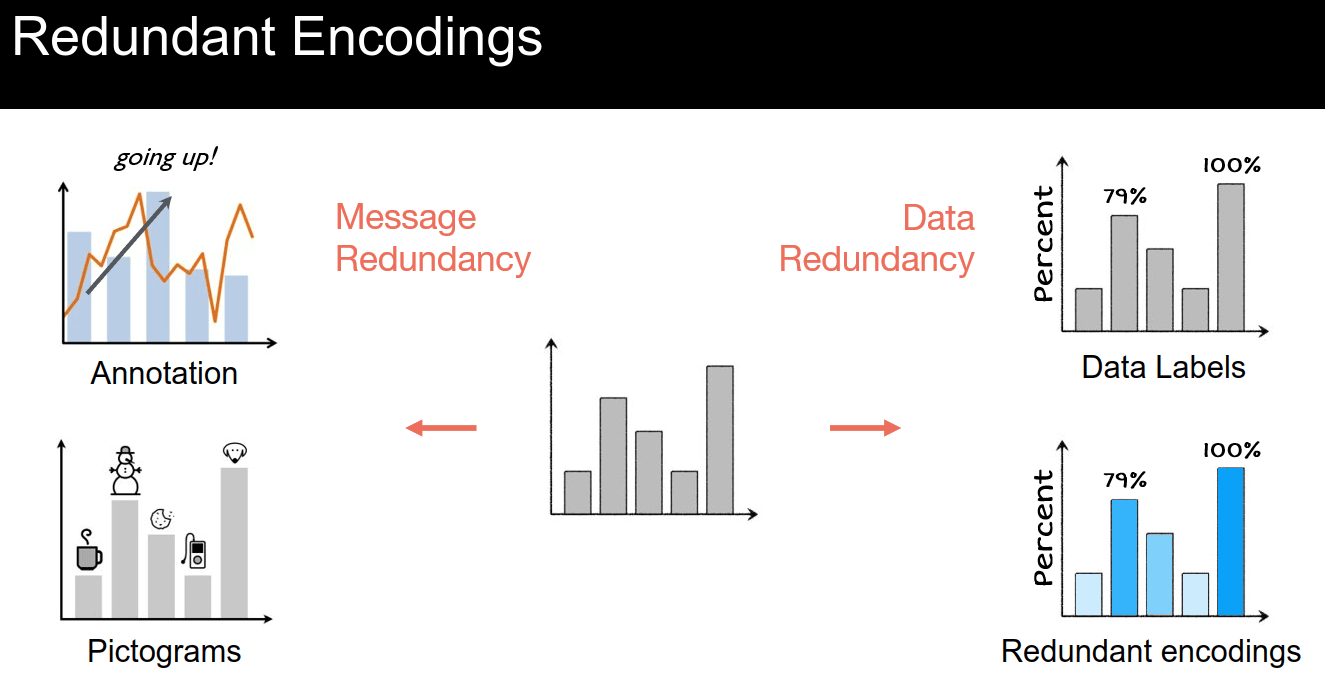
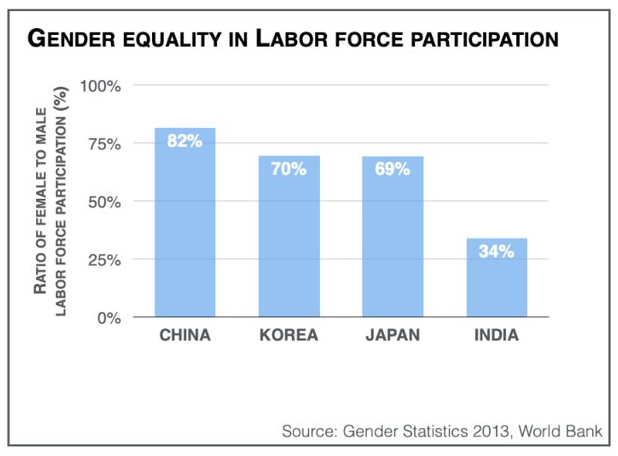
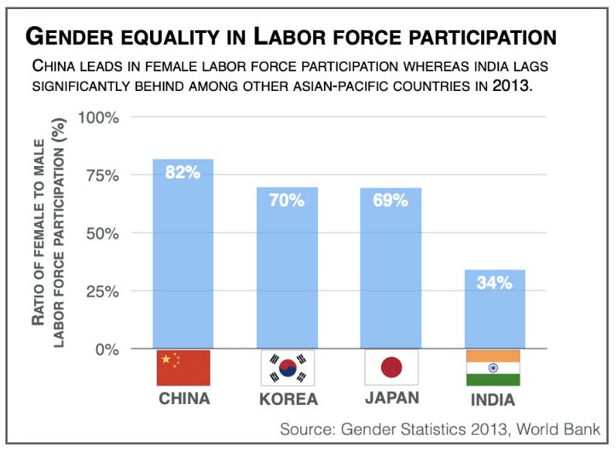
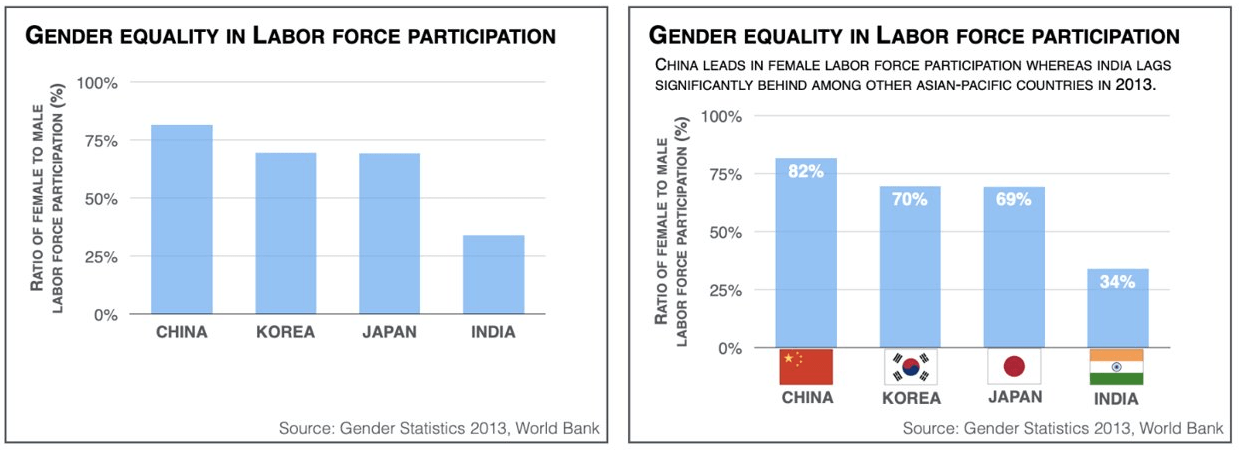
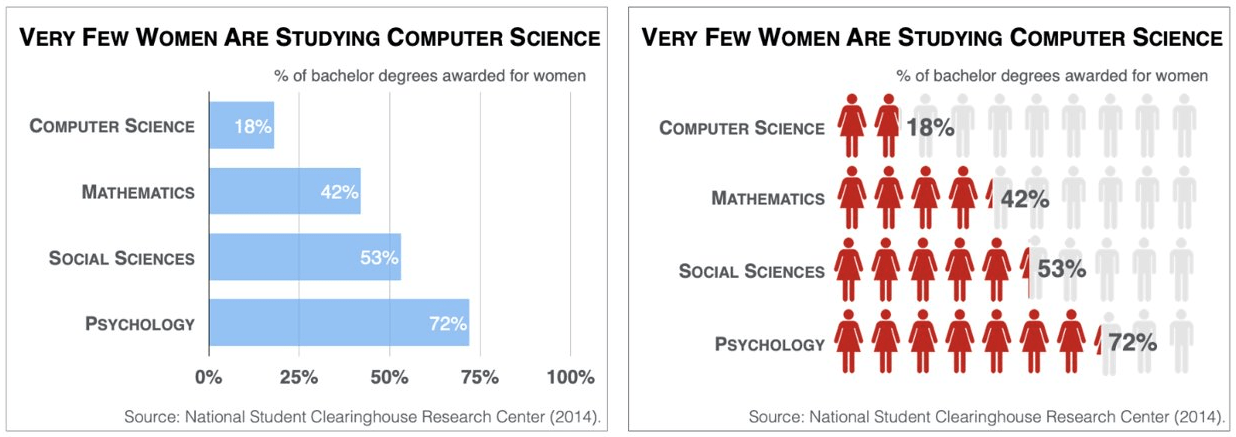
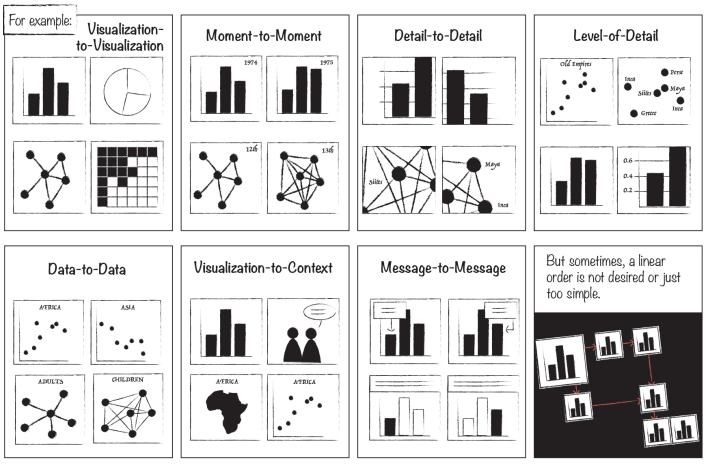
Pictographs / Icons
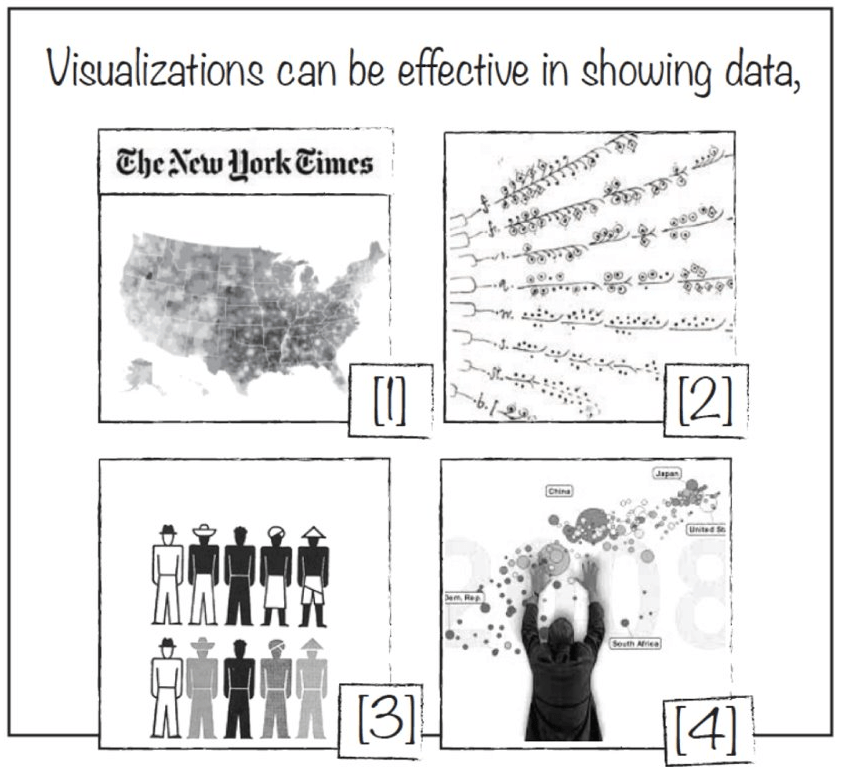
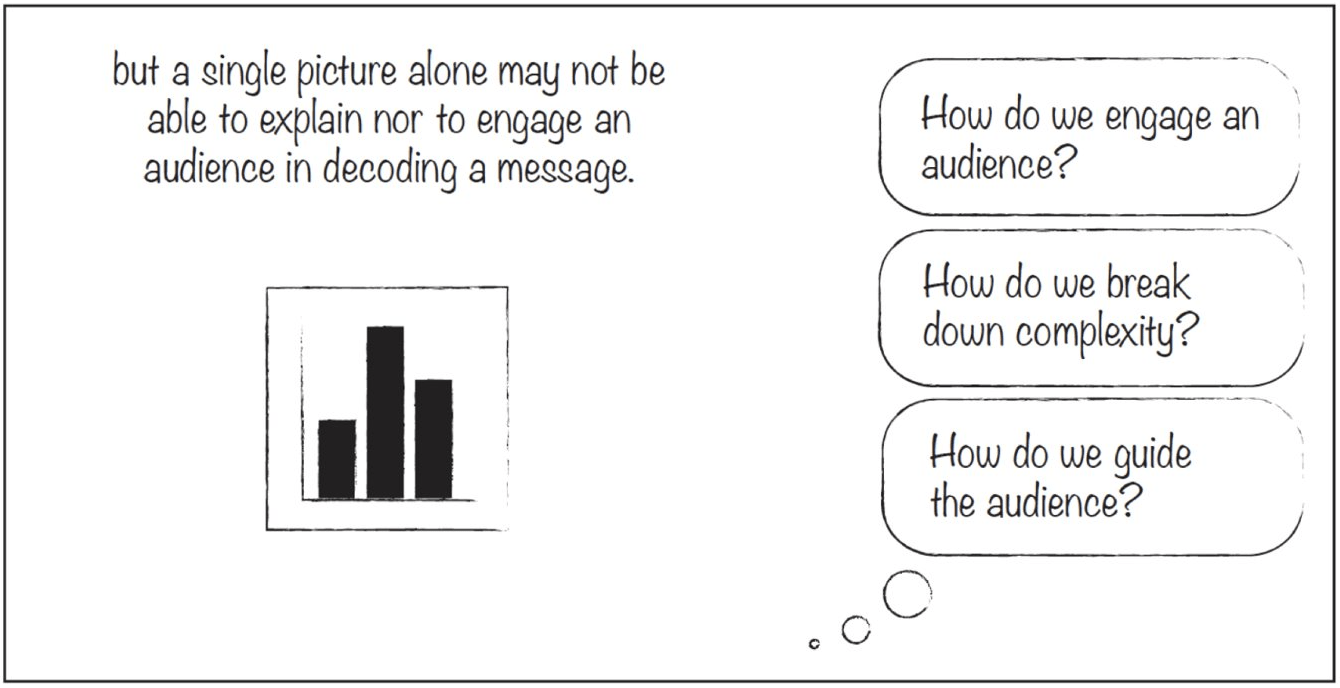
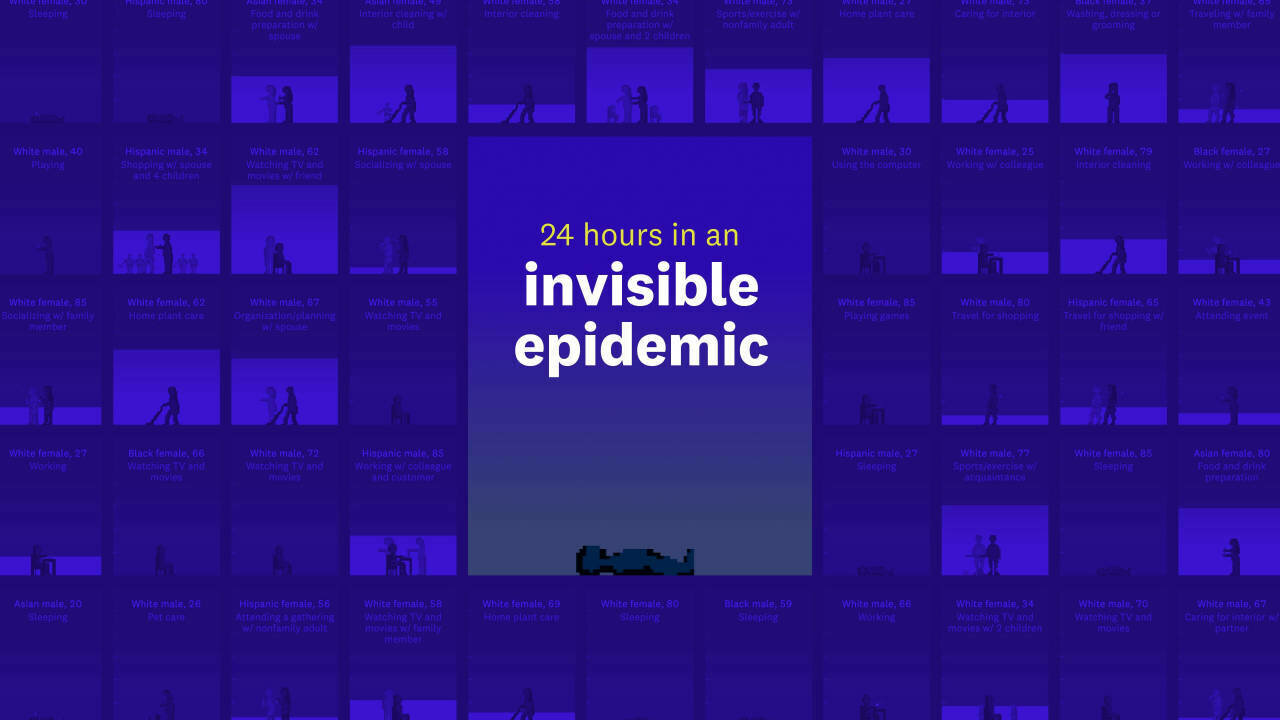
let's look at some examples...
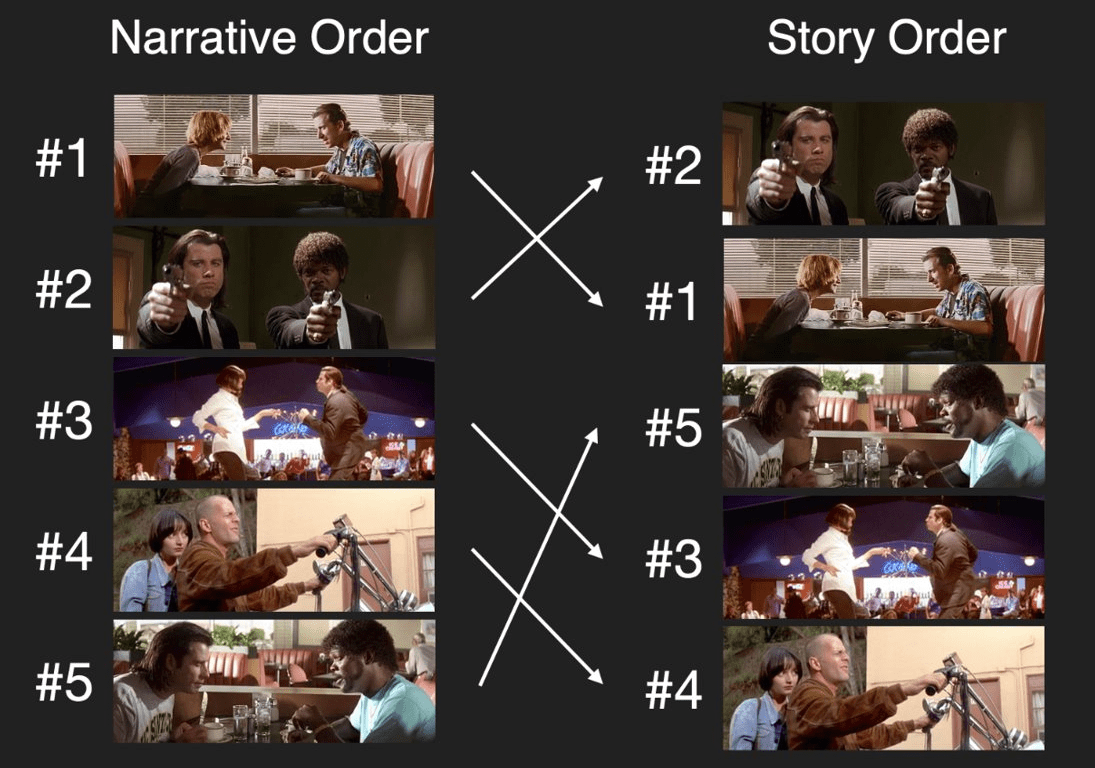
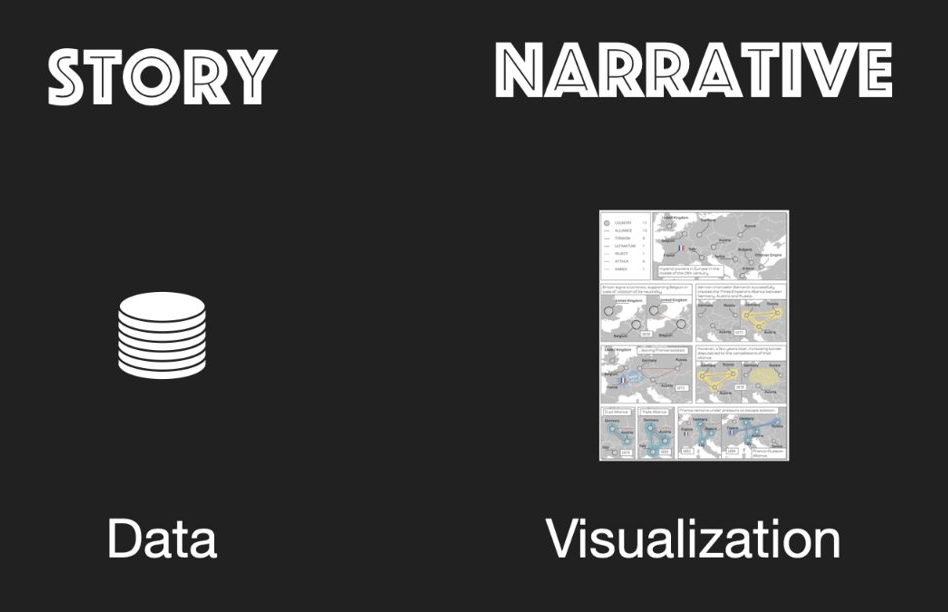
Transitions
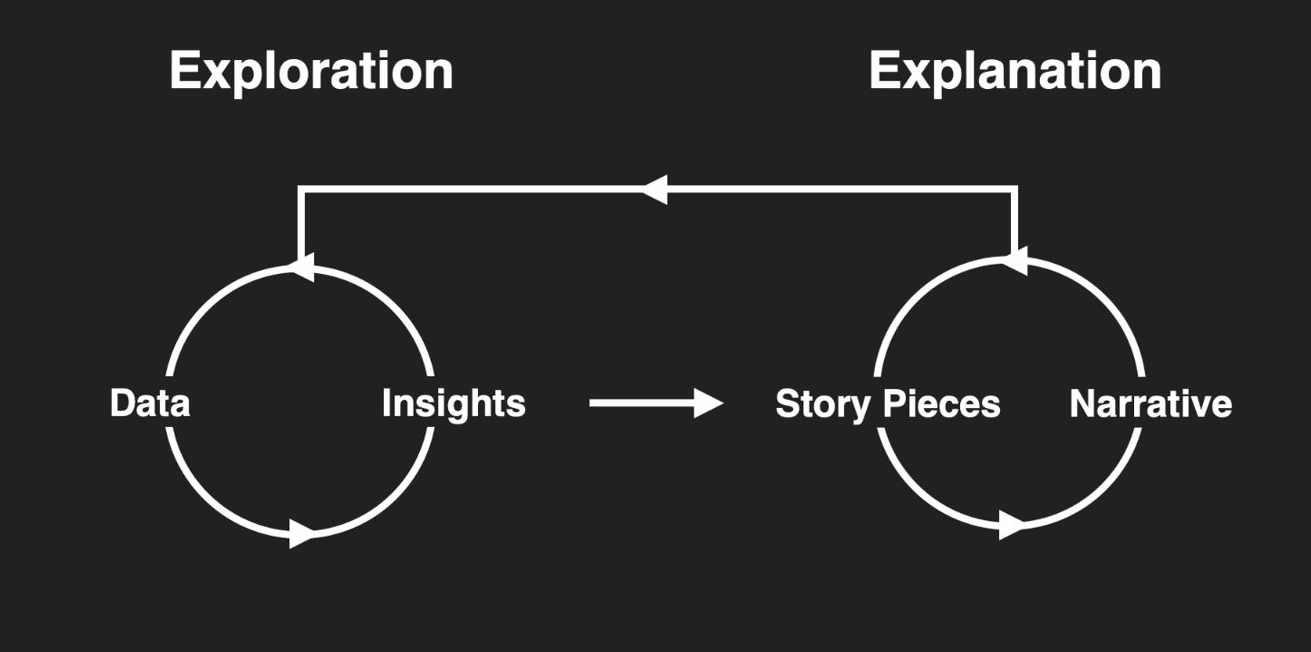
to break down the complexity
and progressively reveal different aspects
Style
Transitions
to break down the complexity
and progressively reveal different aspects
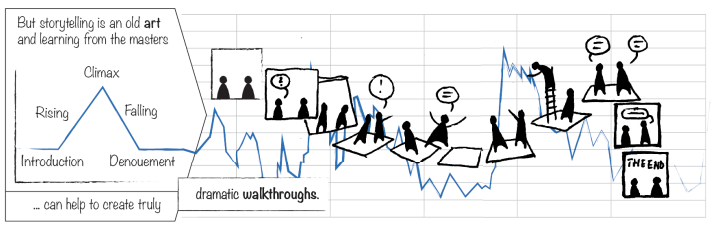
Freytag's Pyramid
Homework
By Daniel Haehn
Slides for CS617 VISUALIZING.BOSTON - See https://cs617.orghttps://cs617.org


