


Daniel Haehn PRO
Hi, I am a biomedical imaging and visualization researcher who investigates how computational methods can accelerate biological and medical research.
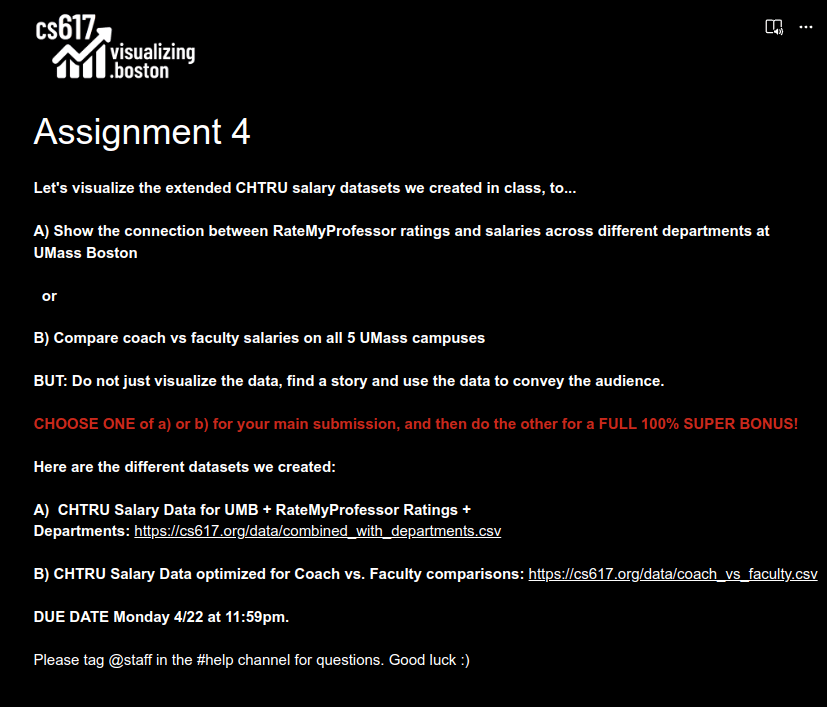
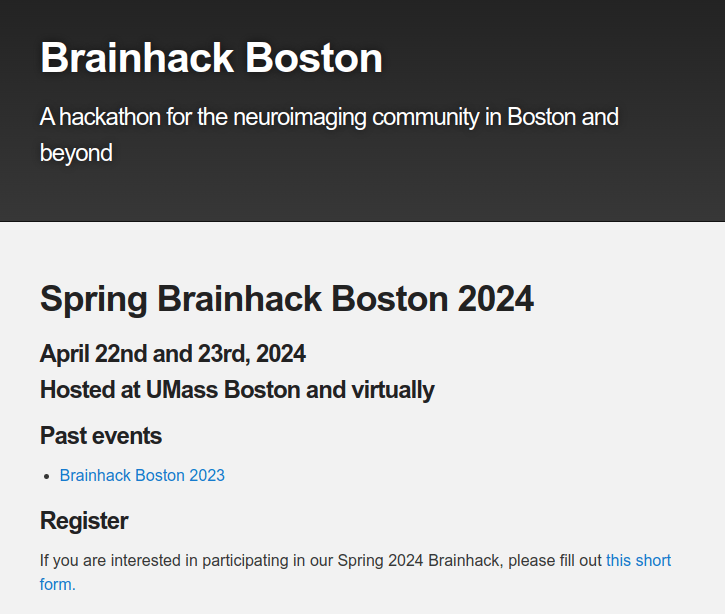
Due 4/22!
Today!
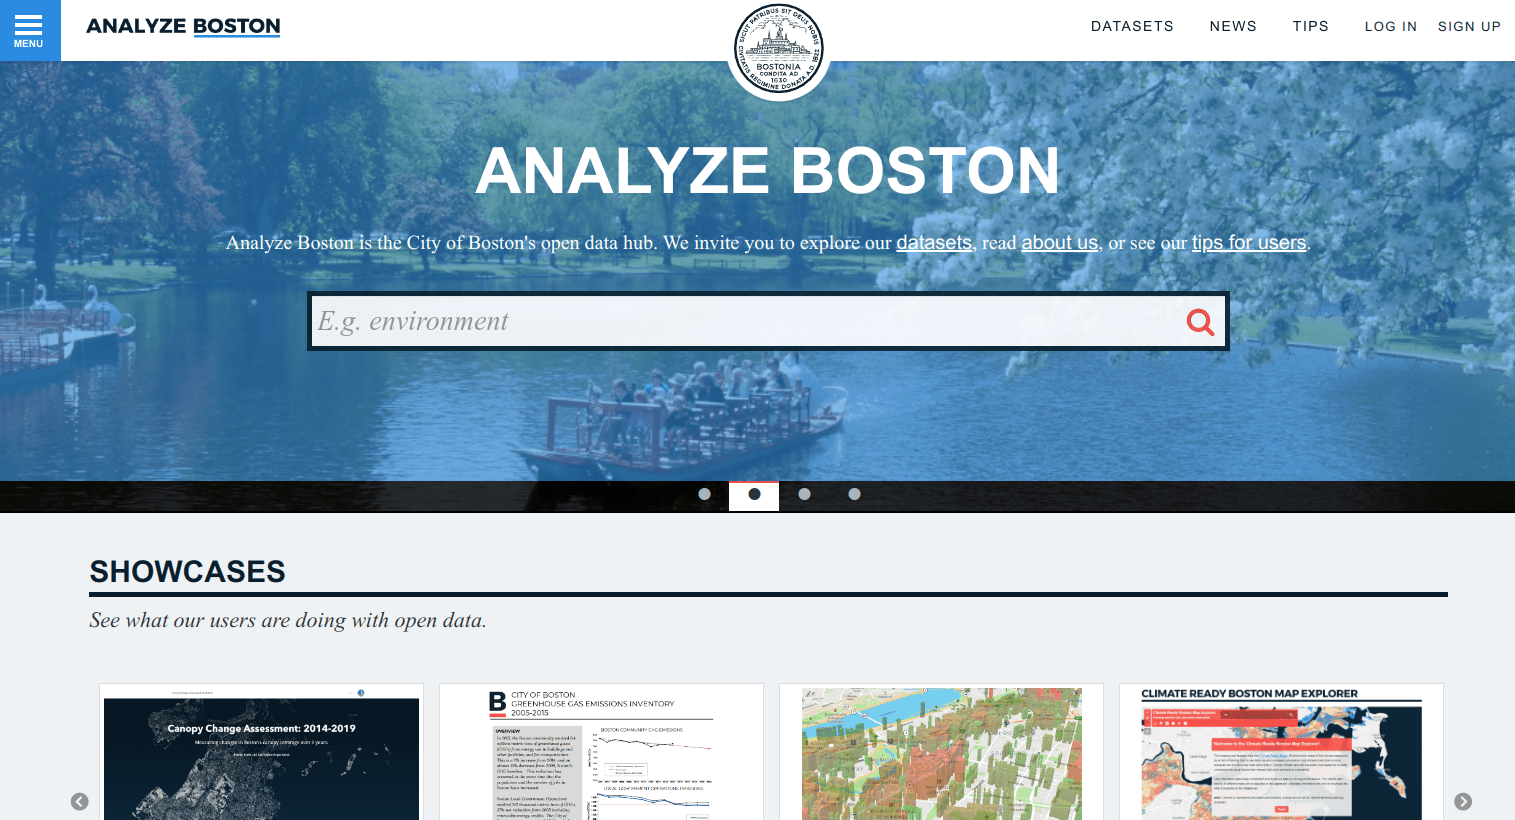
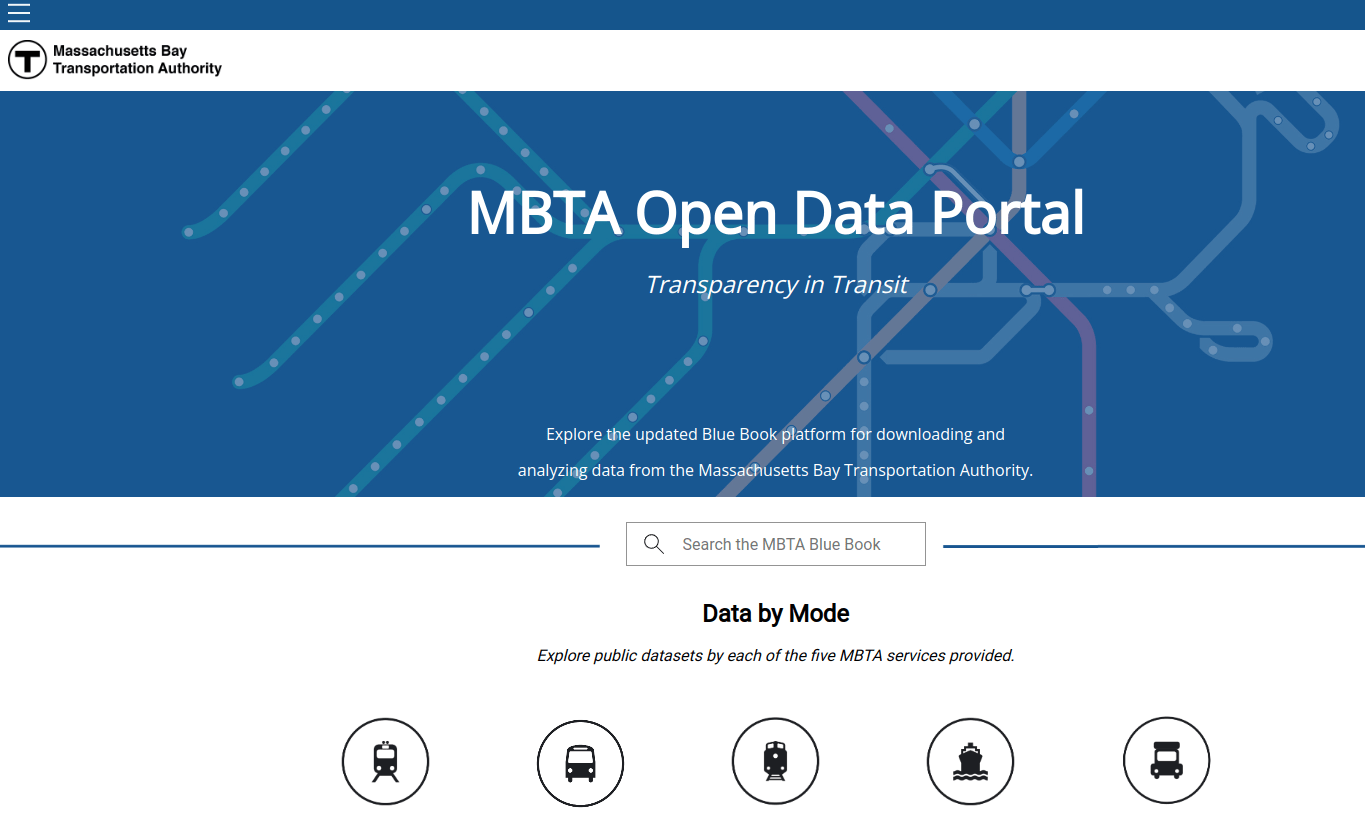
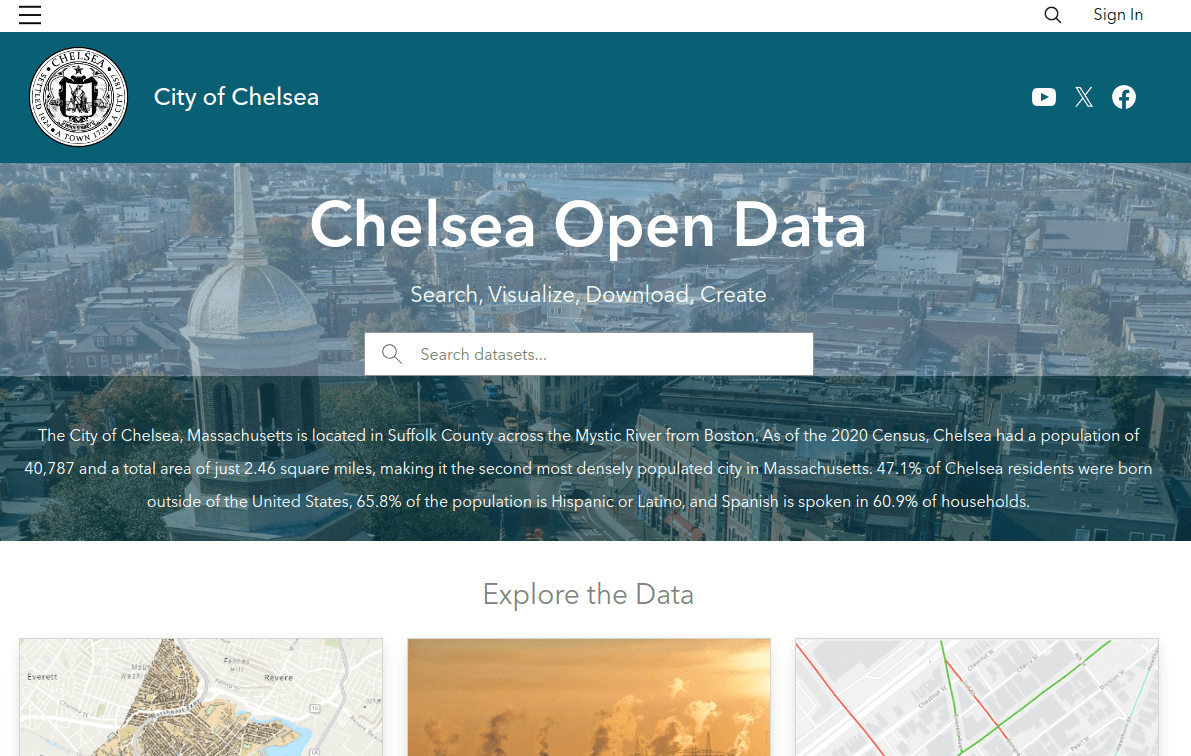
local / regional data
visualize
to tell a story!
Final submission 5/17
same day
Get Martin's feedback for bonus!
Proposal due 5/1
5/3
Final Submission
web-based data story
+ report
40% of your grade
community engagement / value
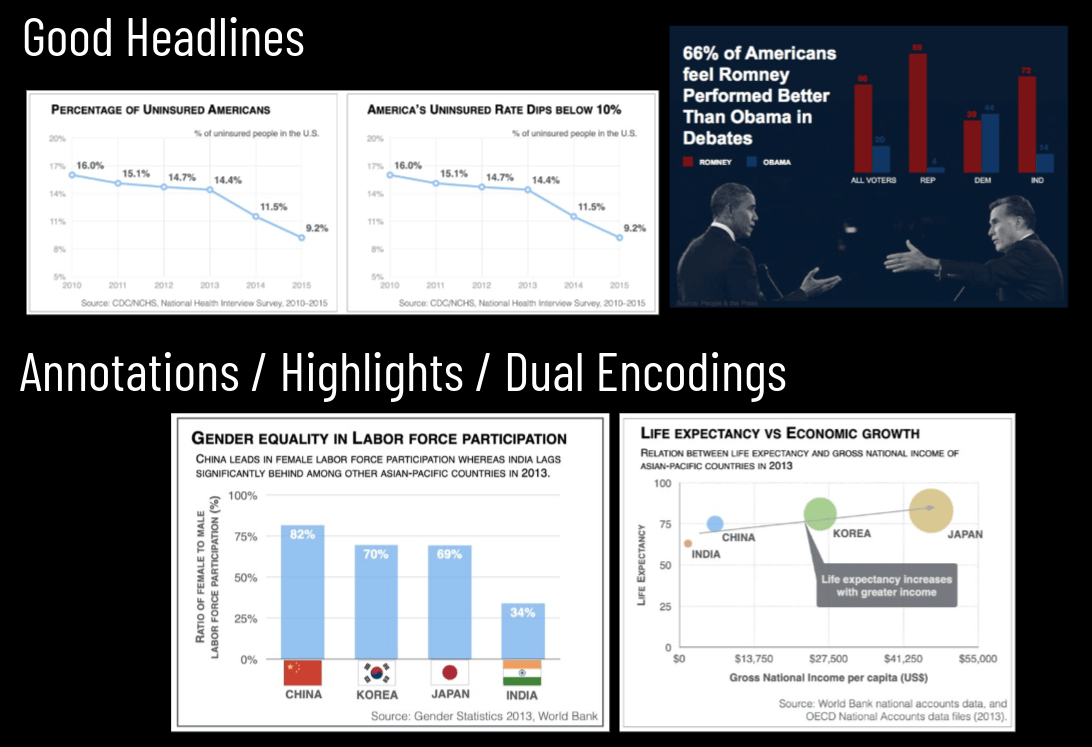
visualization design best practices
creativity
storytelling elements
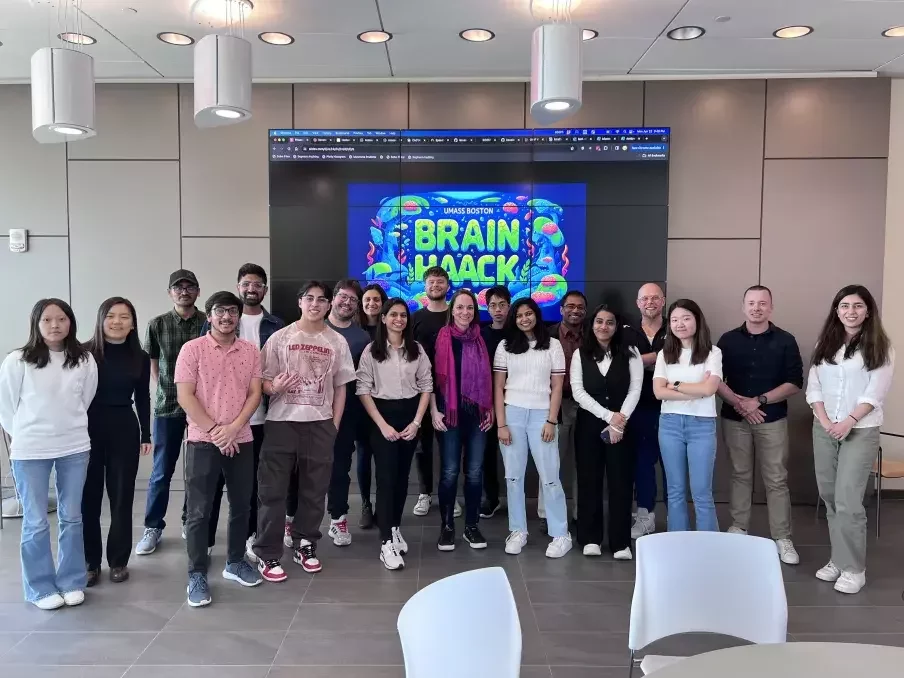
@staff
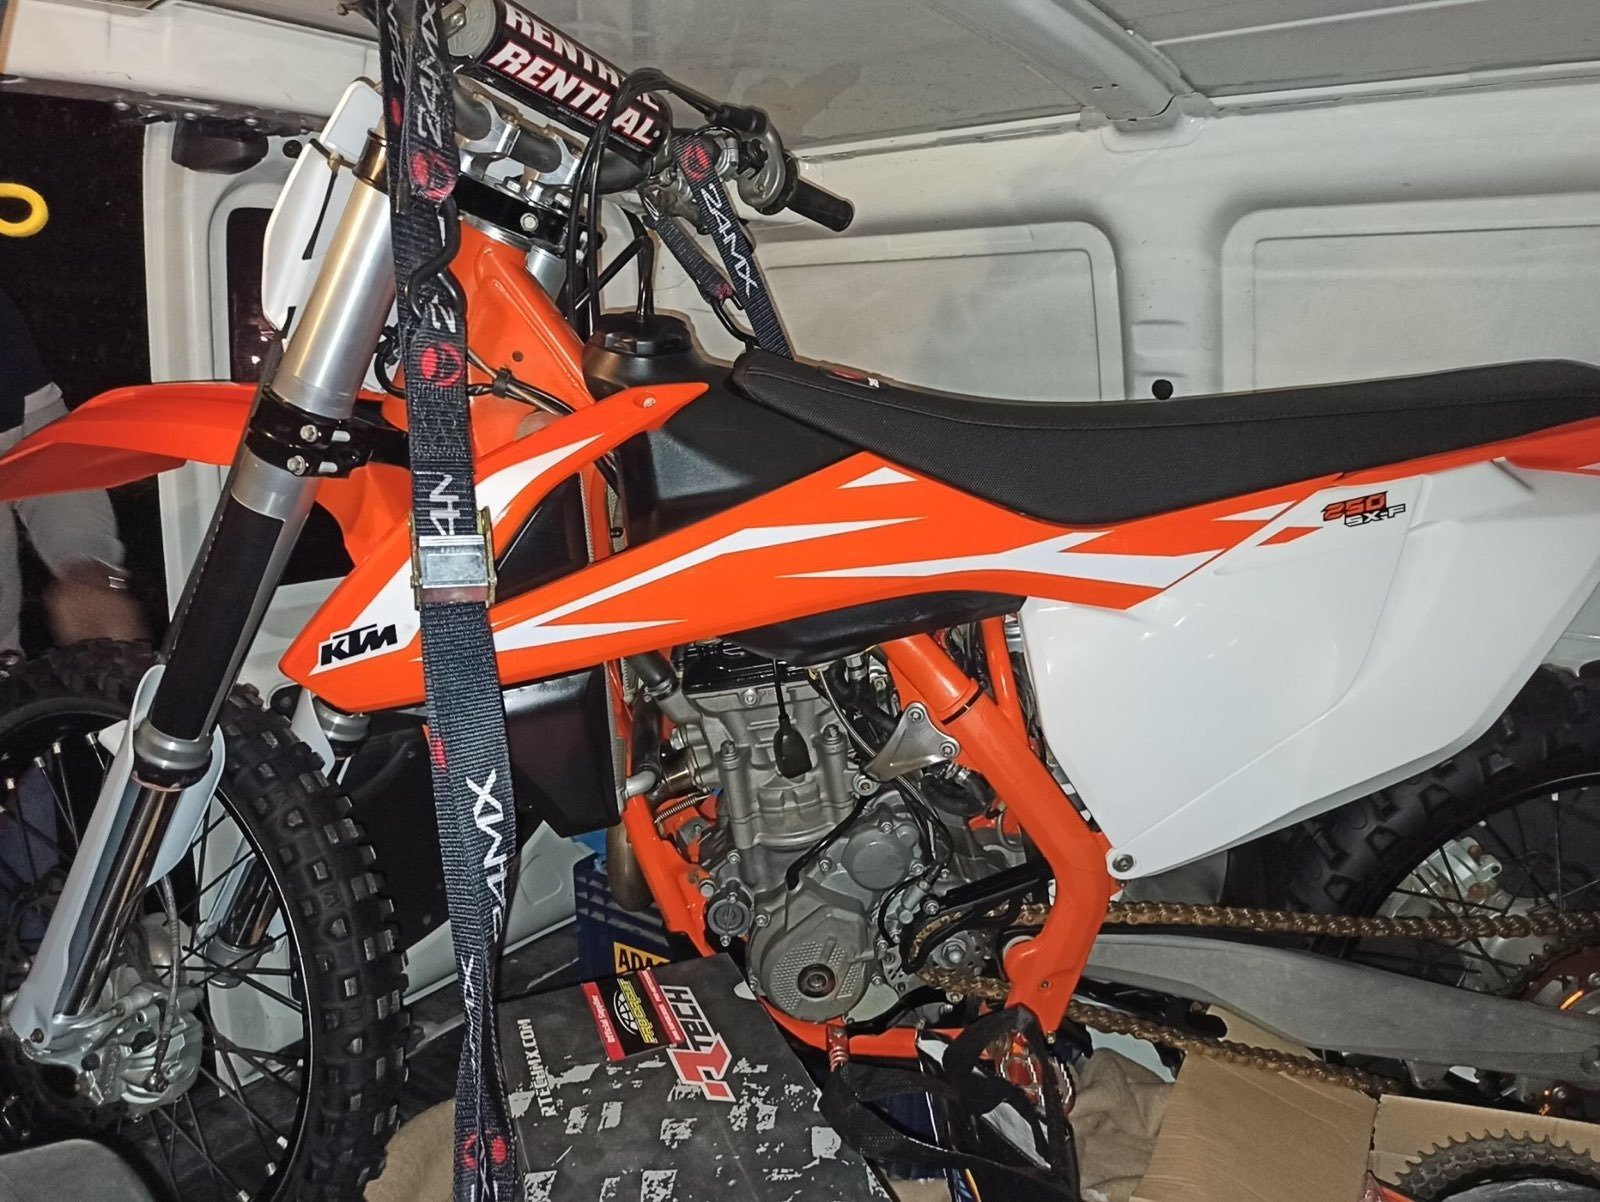
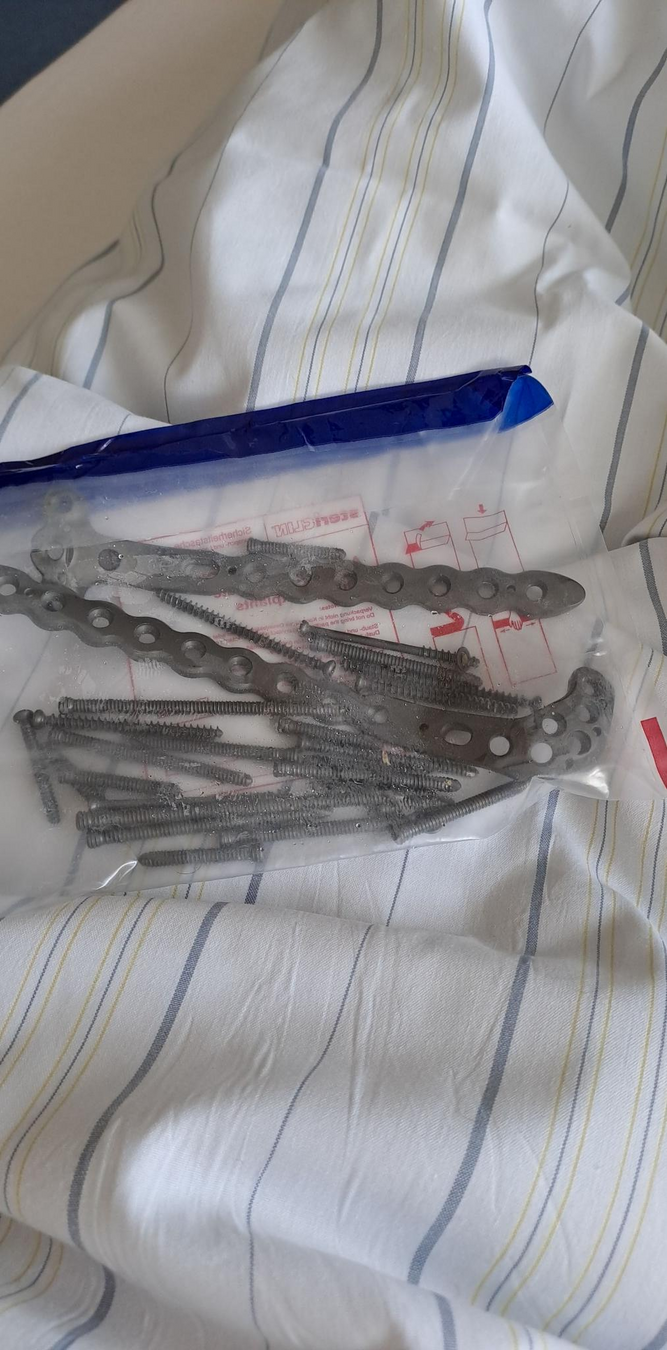
The Motorcycle Story
How can we add data to this?
Color
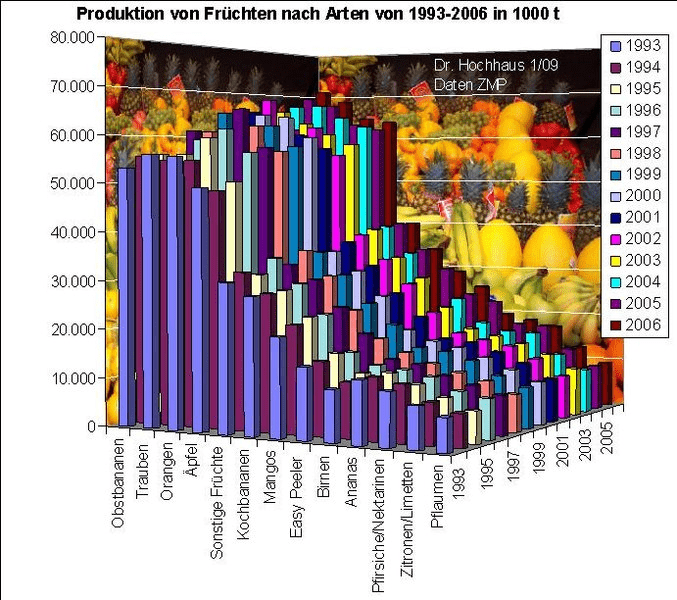
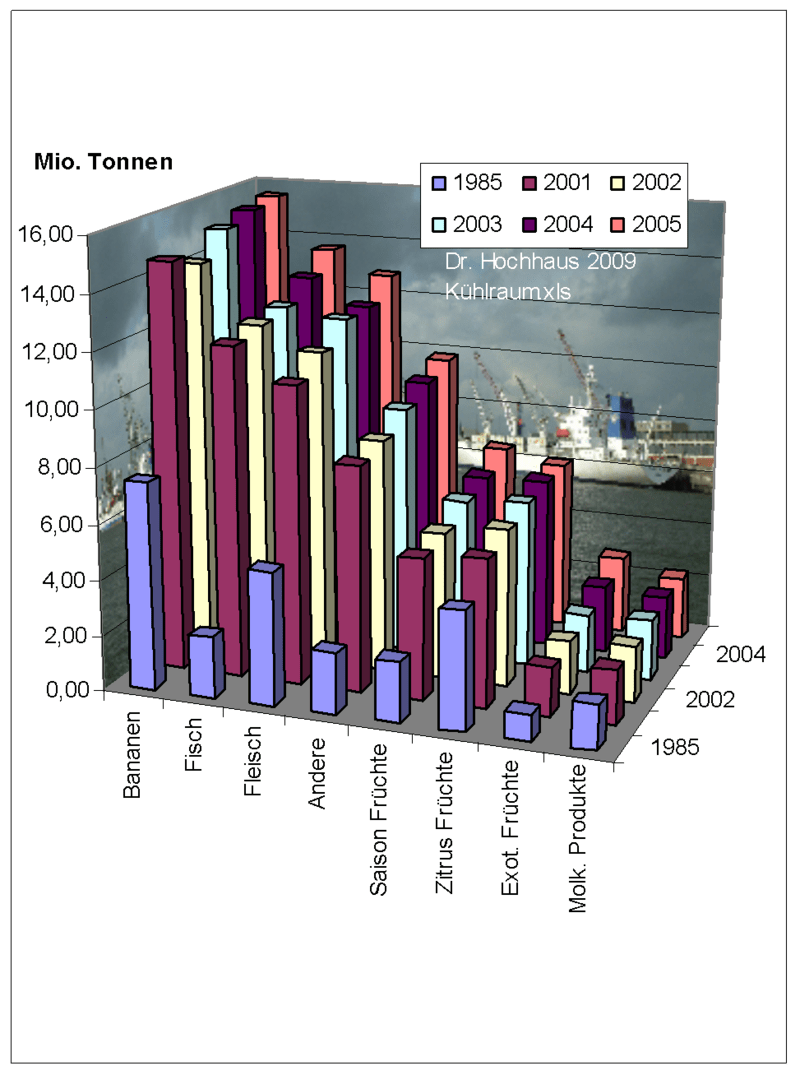
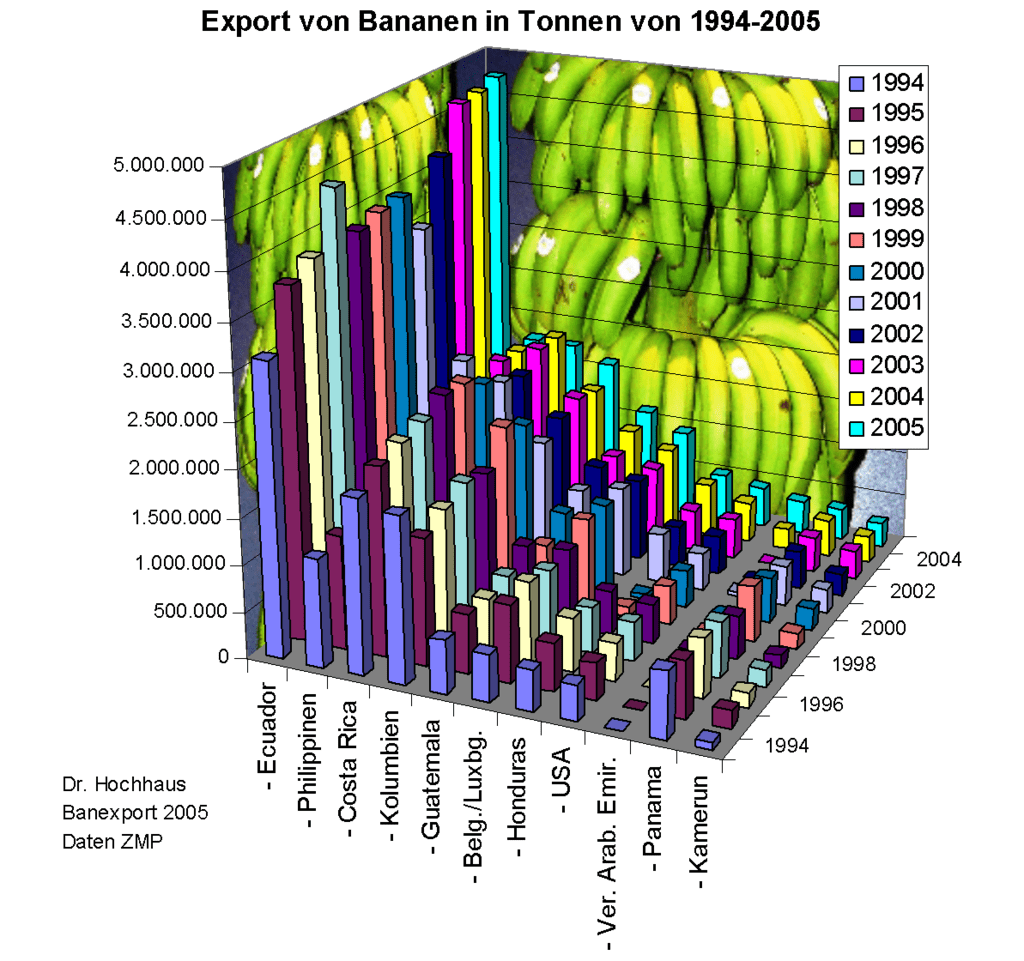
2D vs 3D
How can we add data to this?
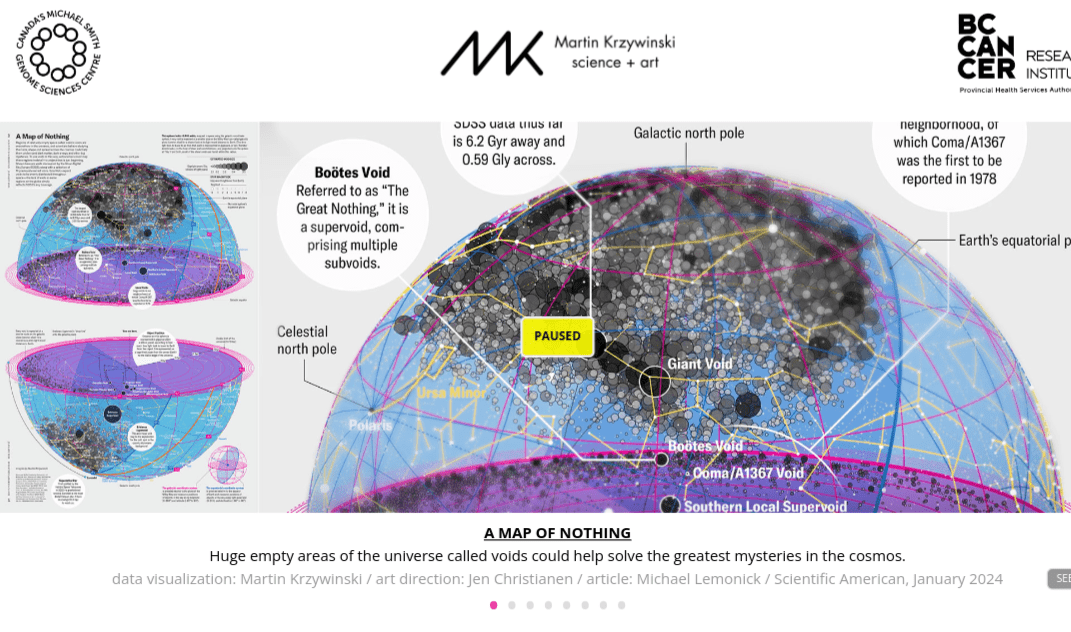
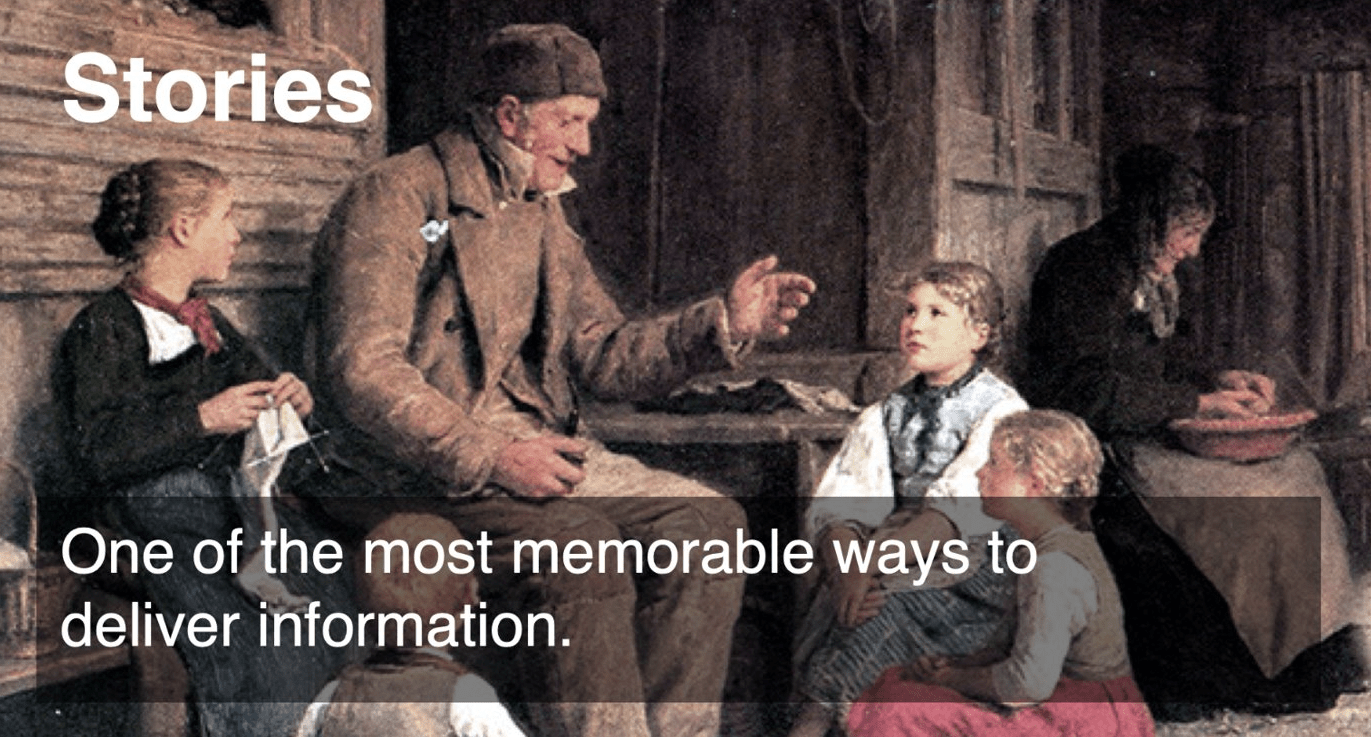
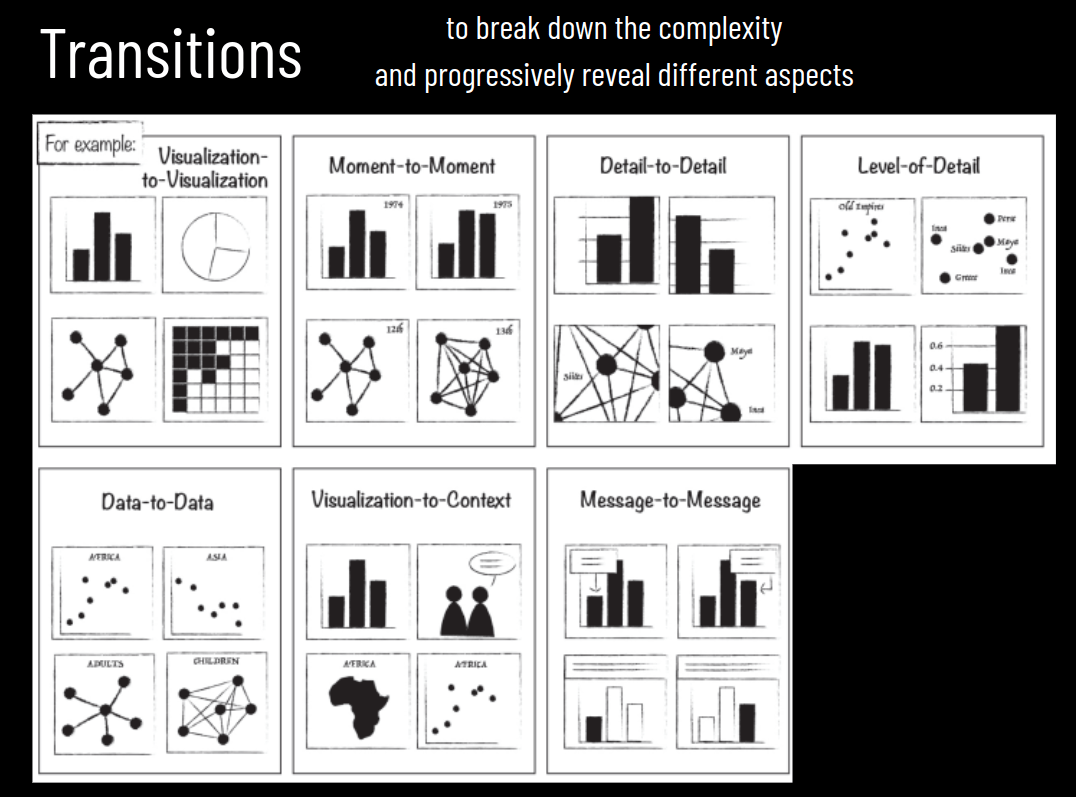
Stories are everywhere!
Make an impact!
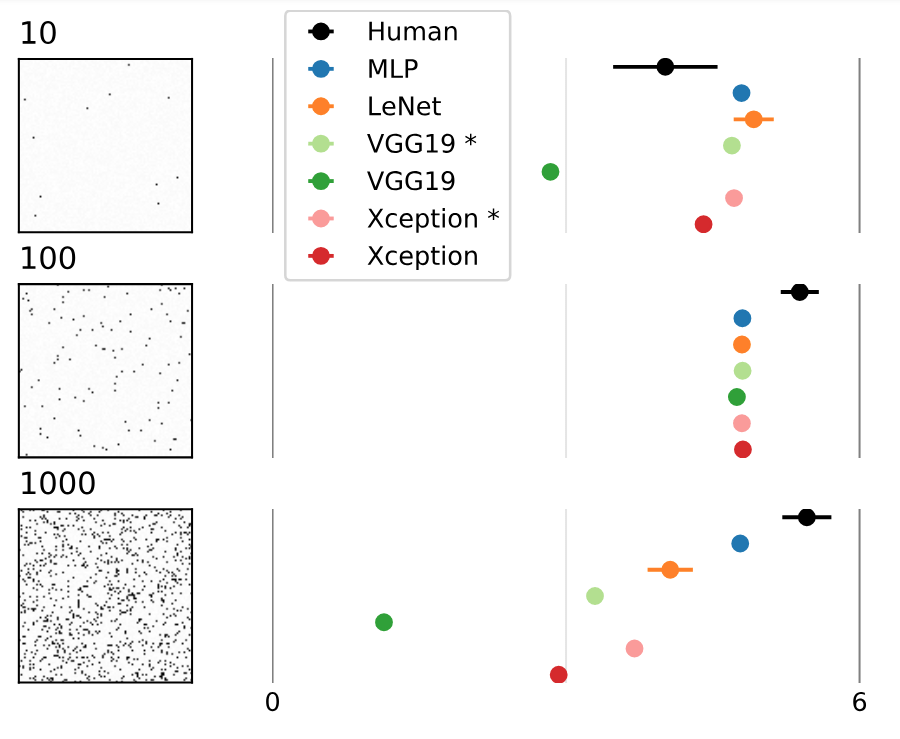
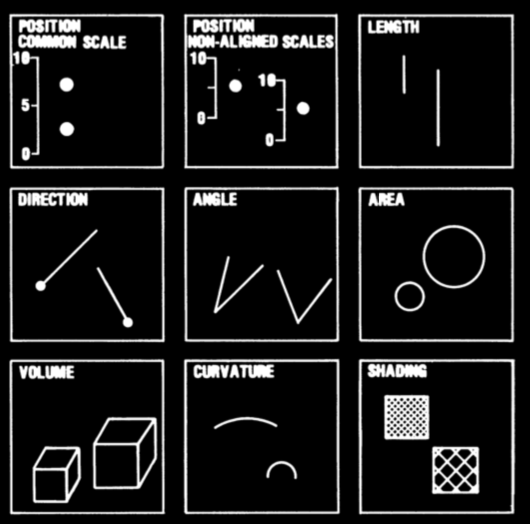
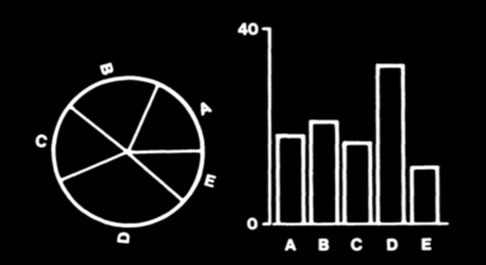
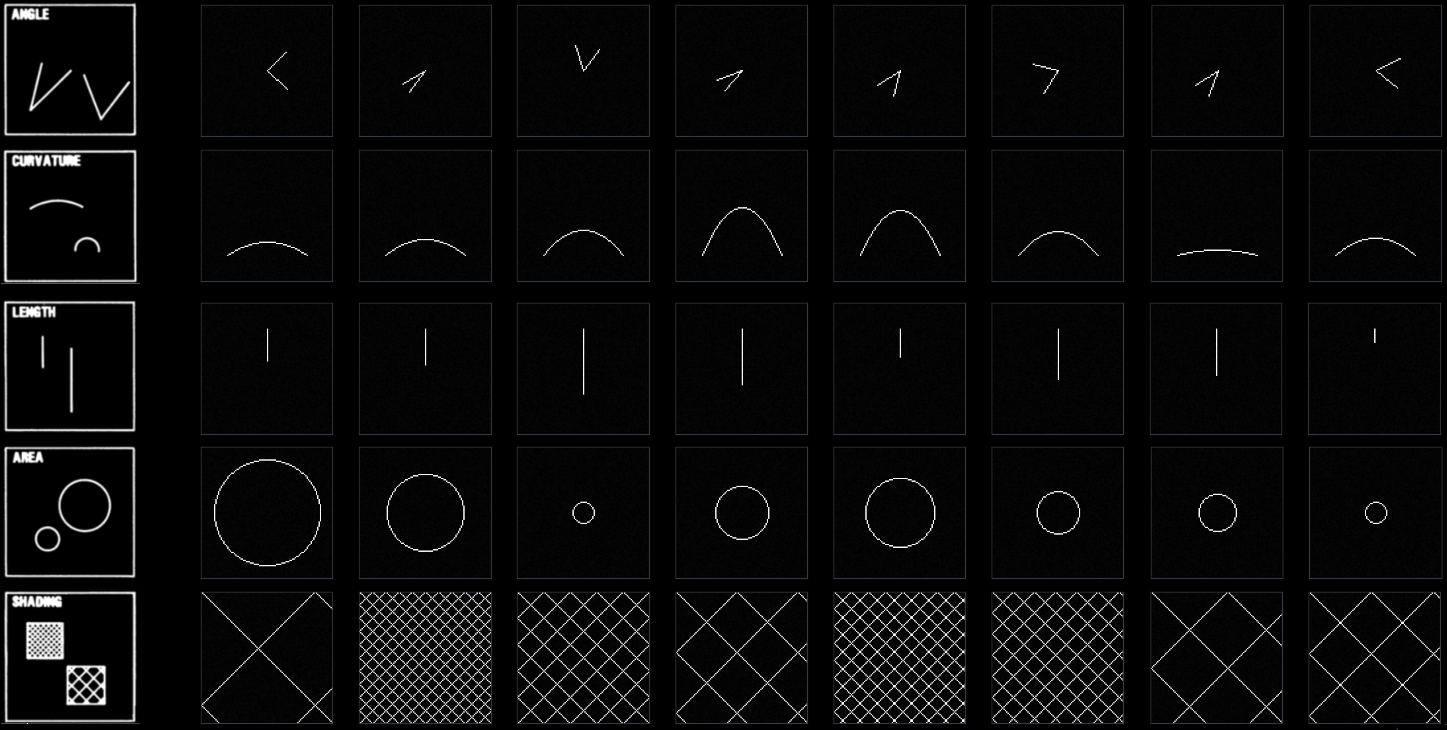
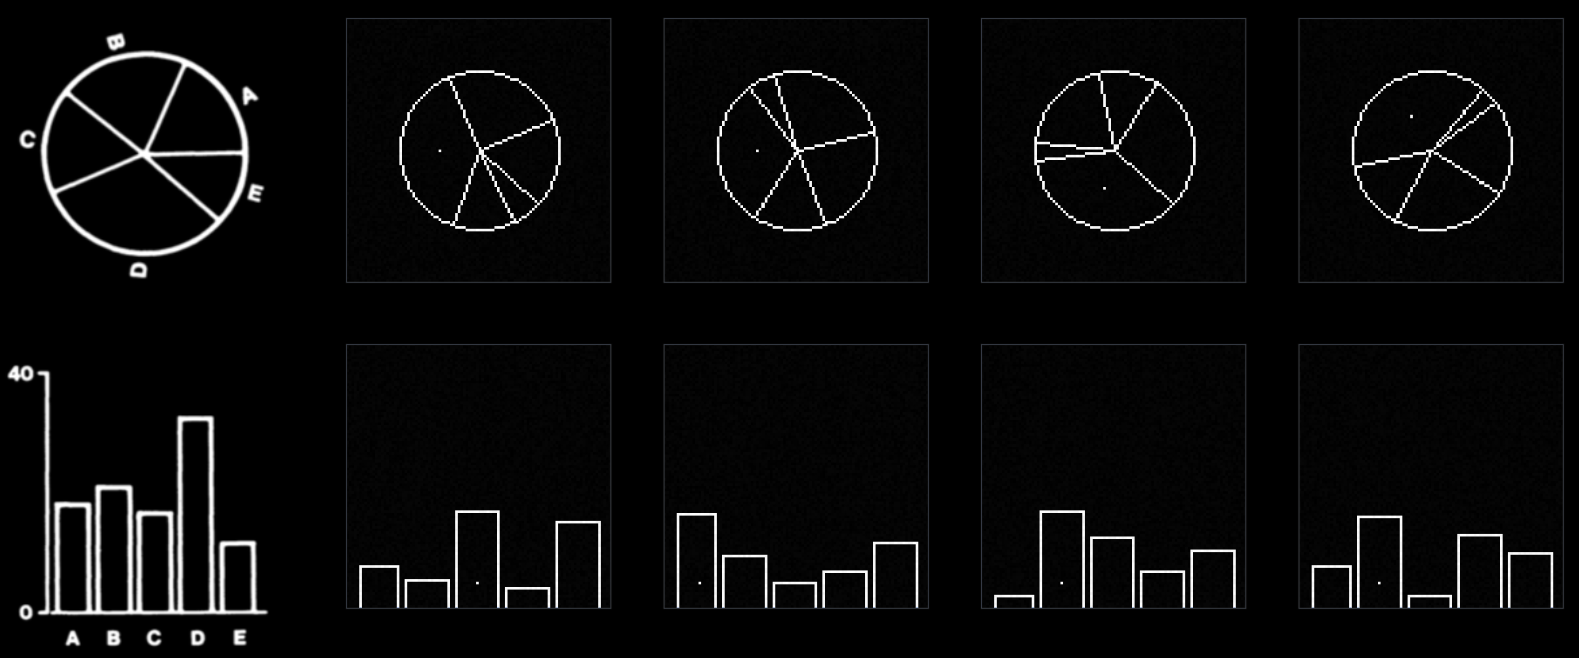
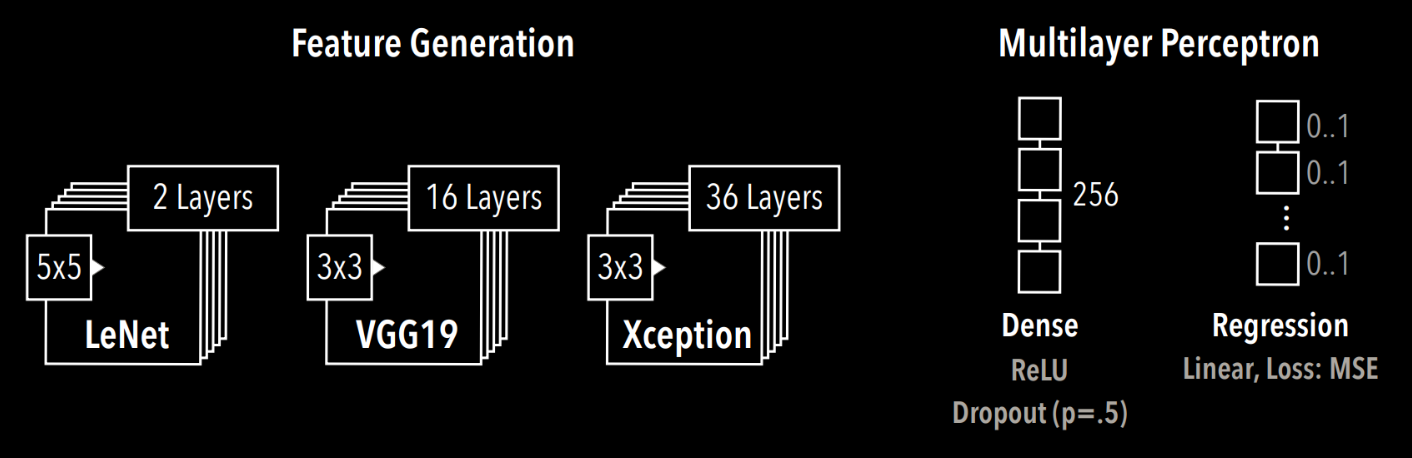
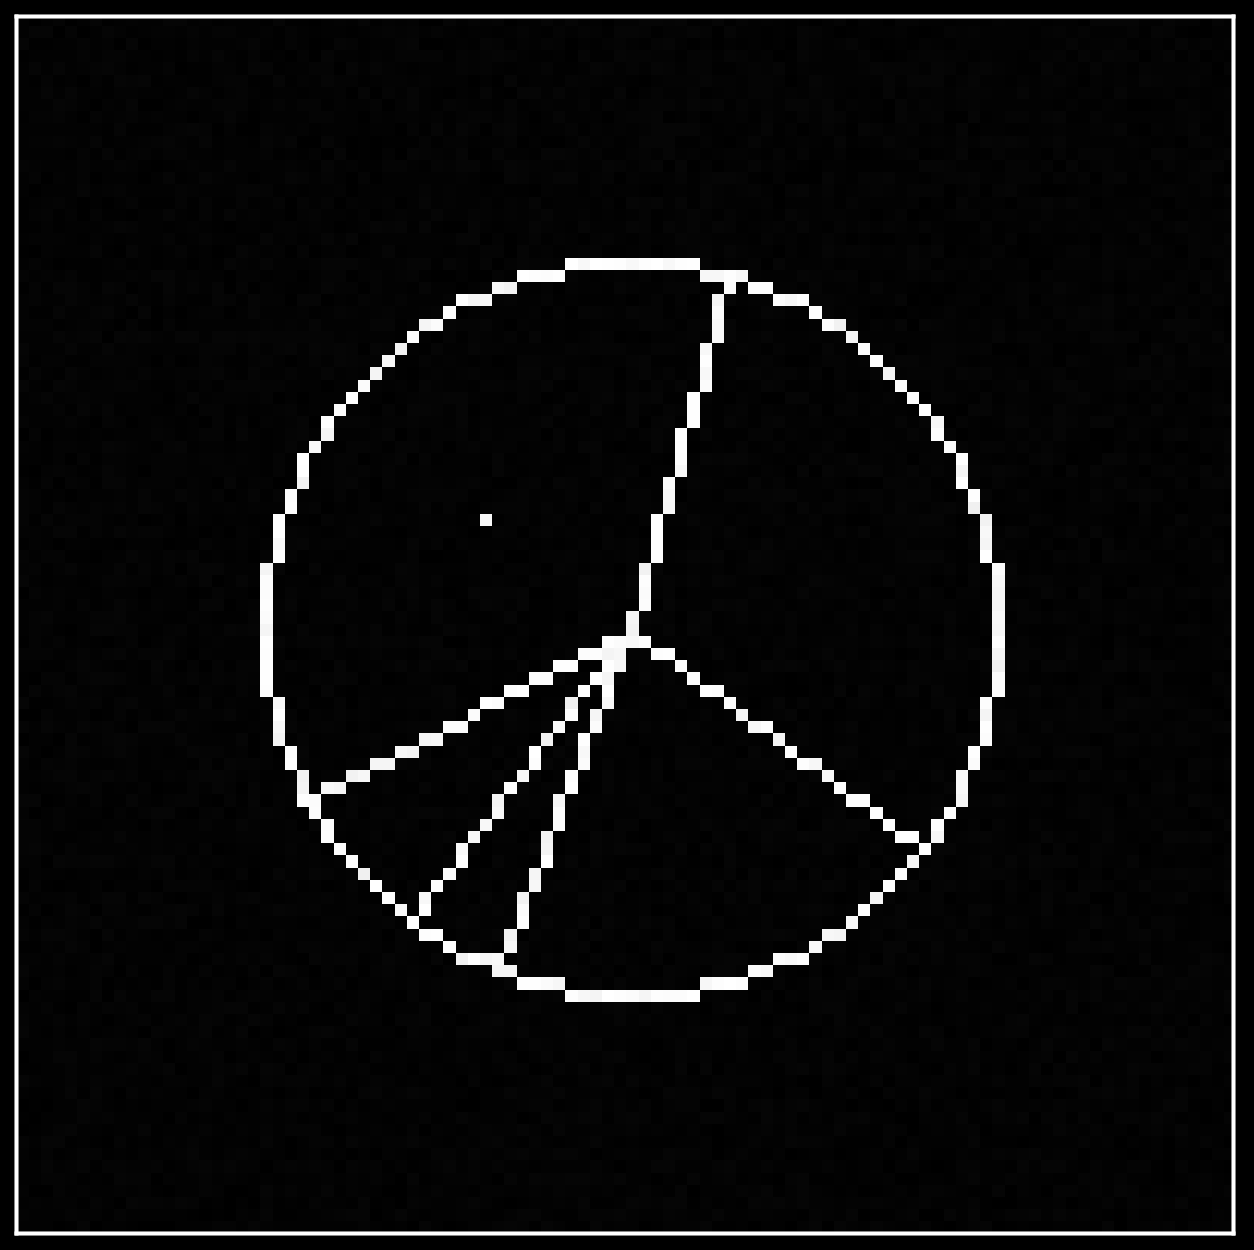
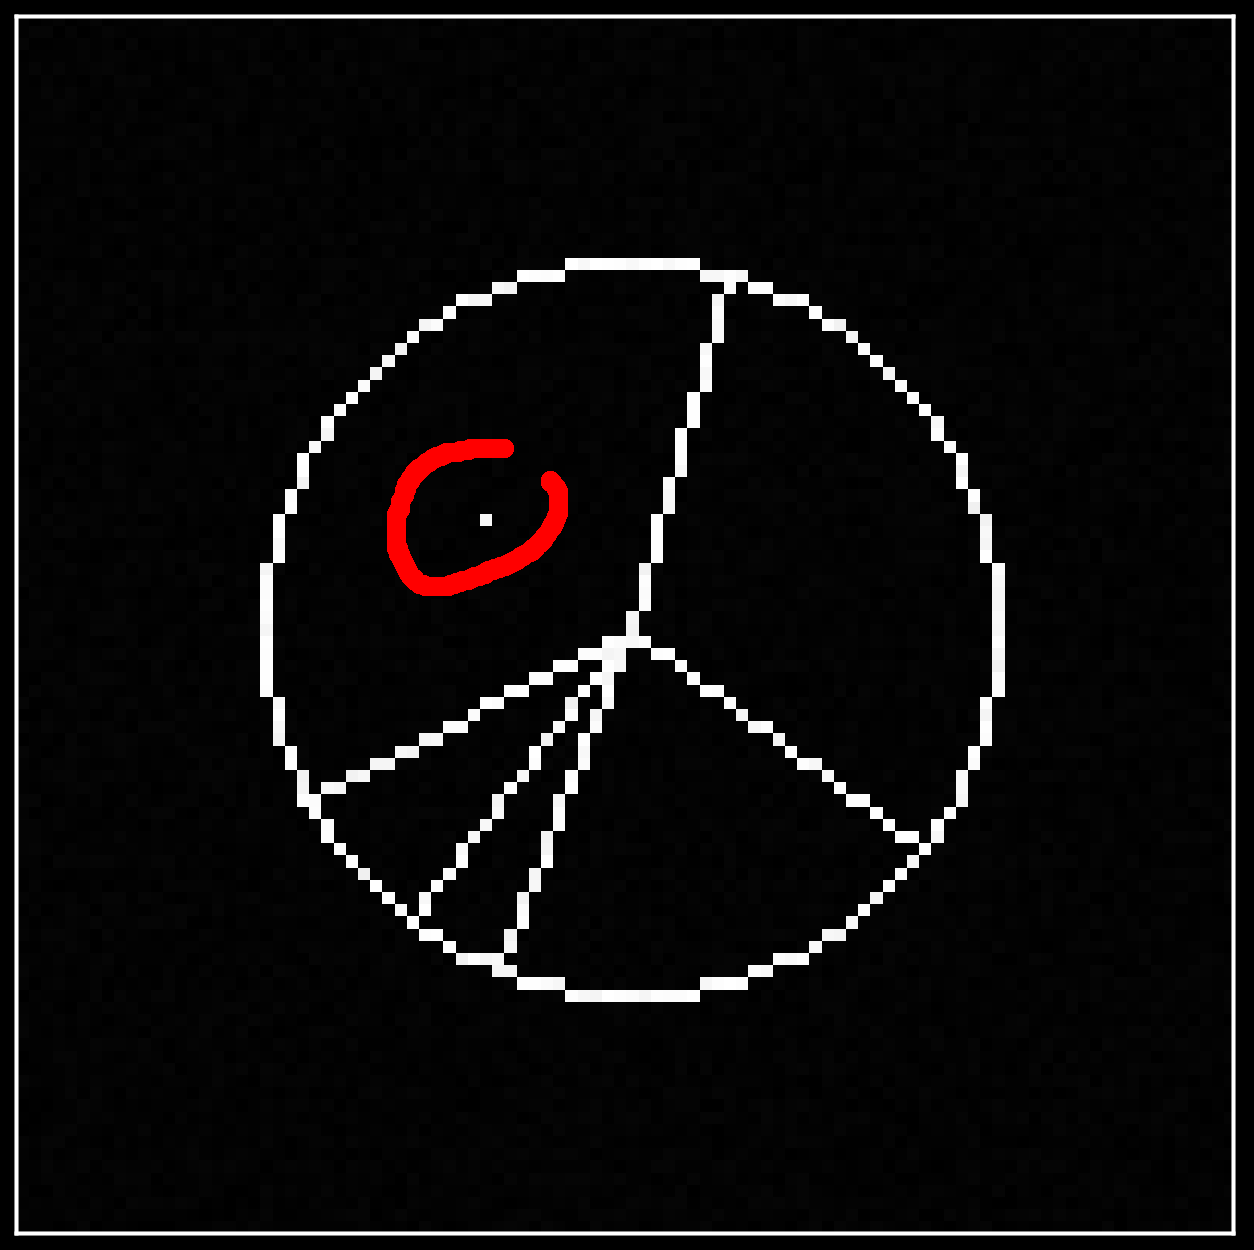
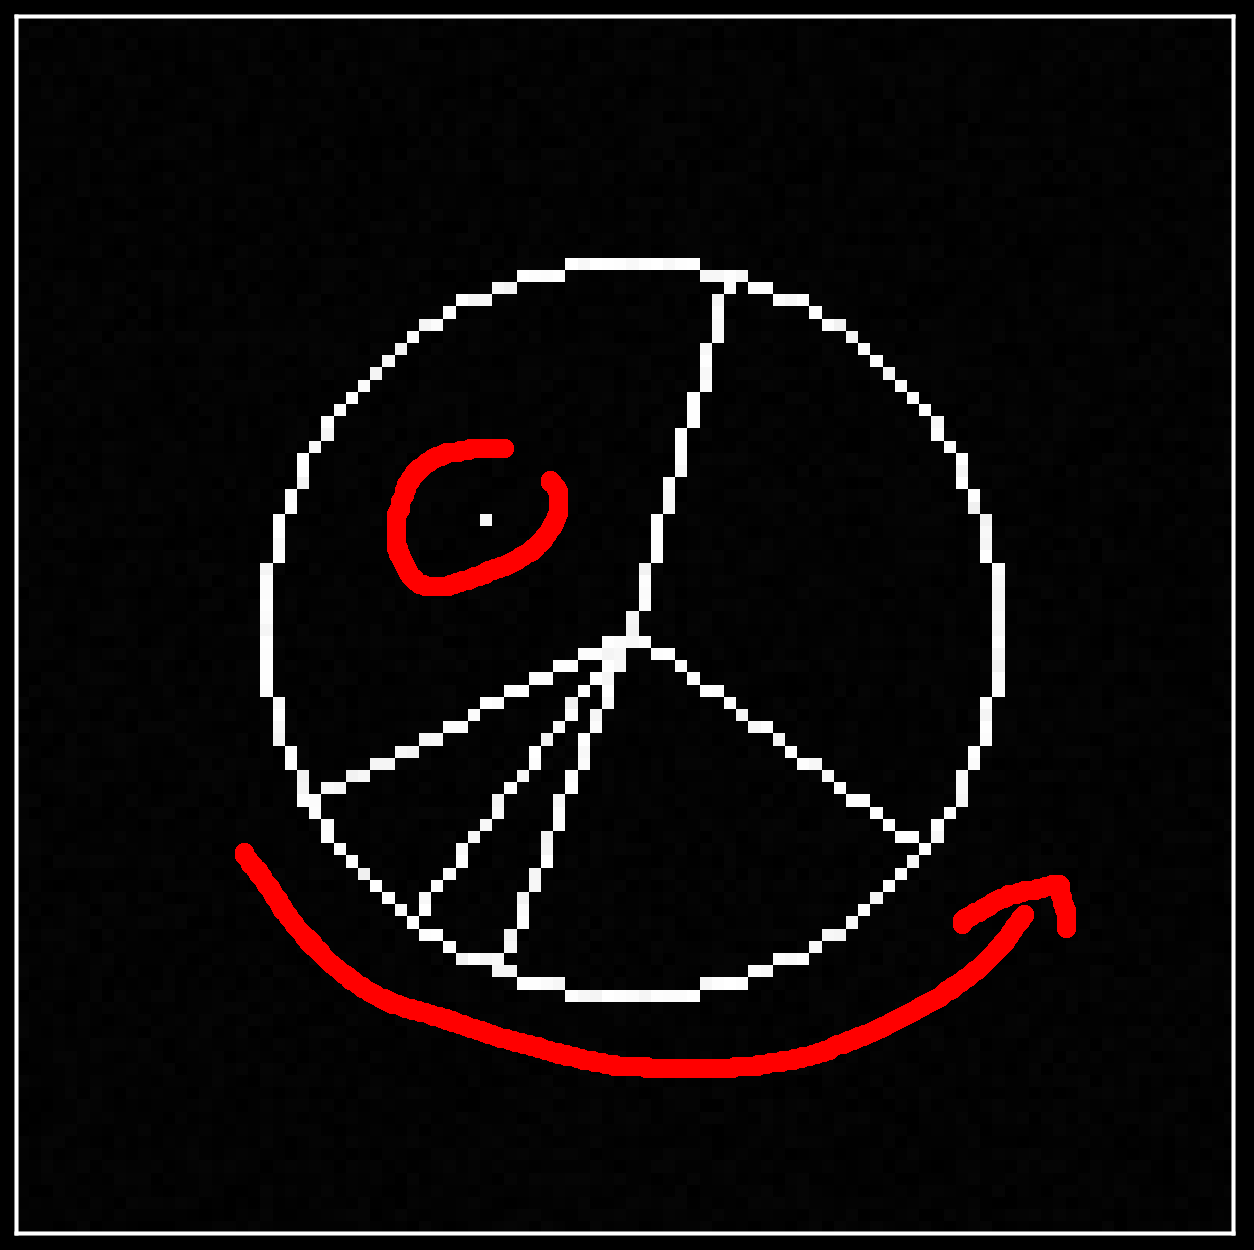
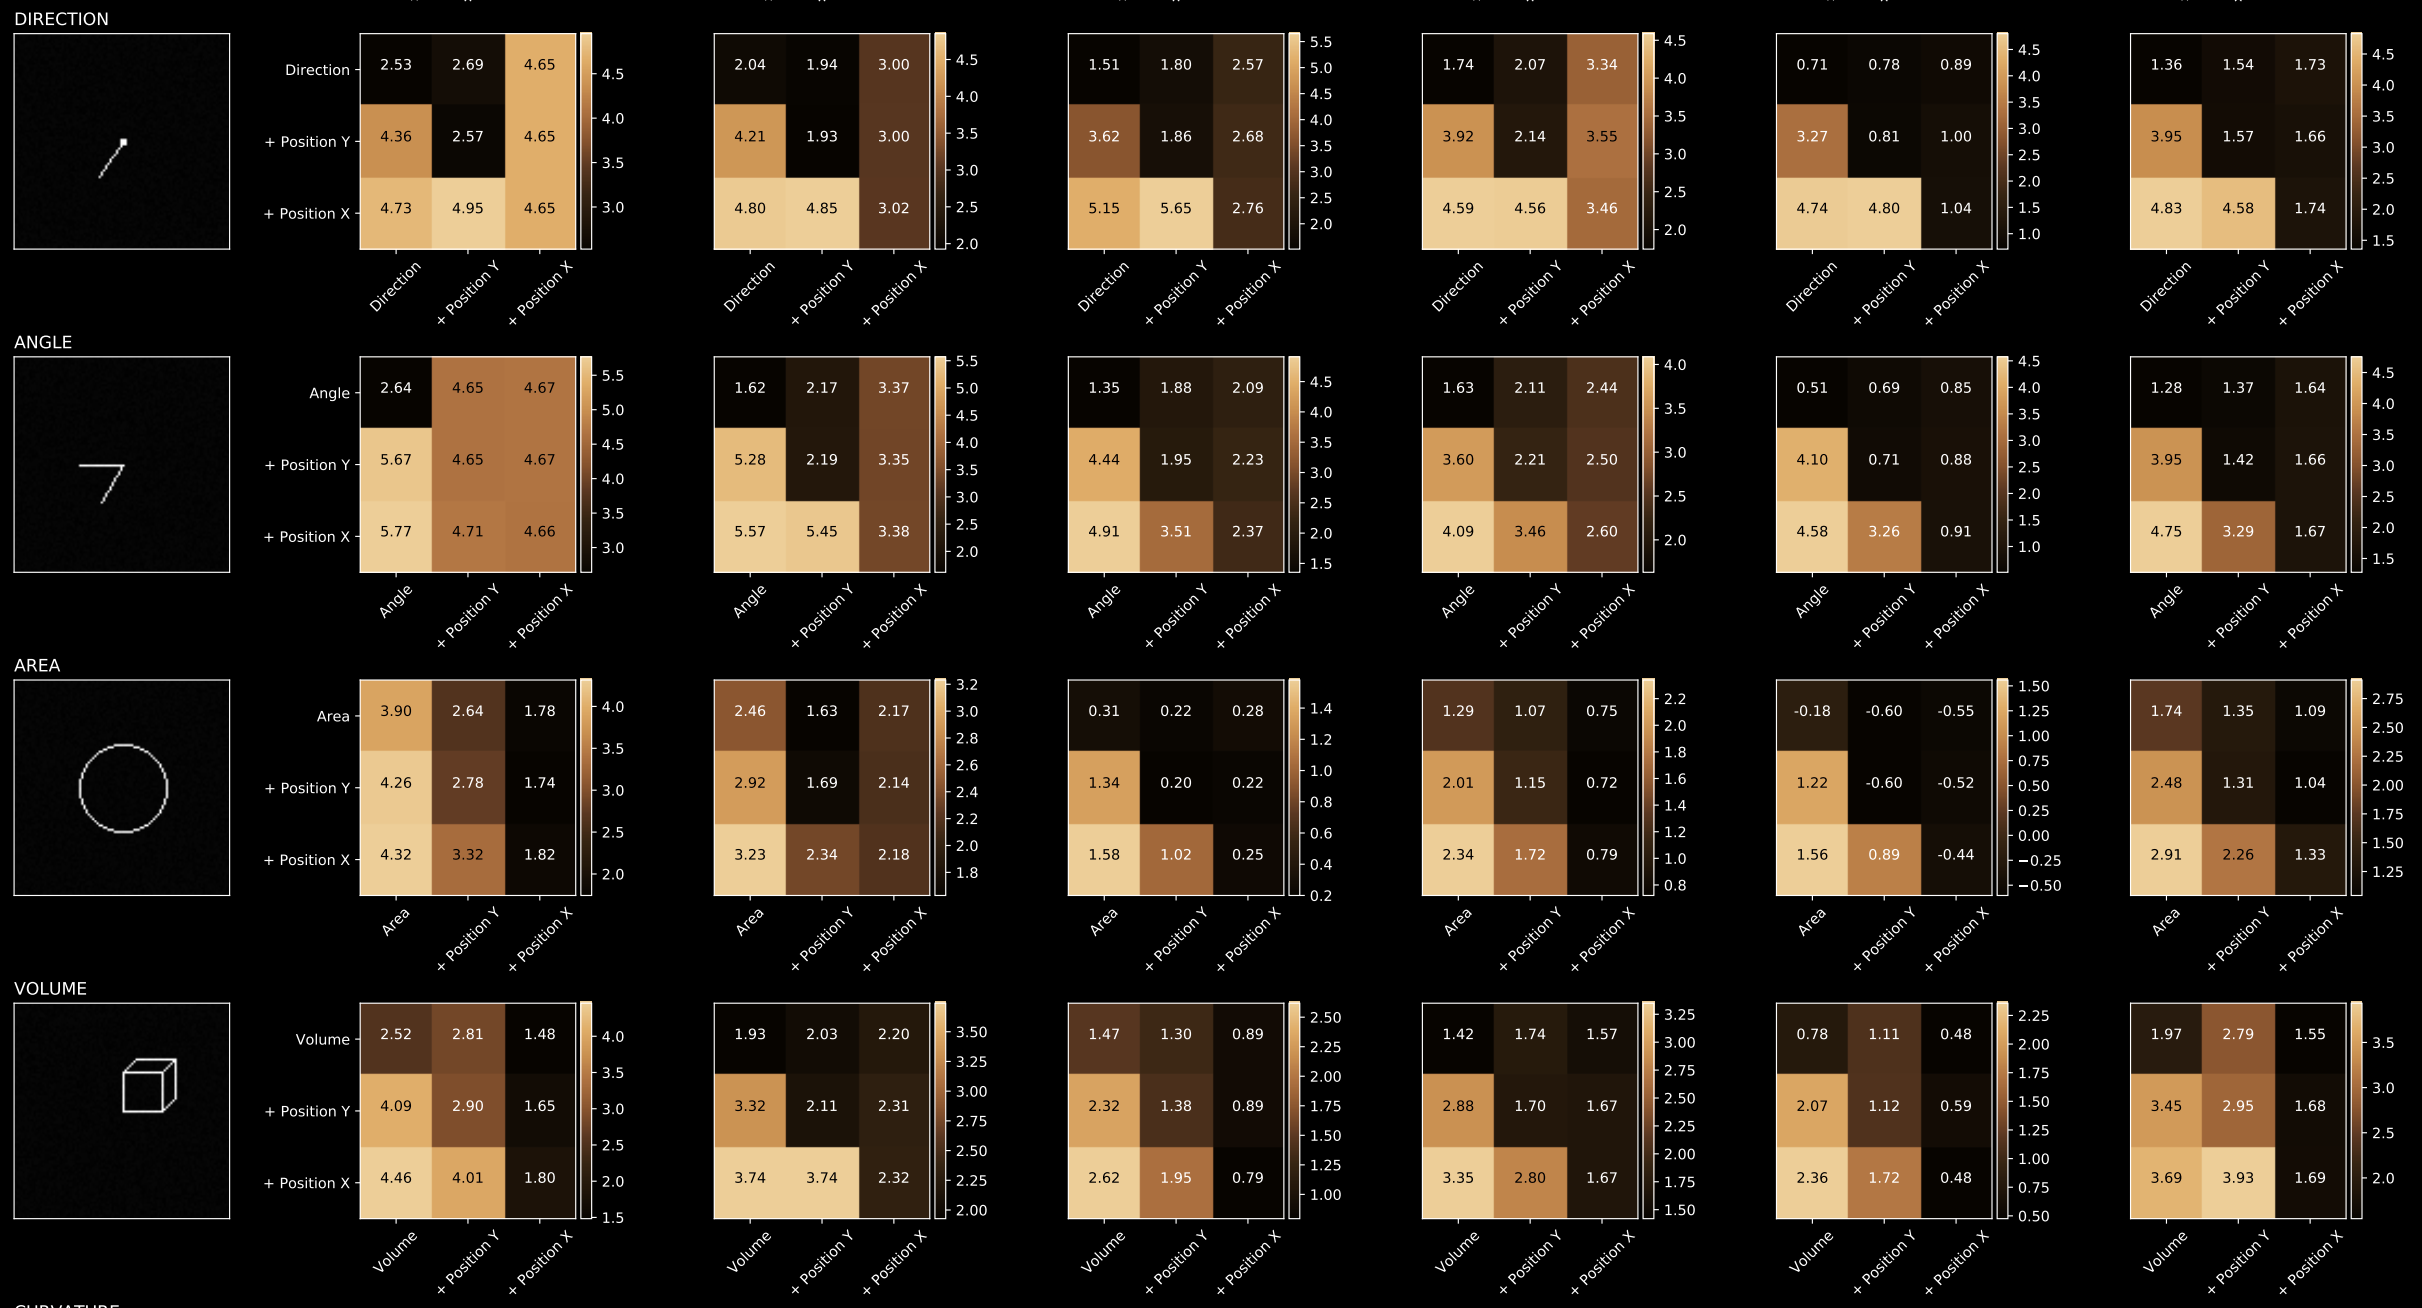
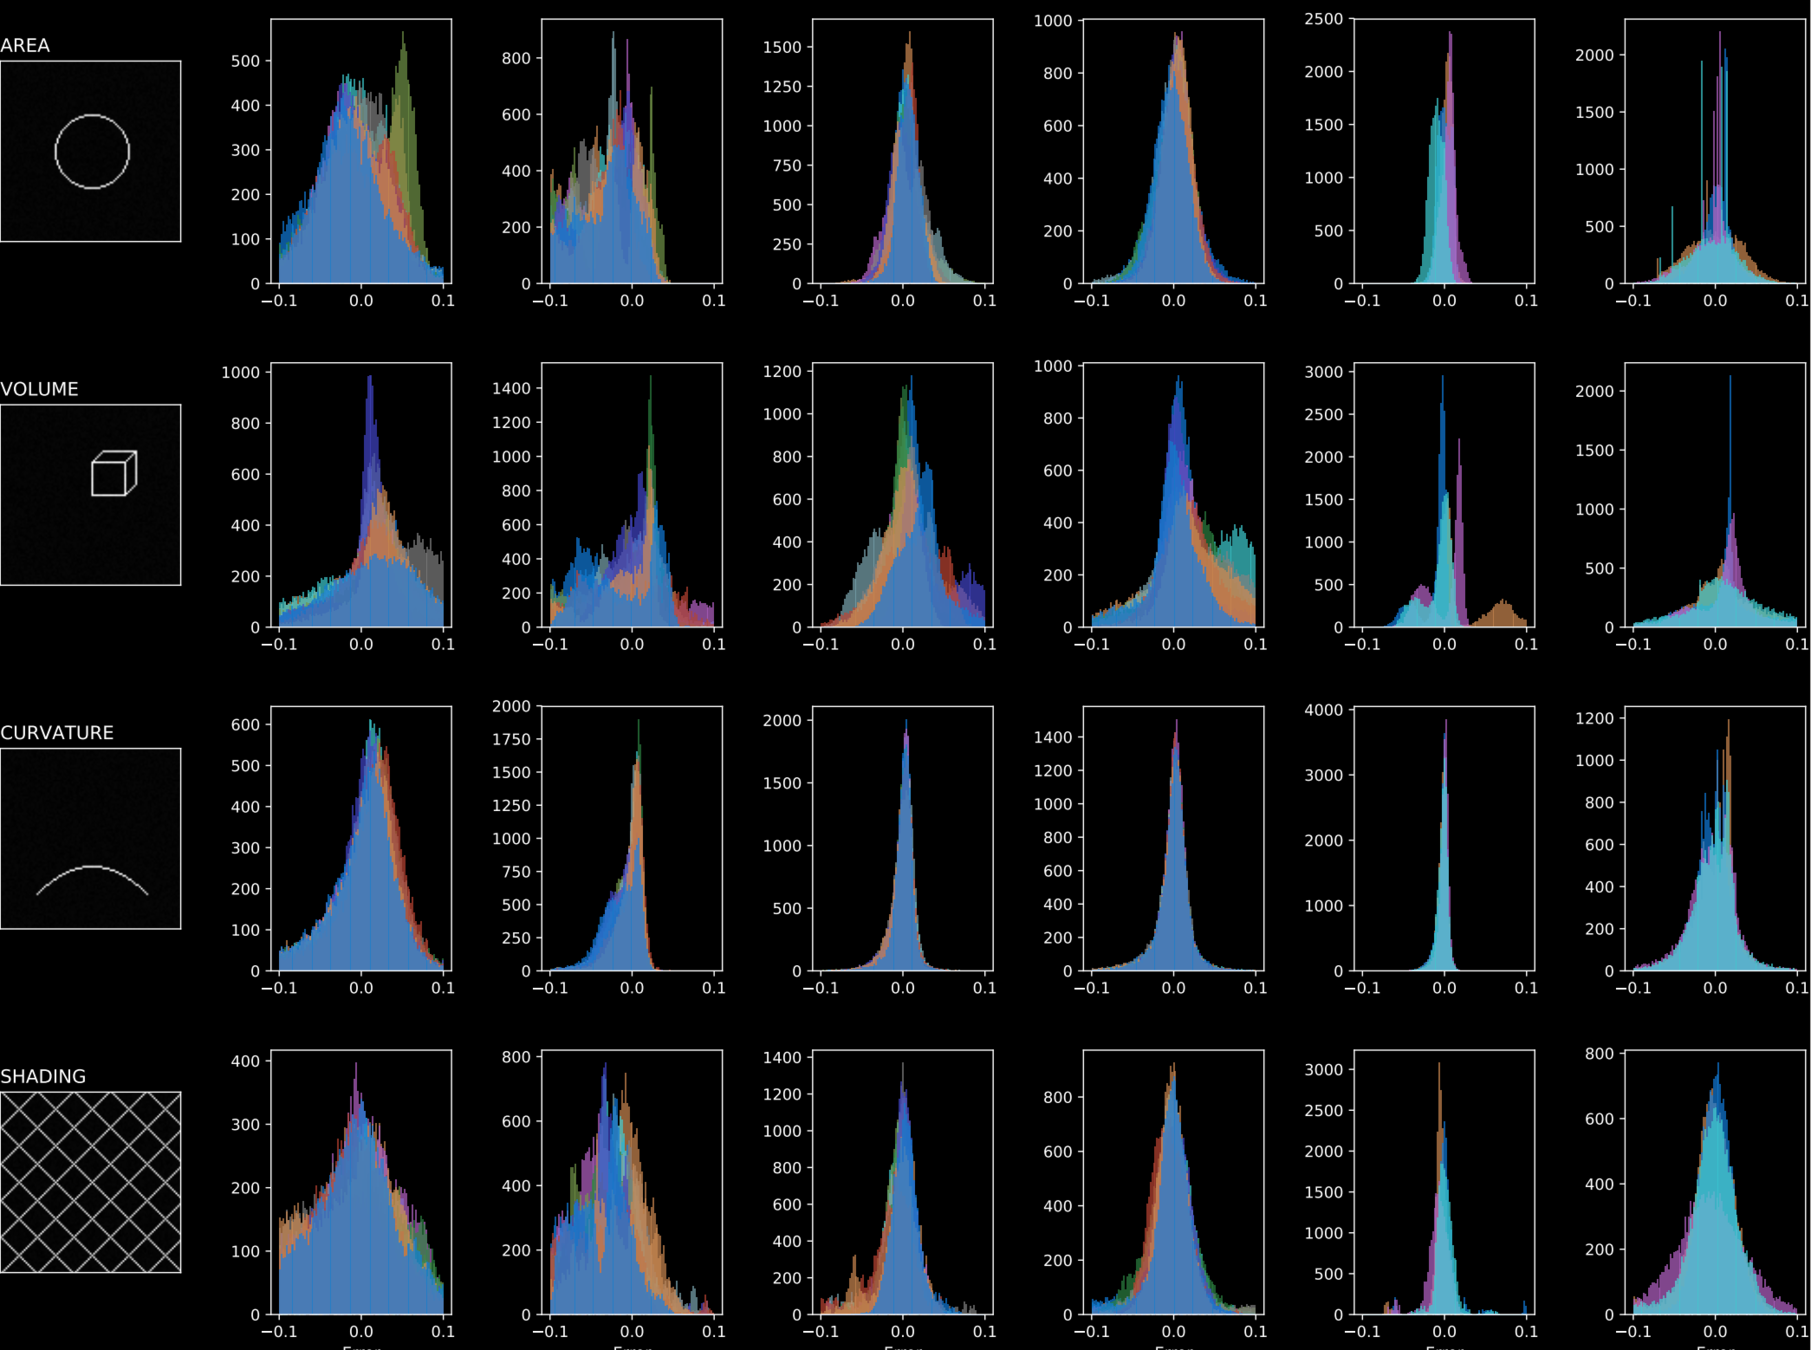
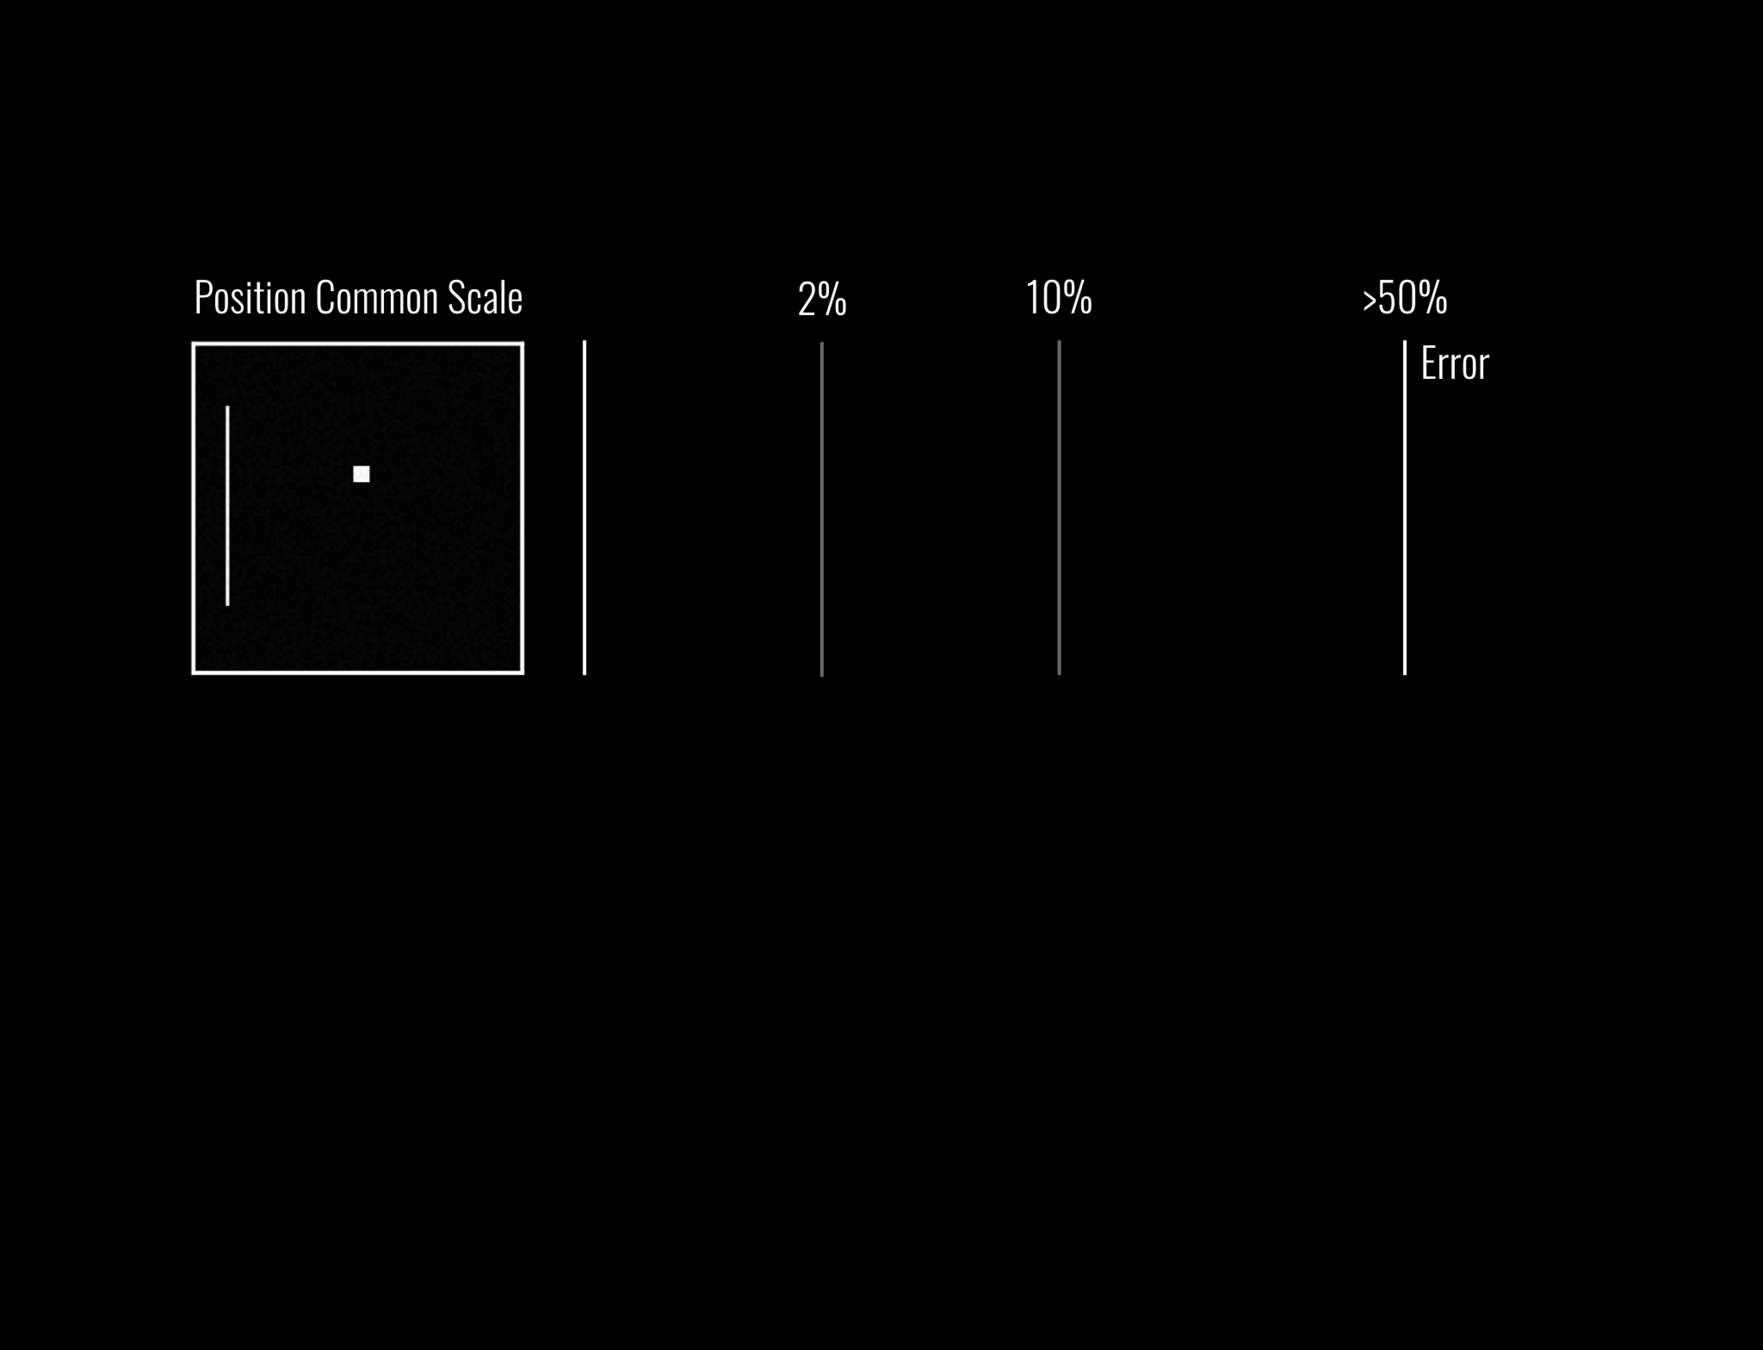
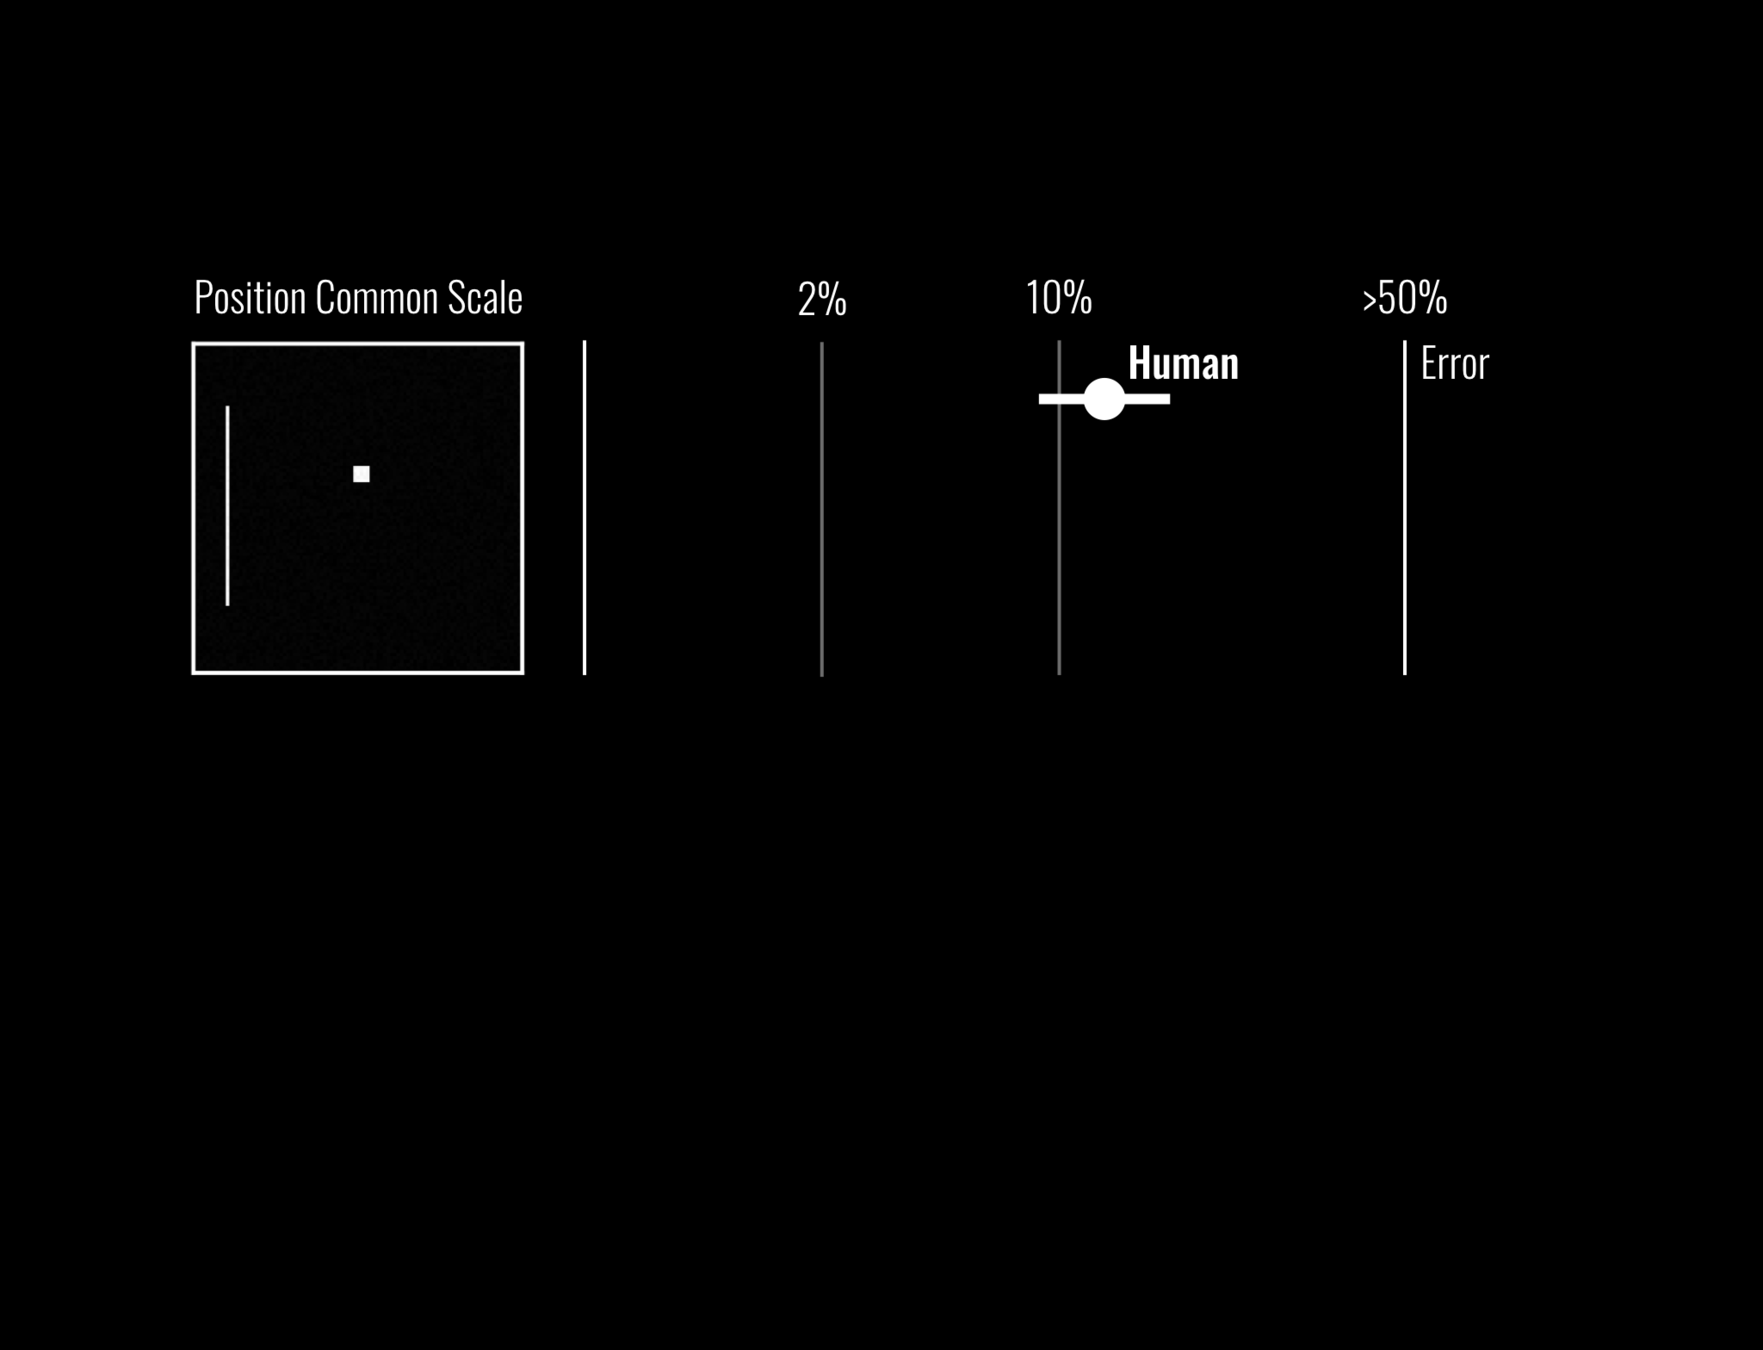
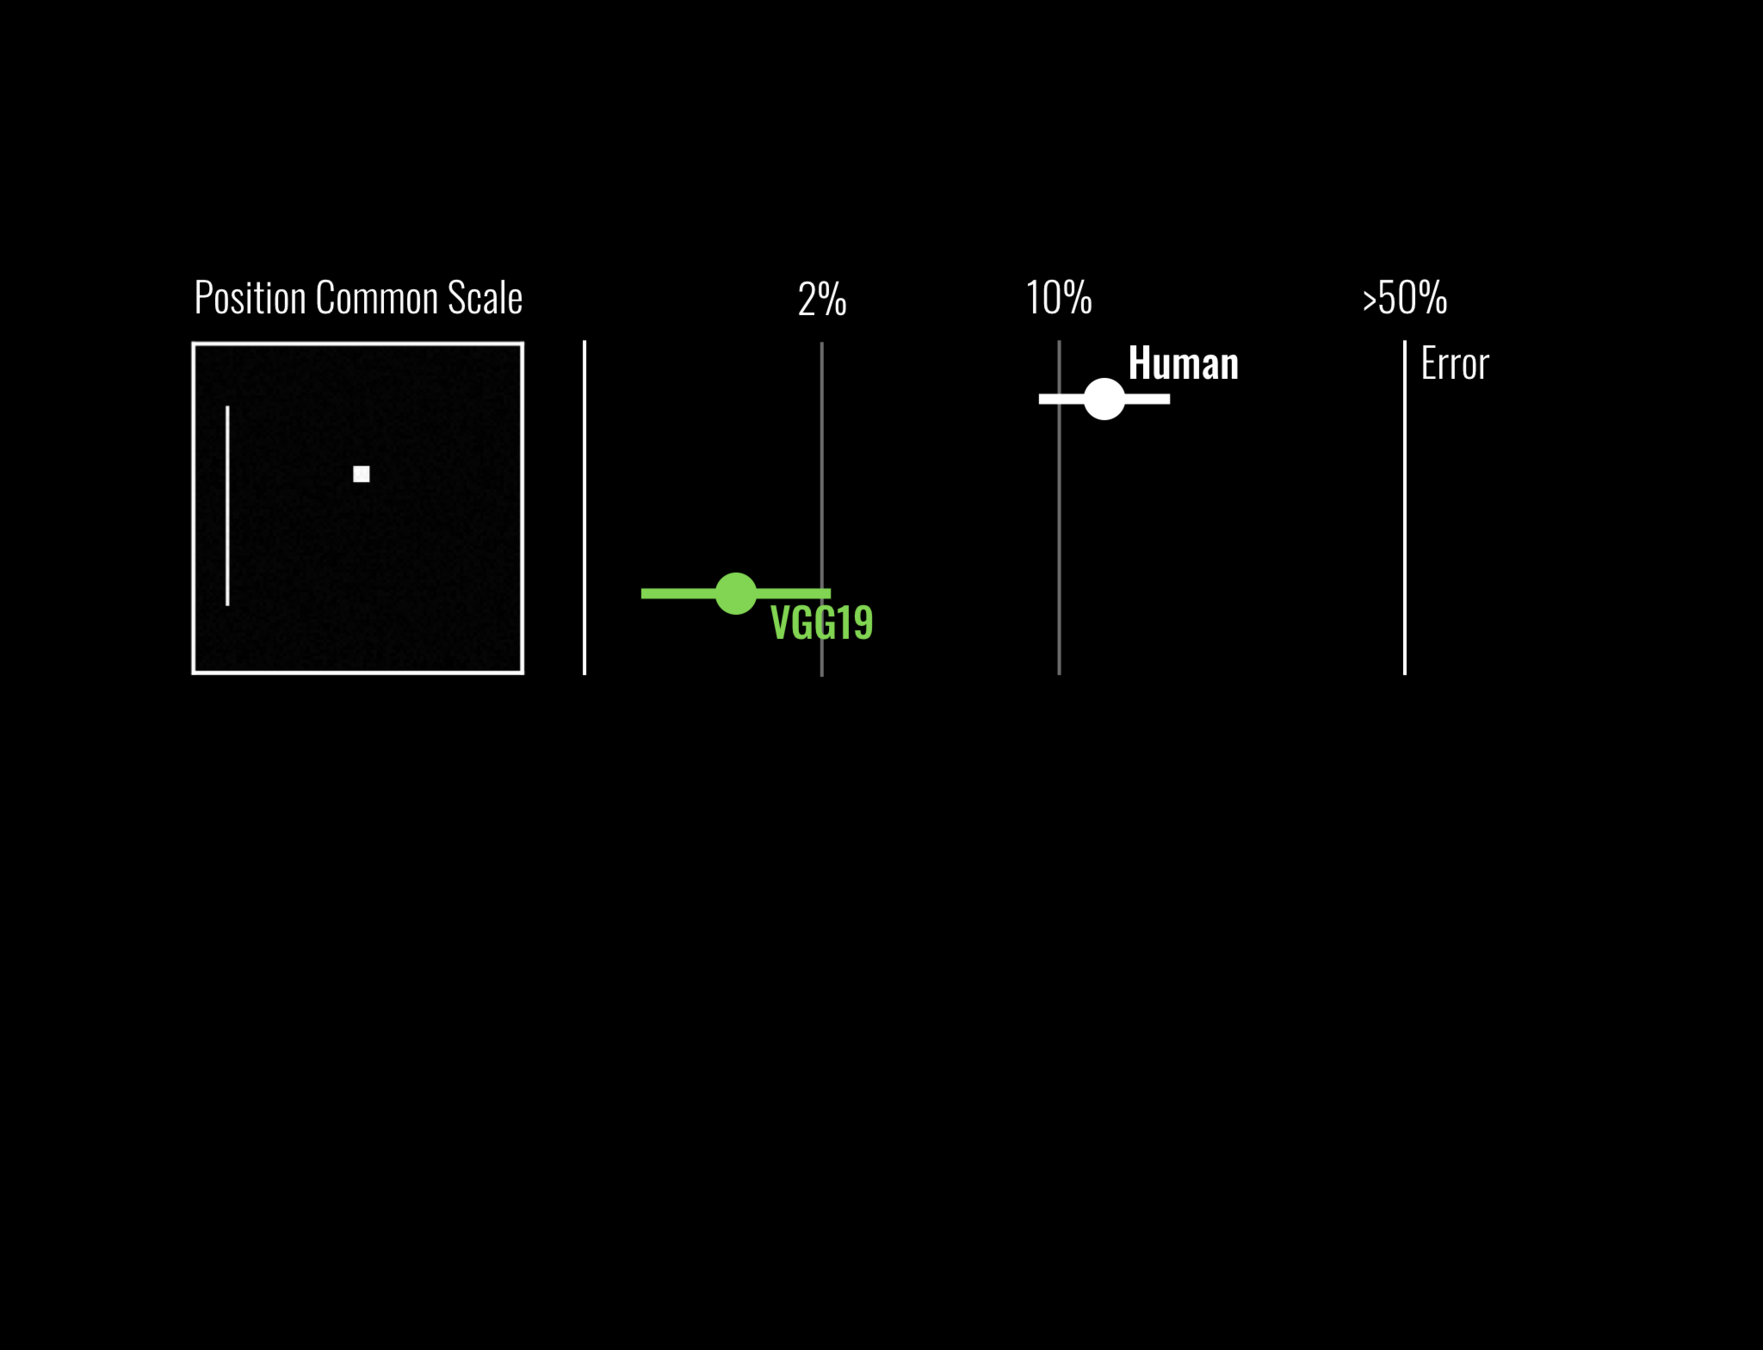
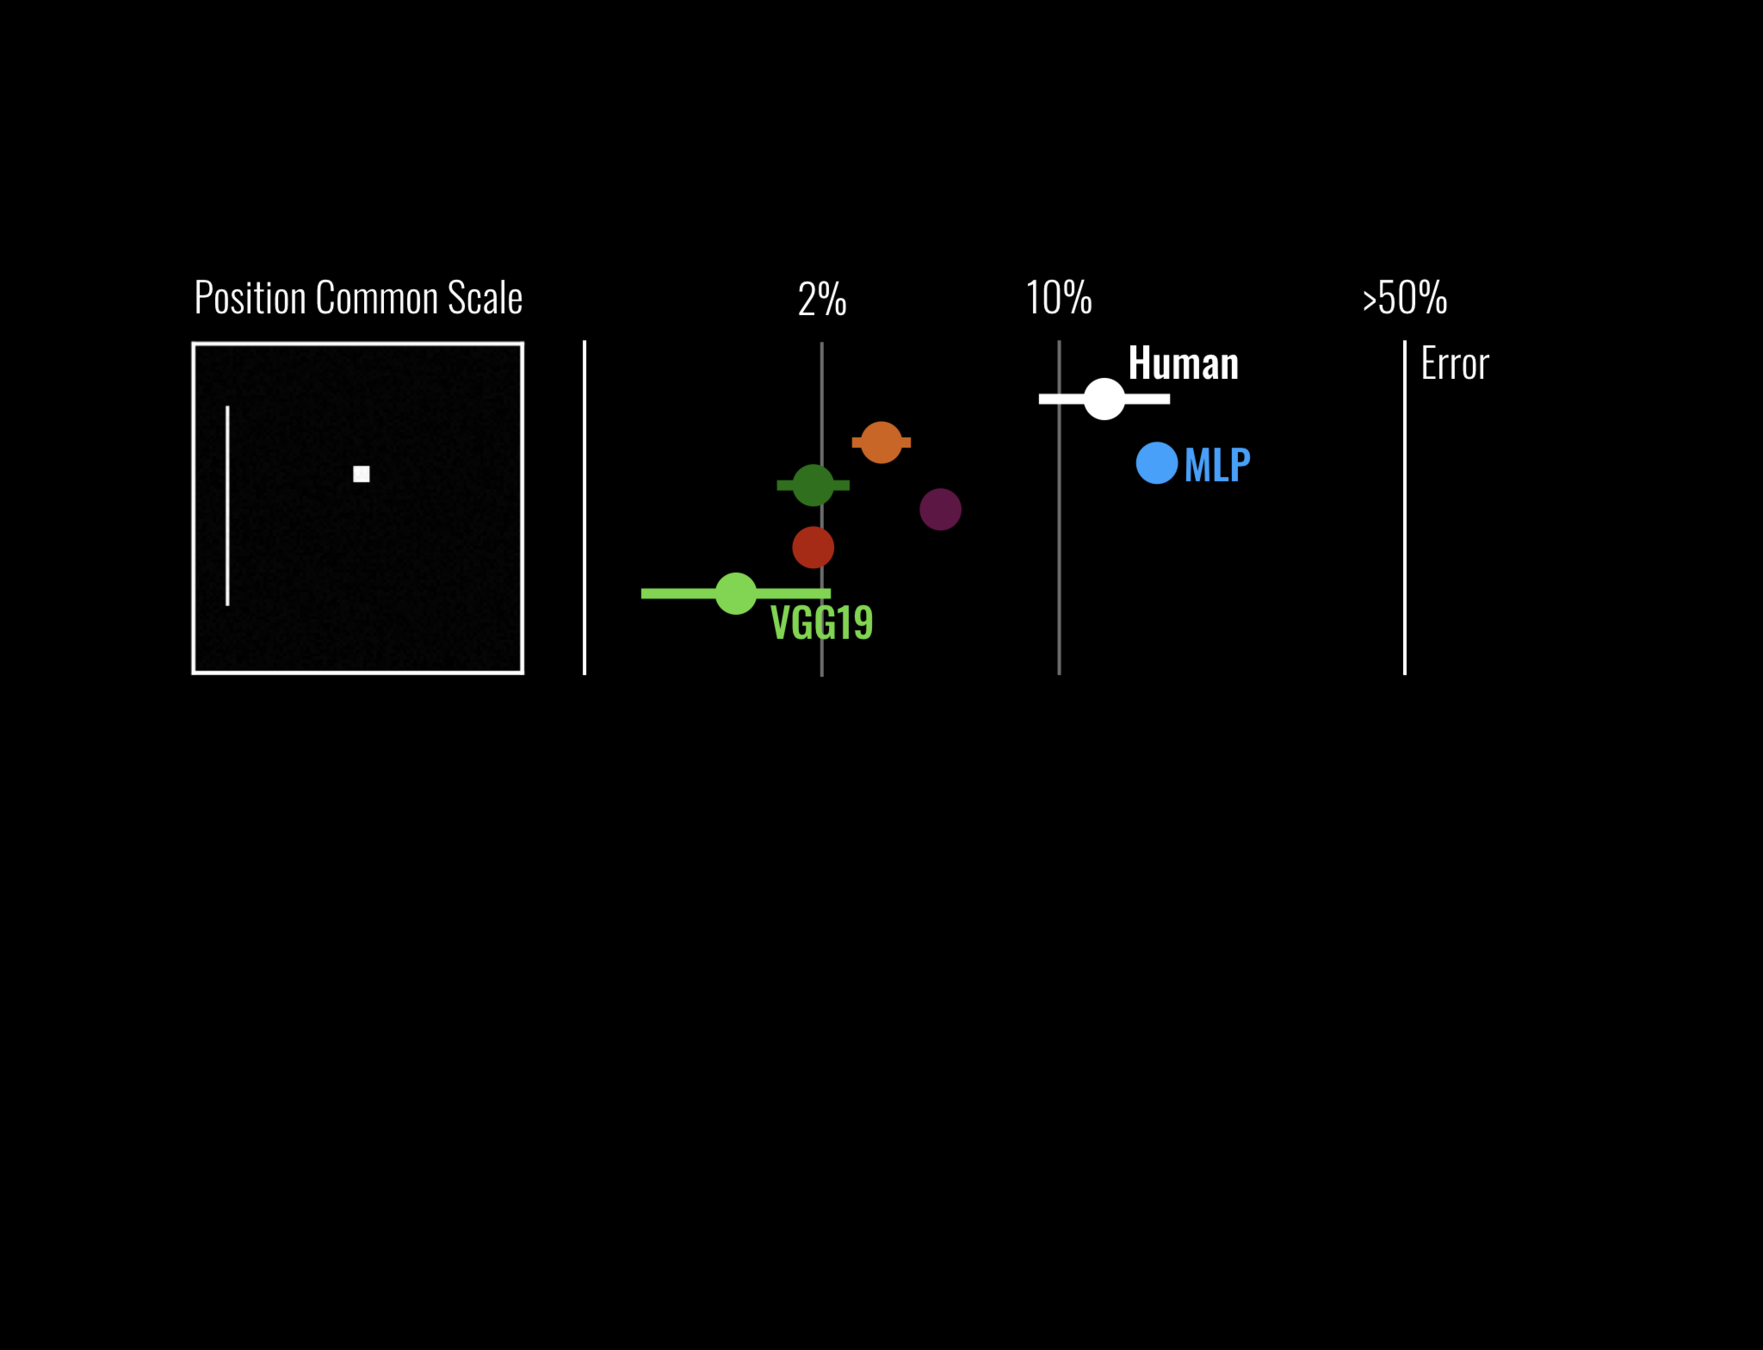
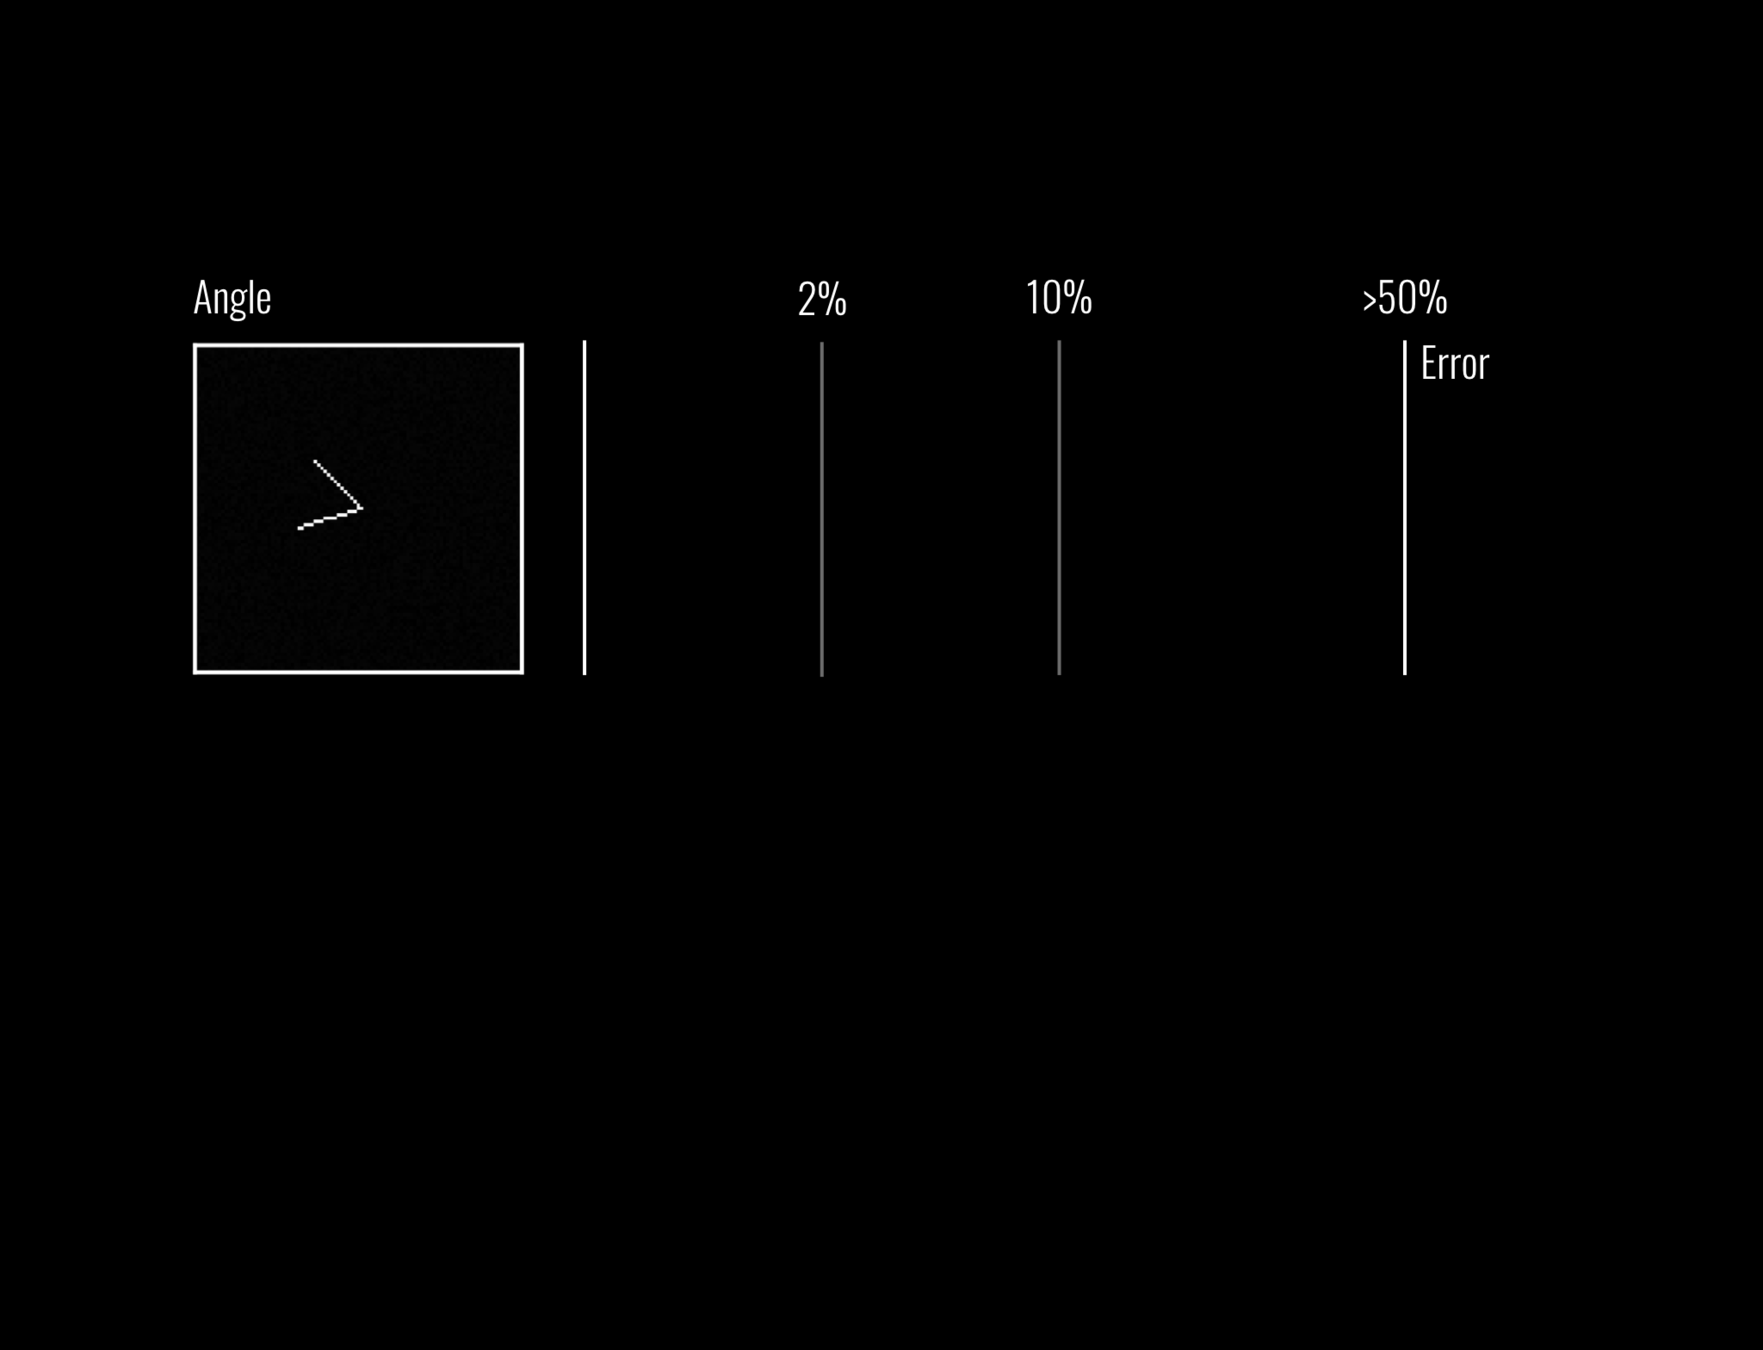
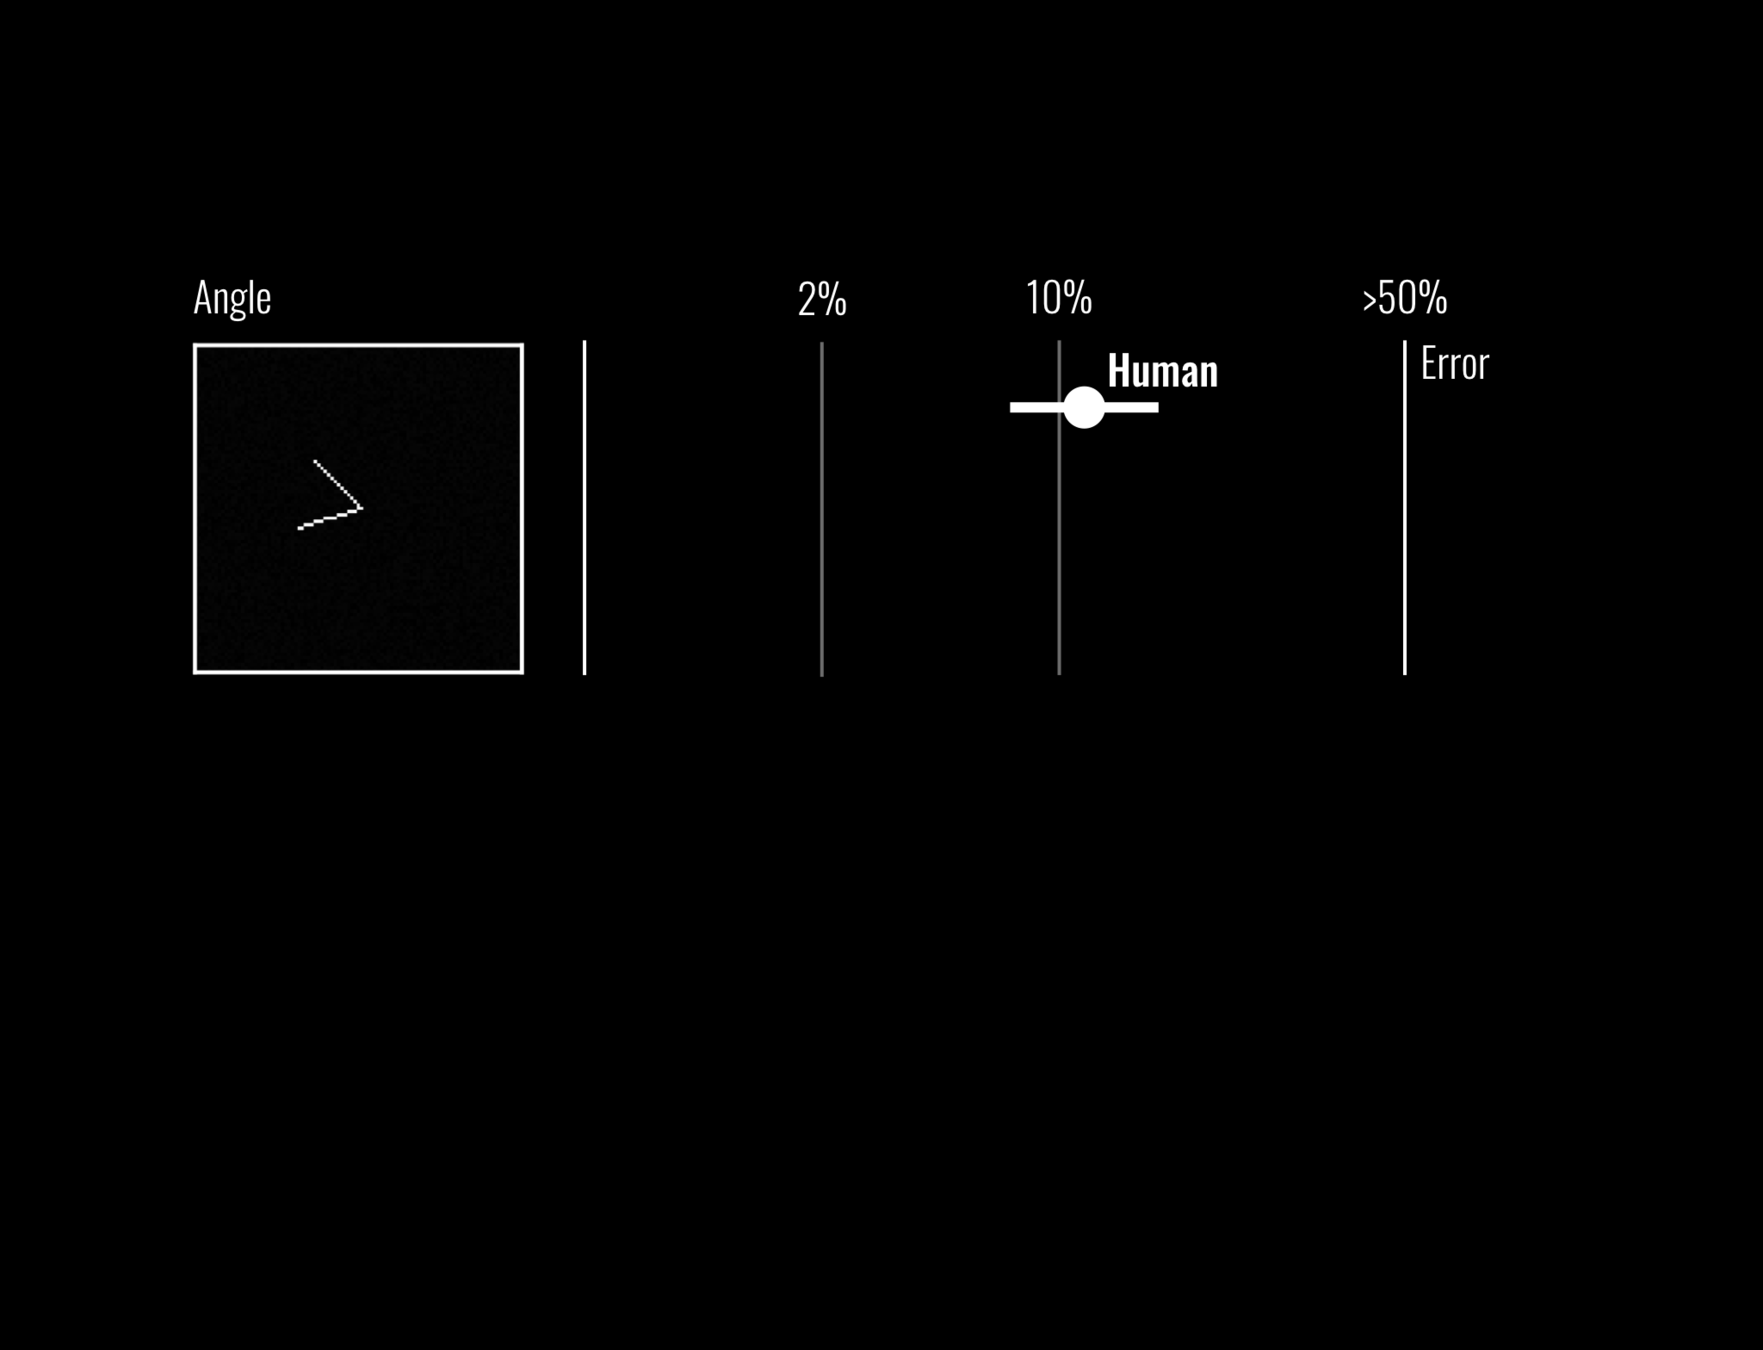
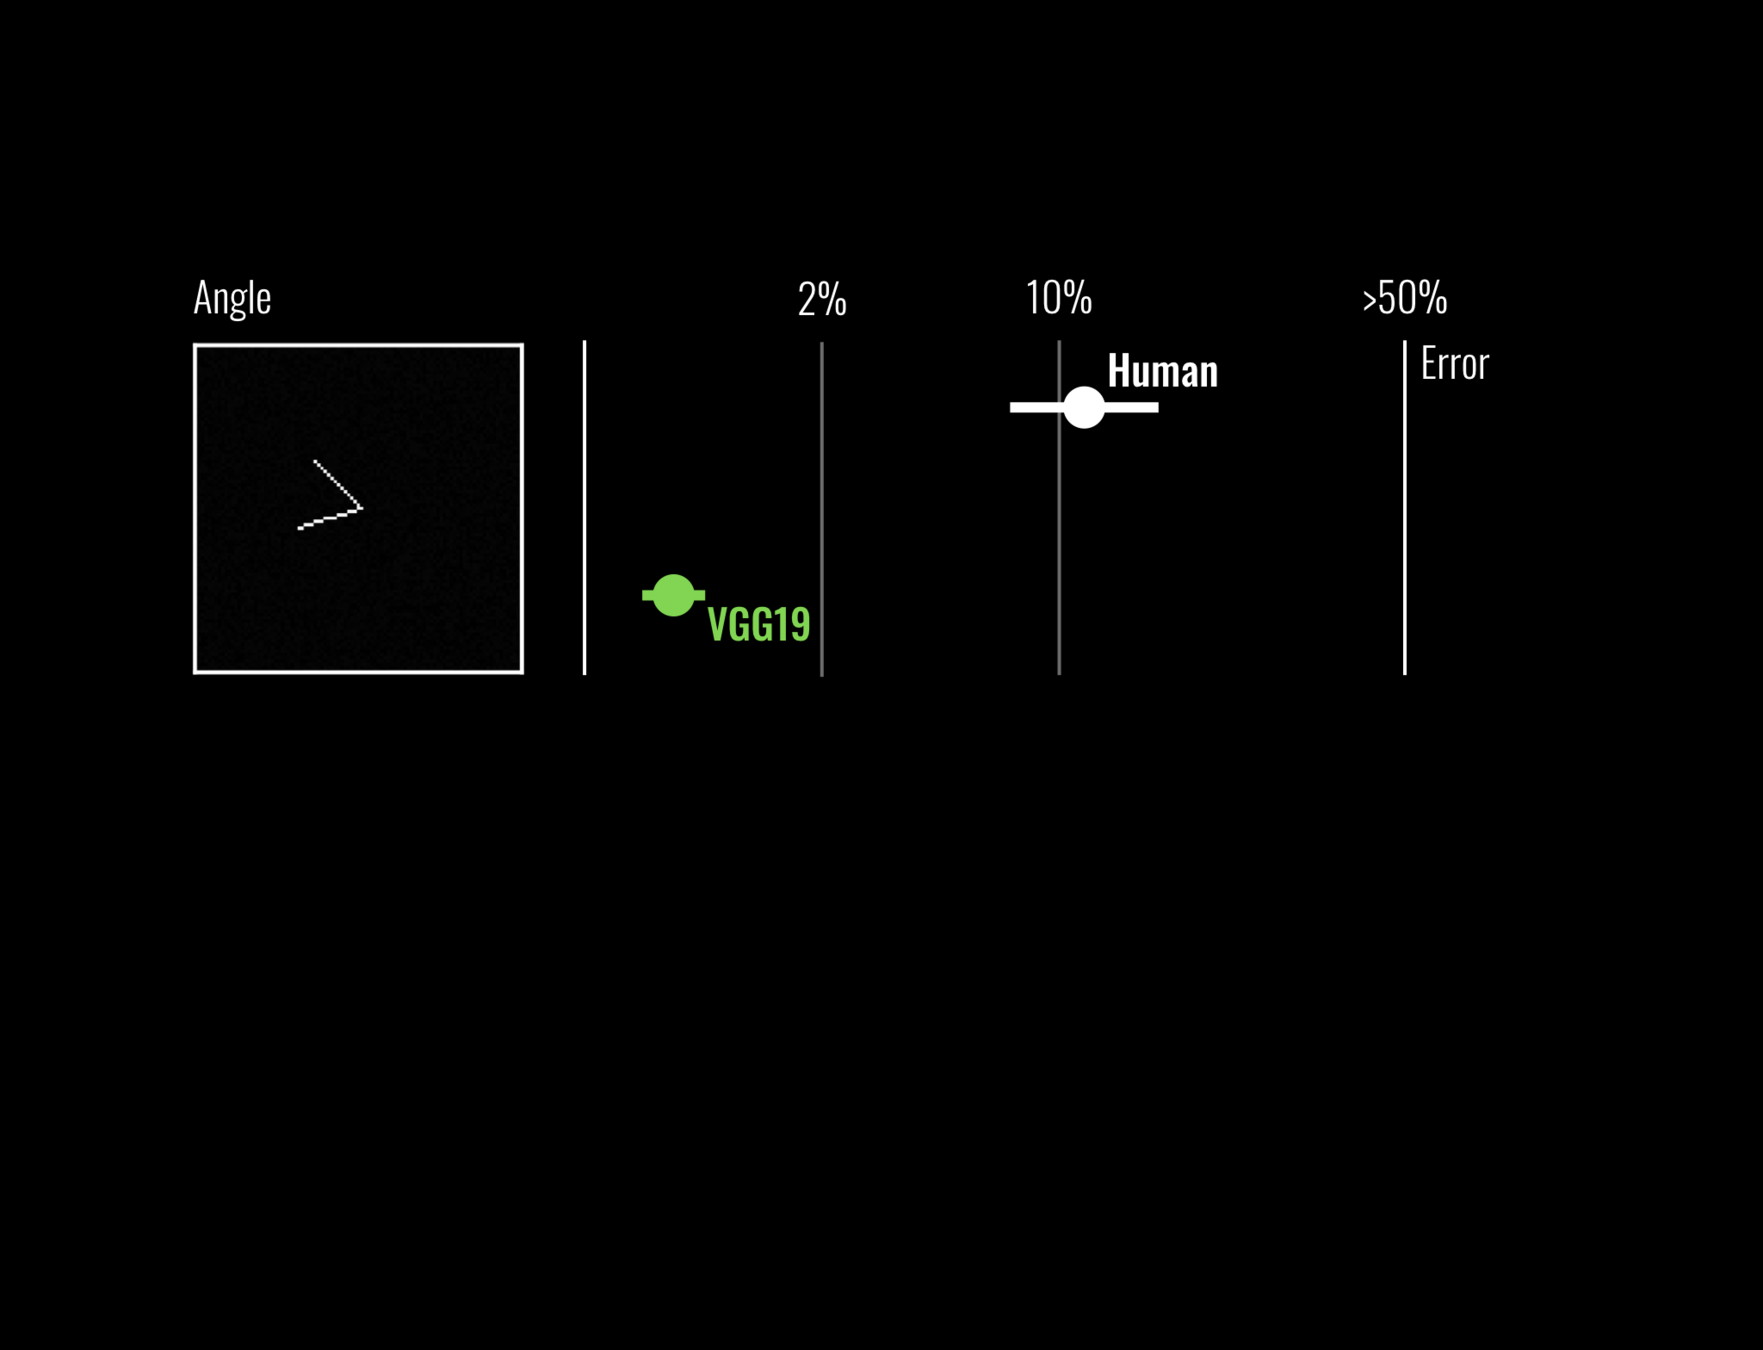
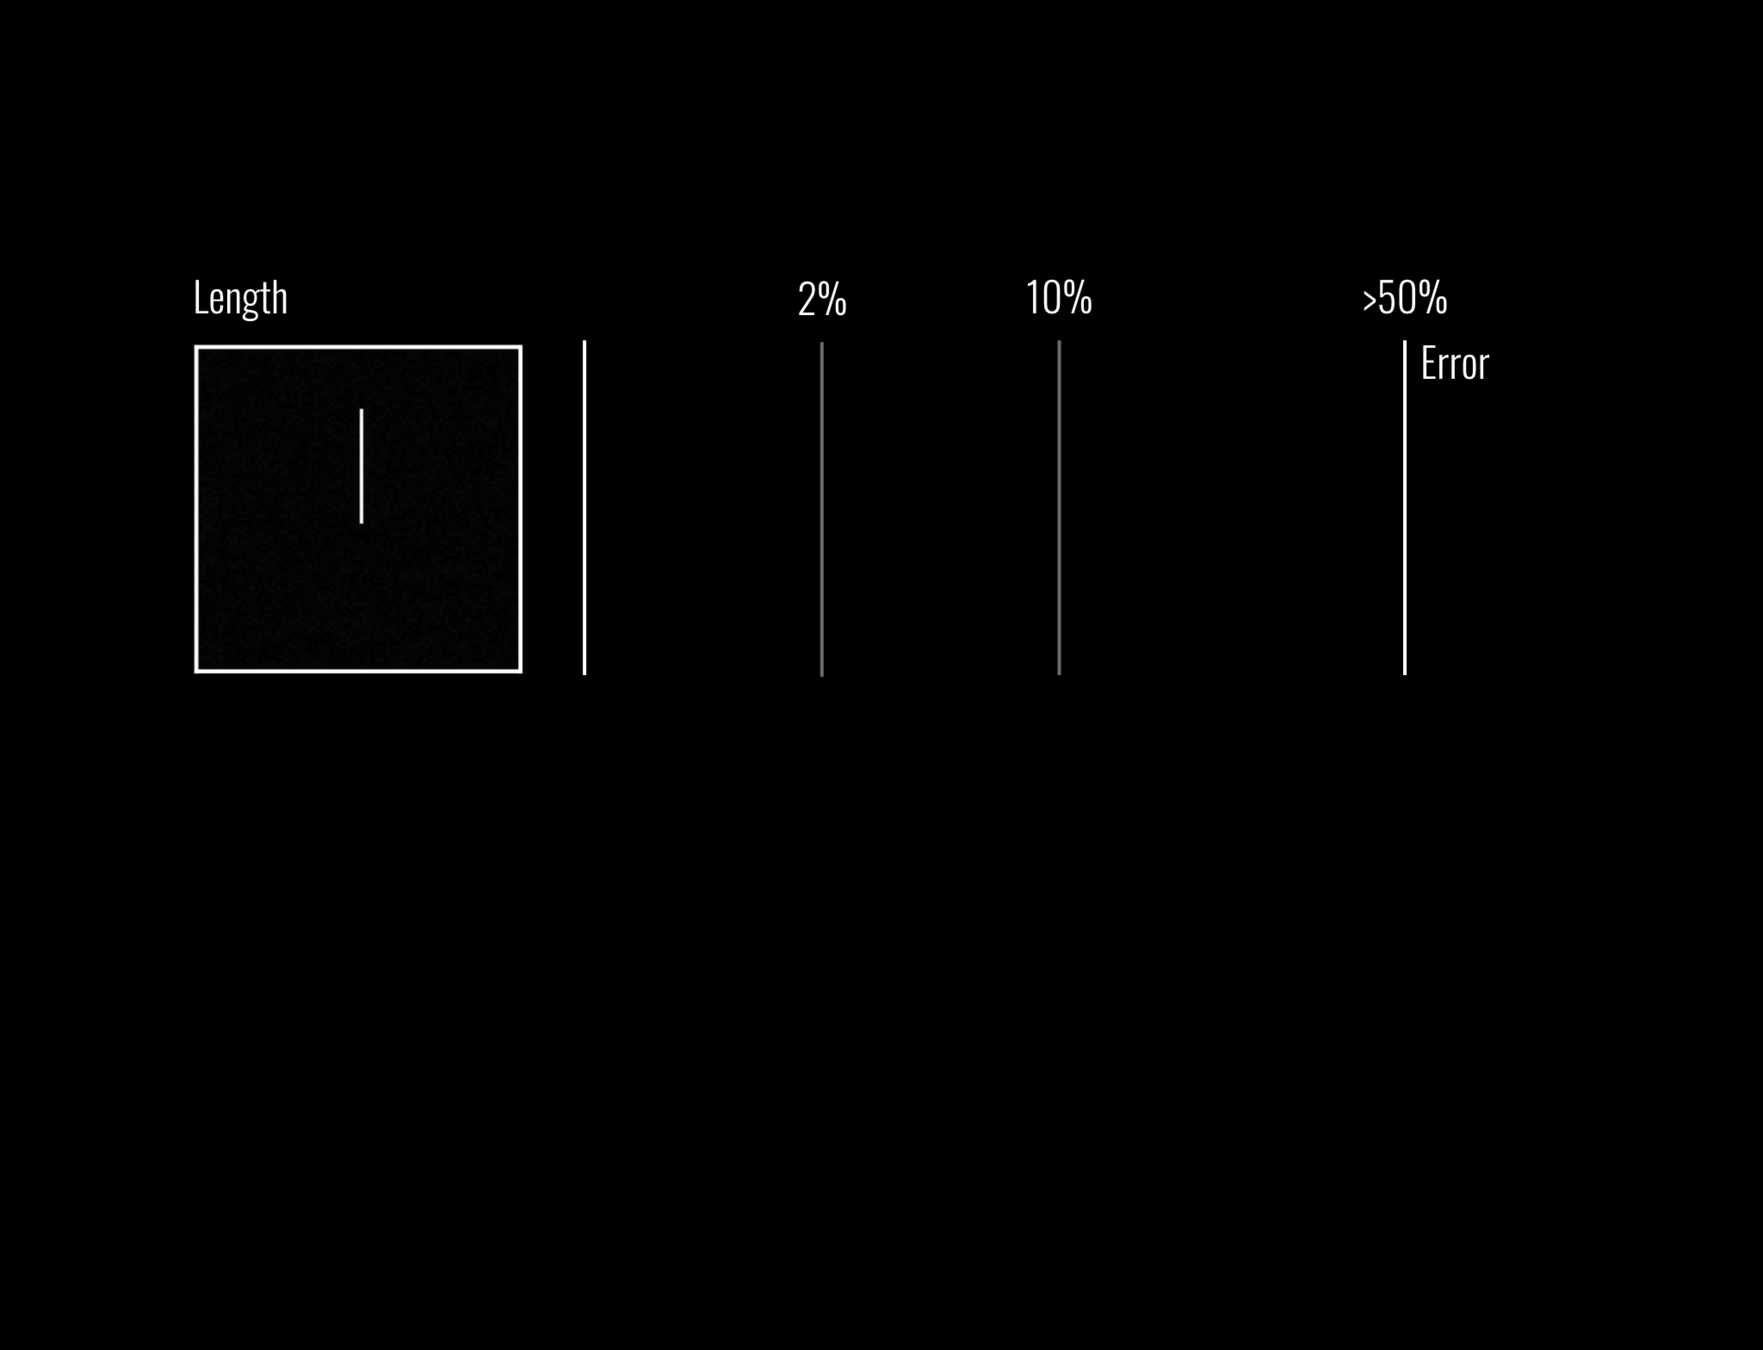
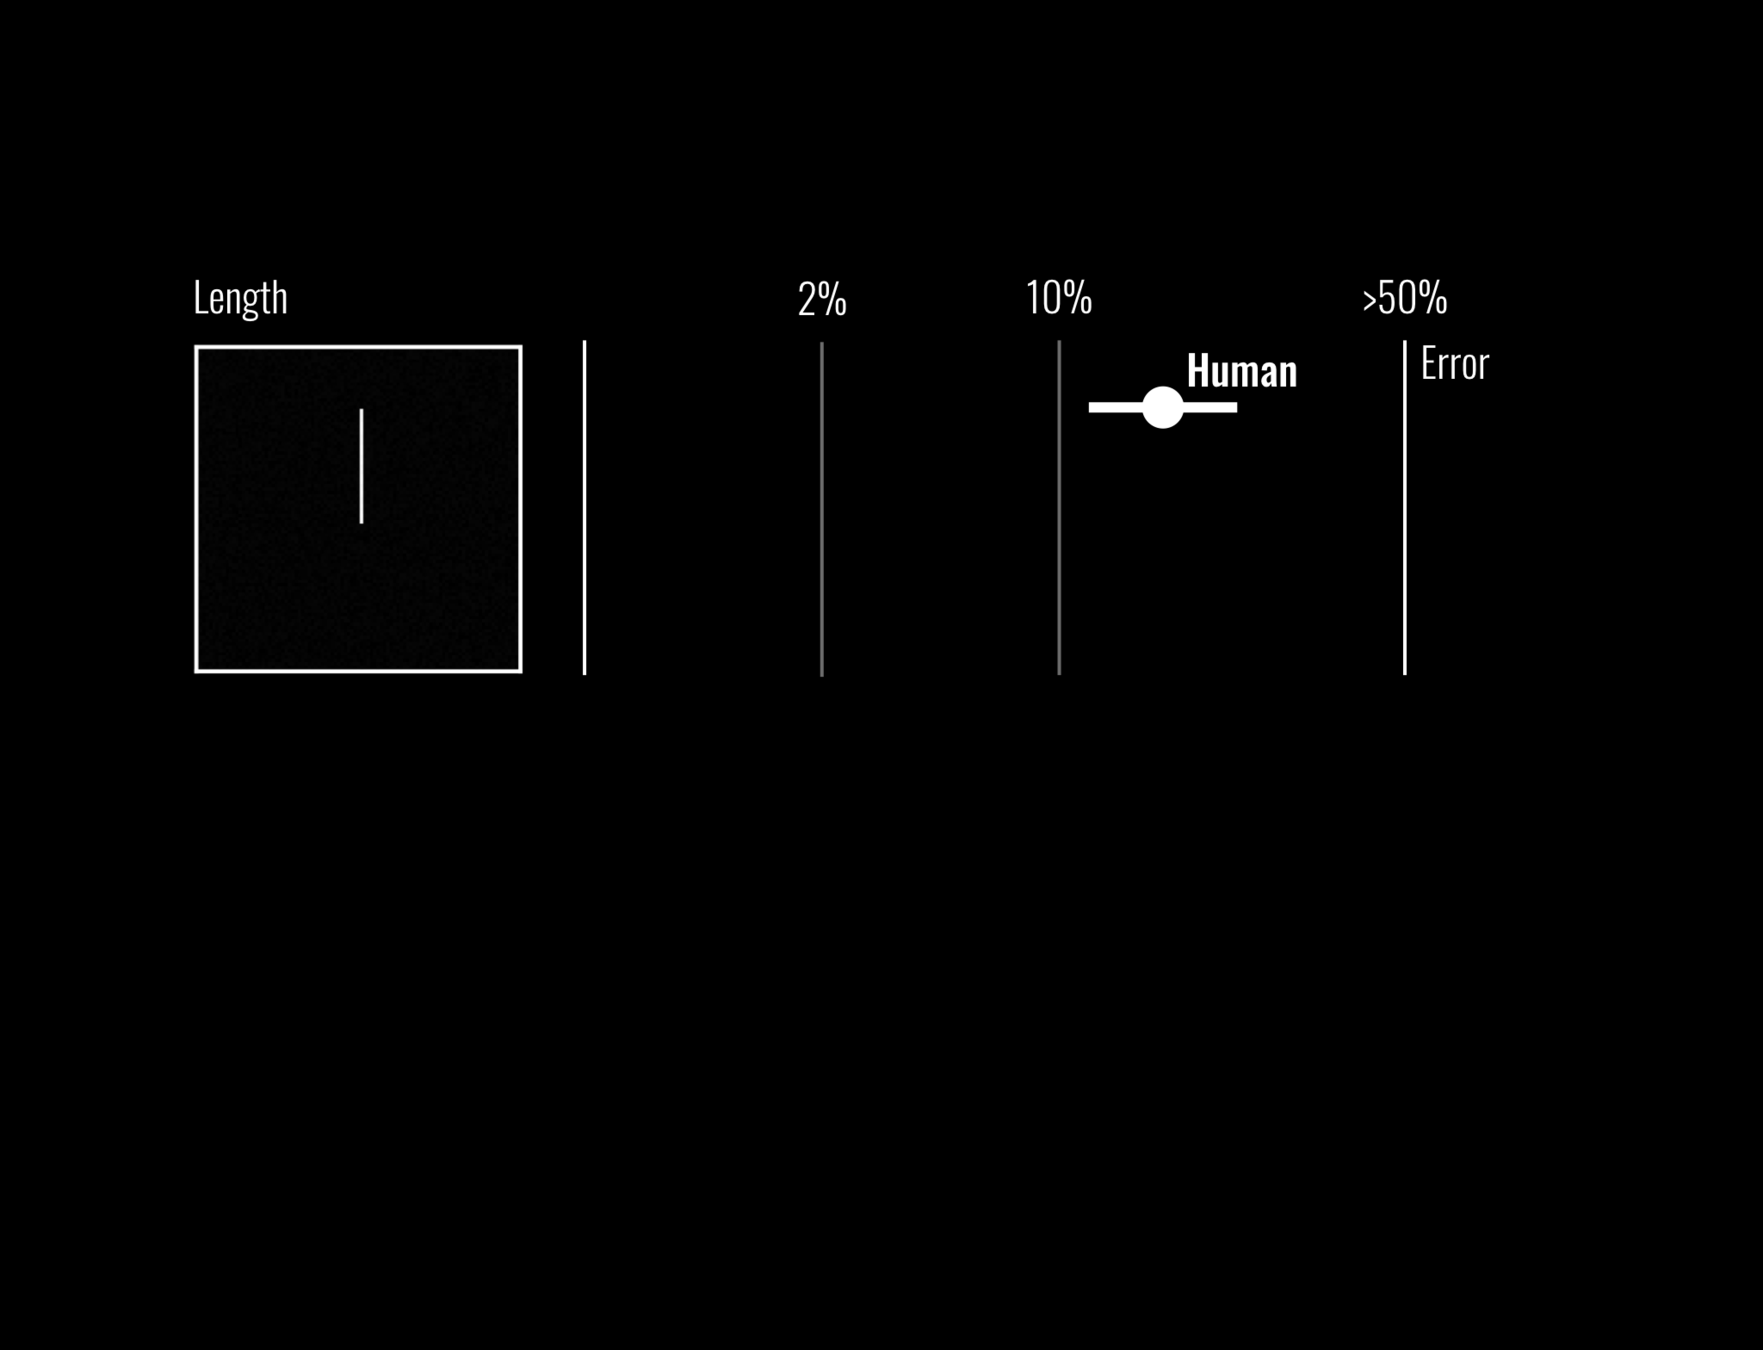
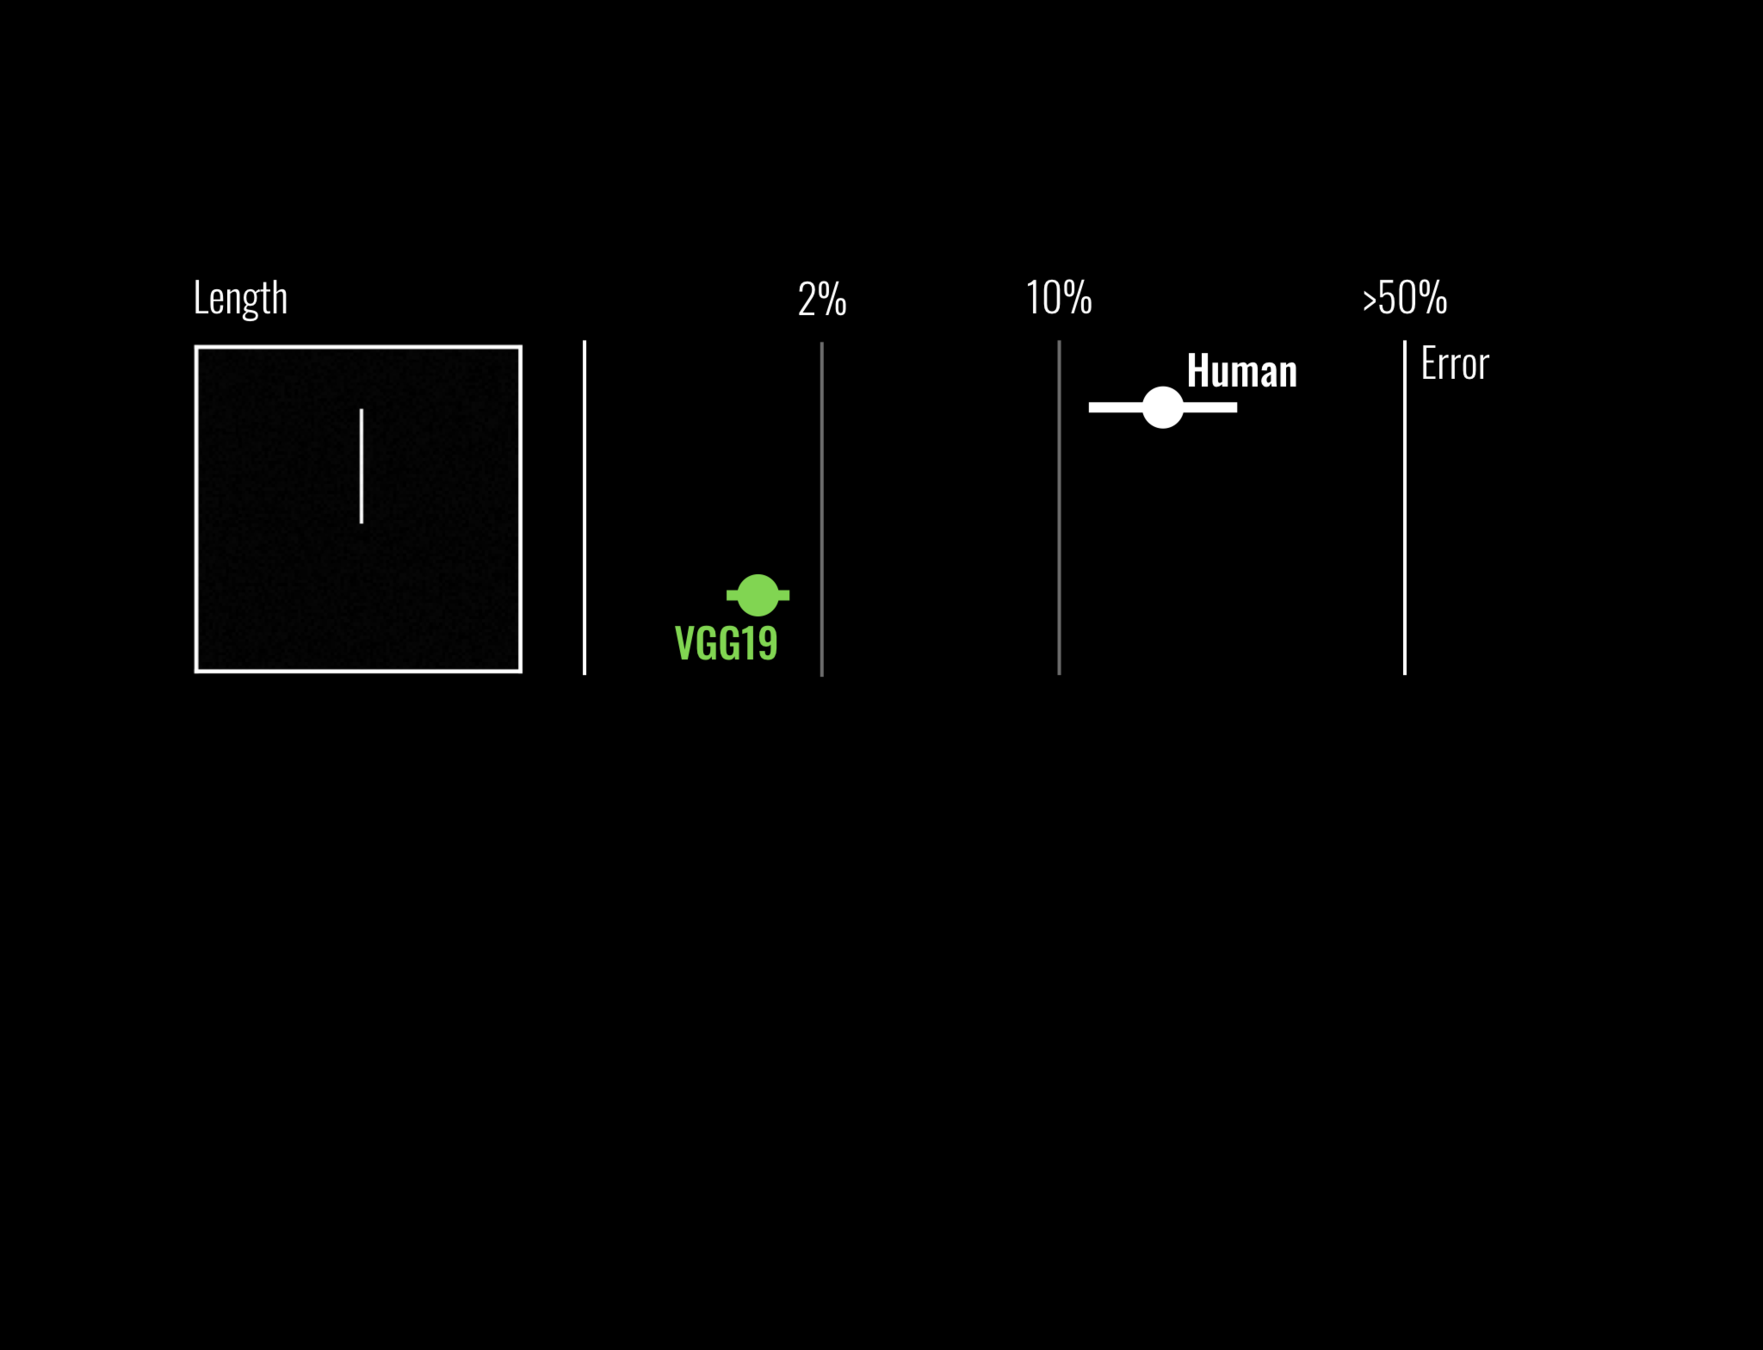
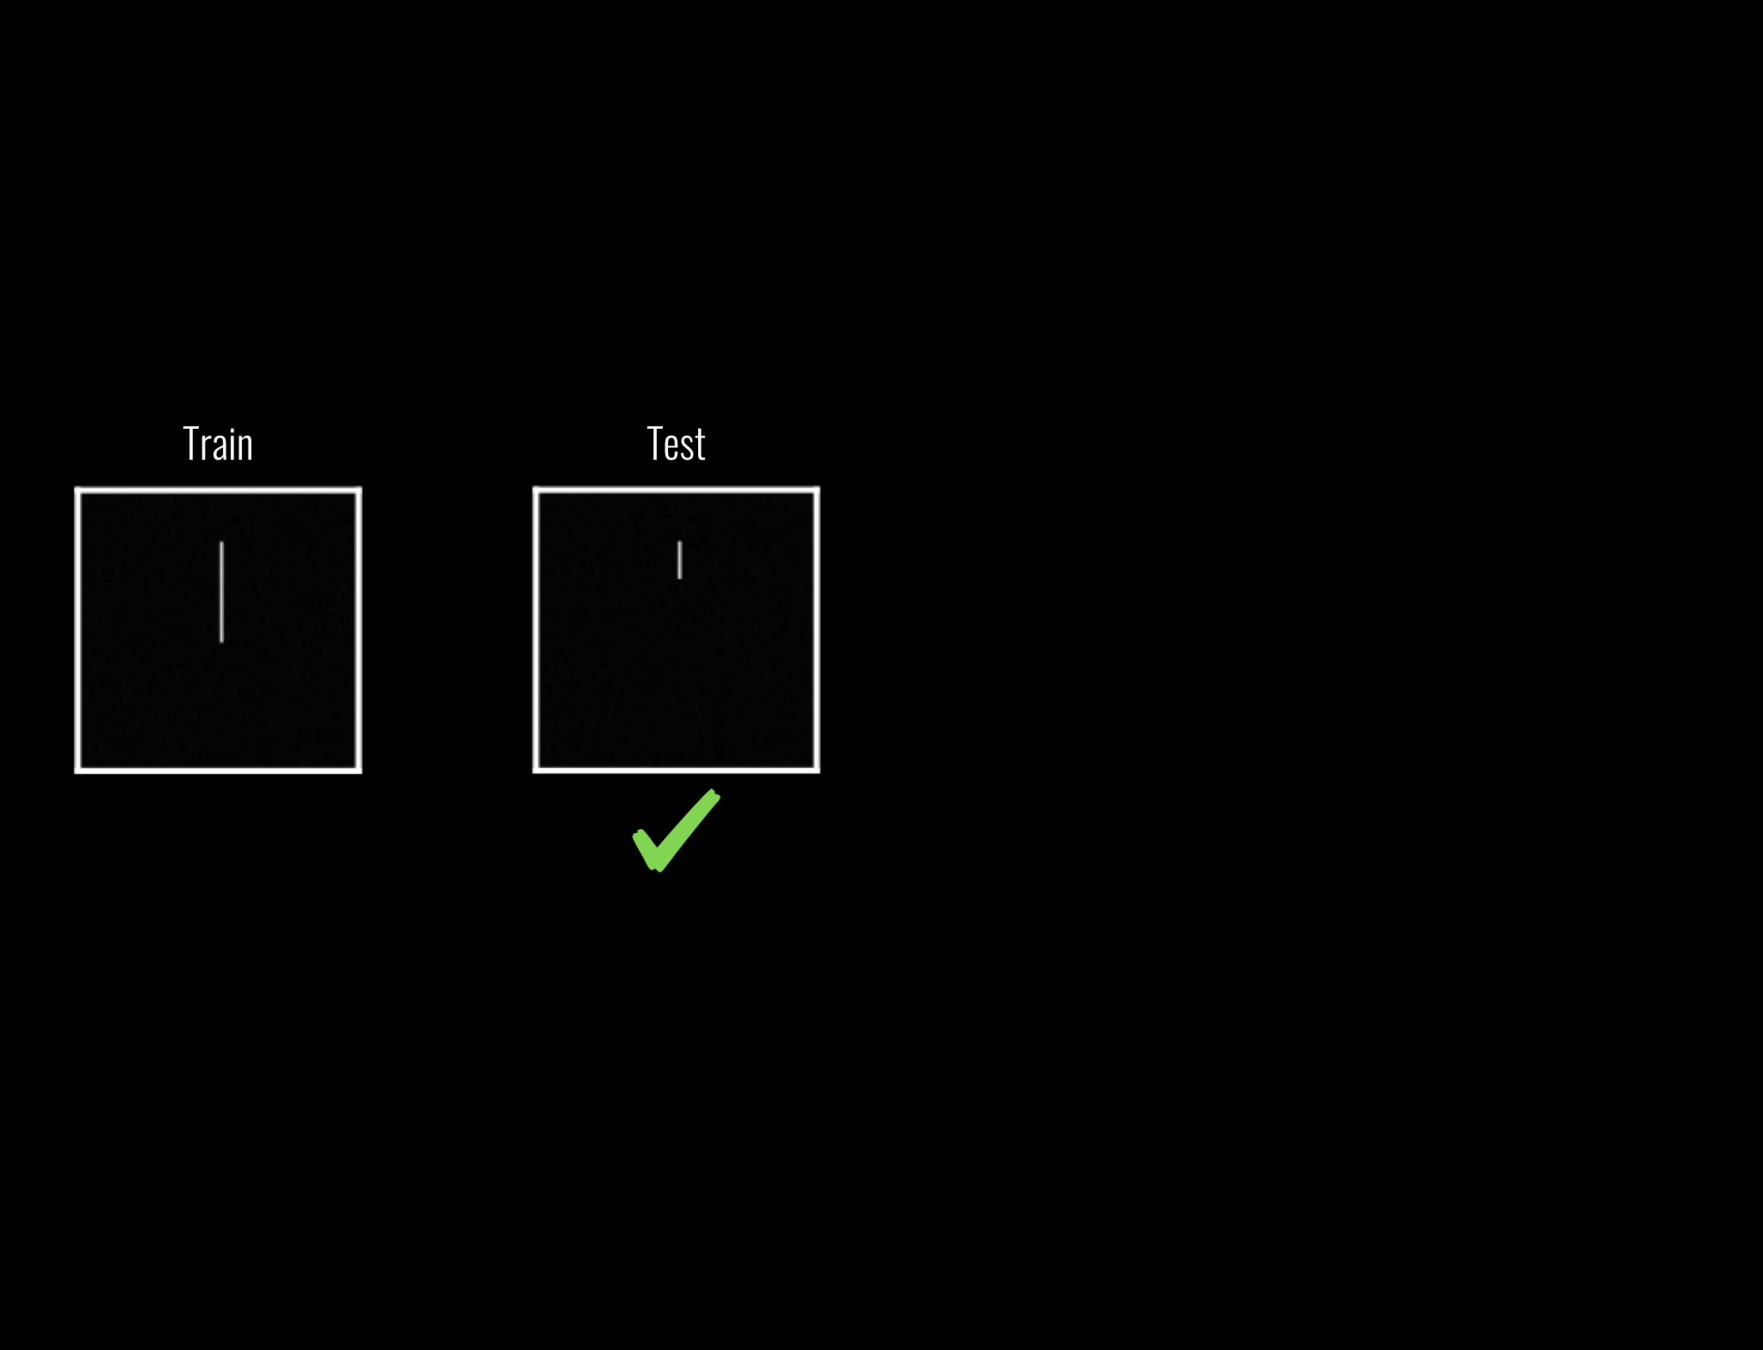
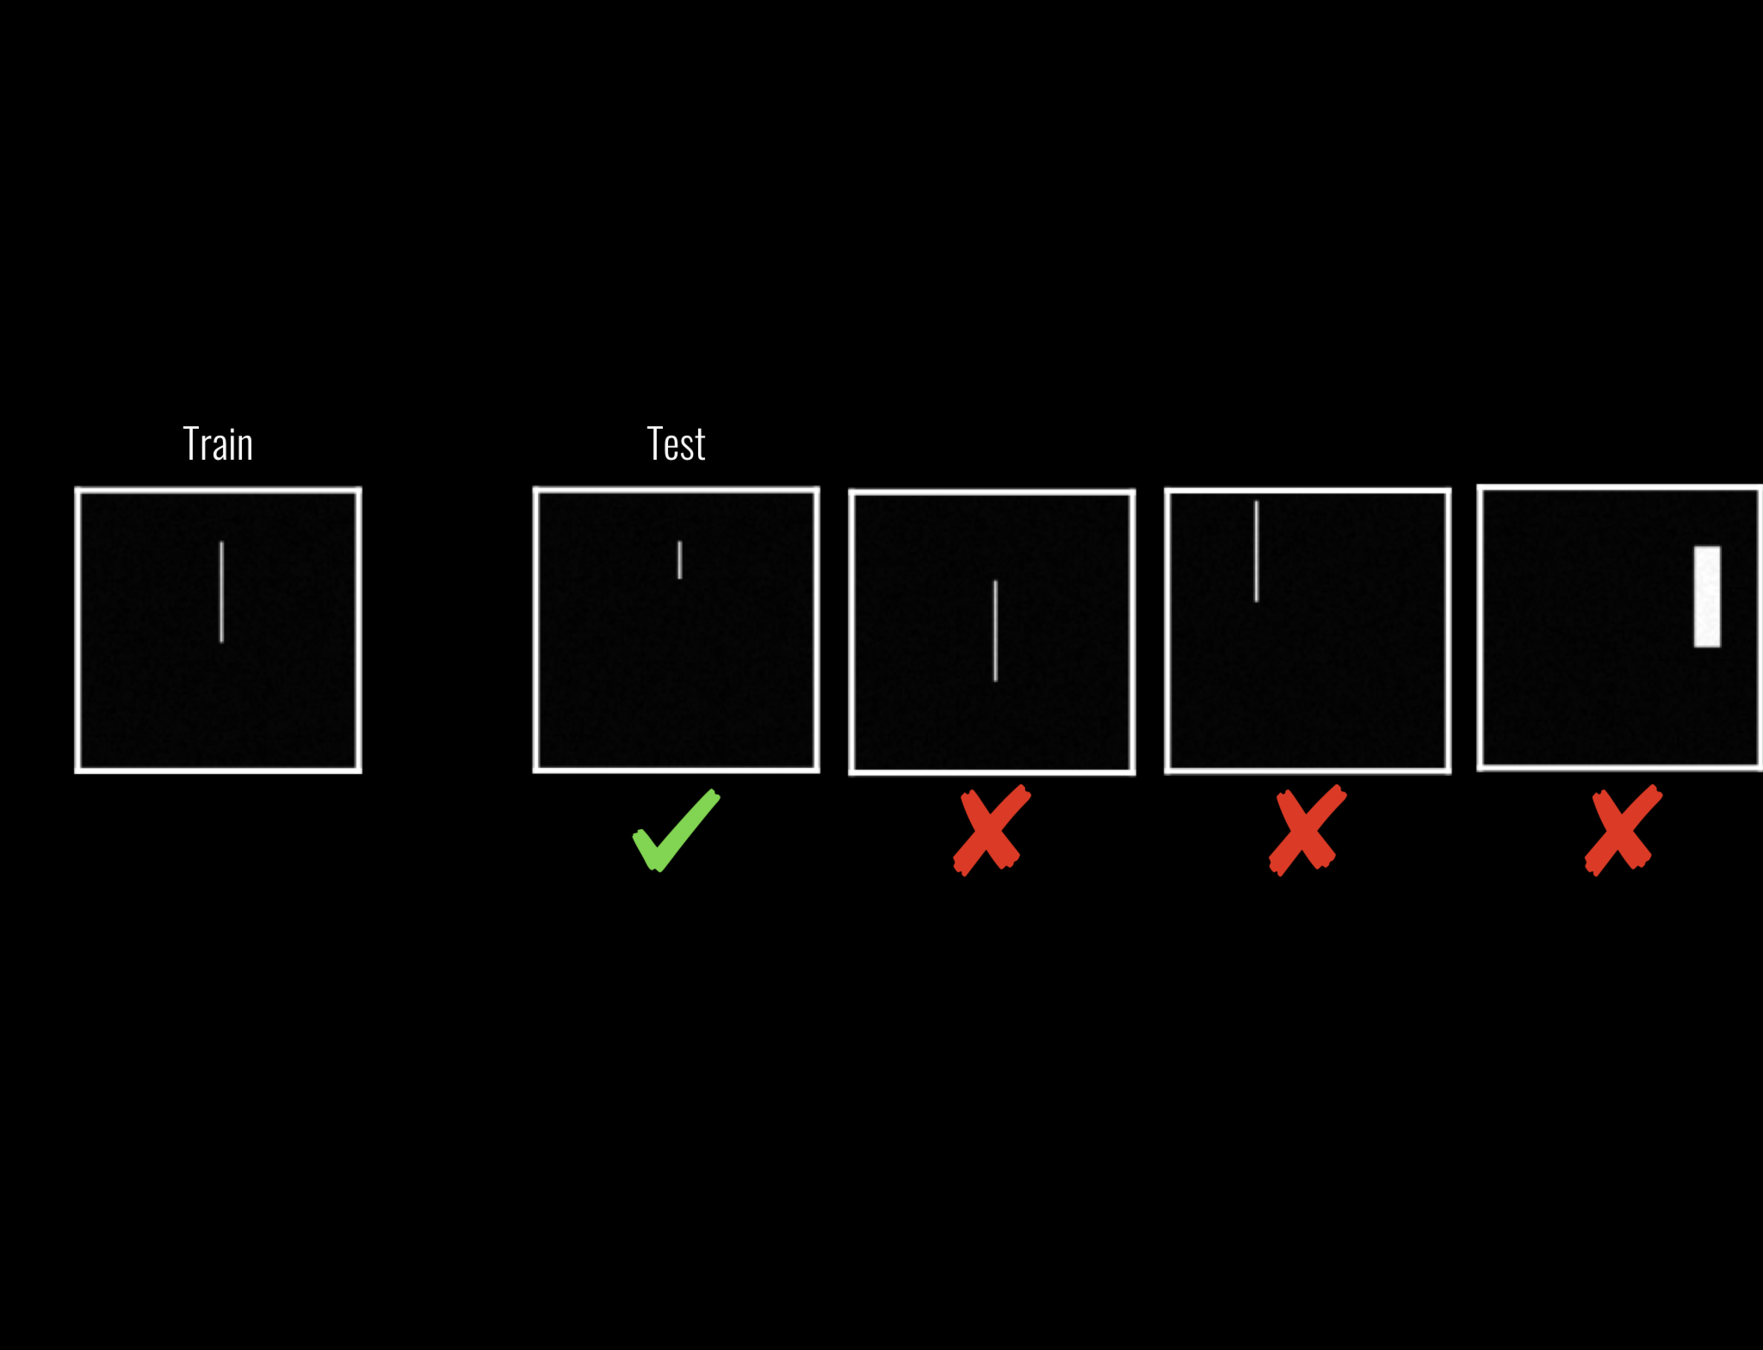
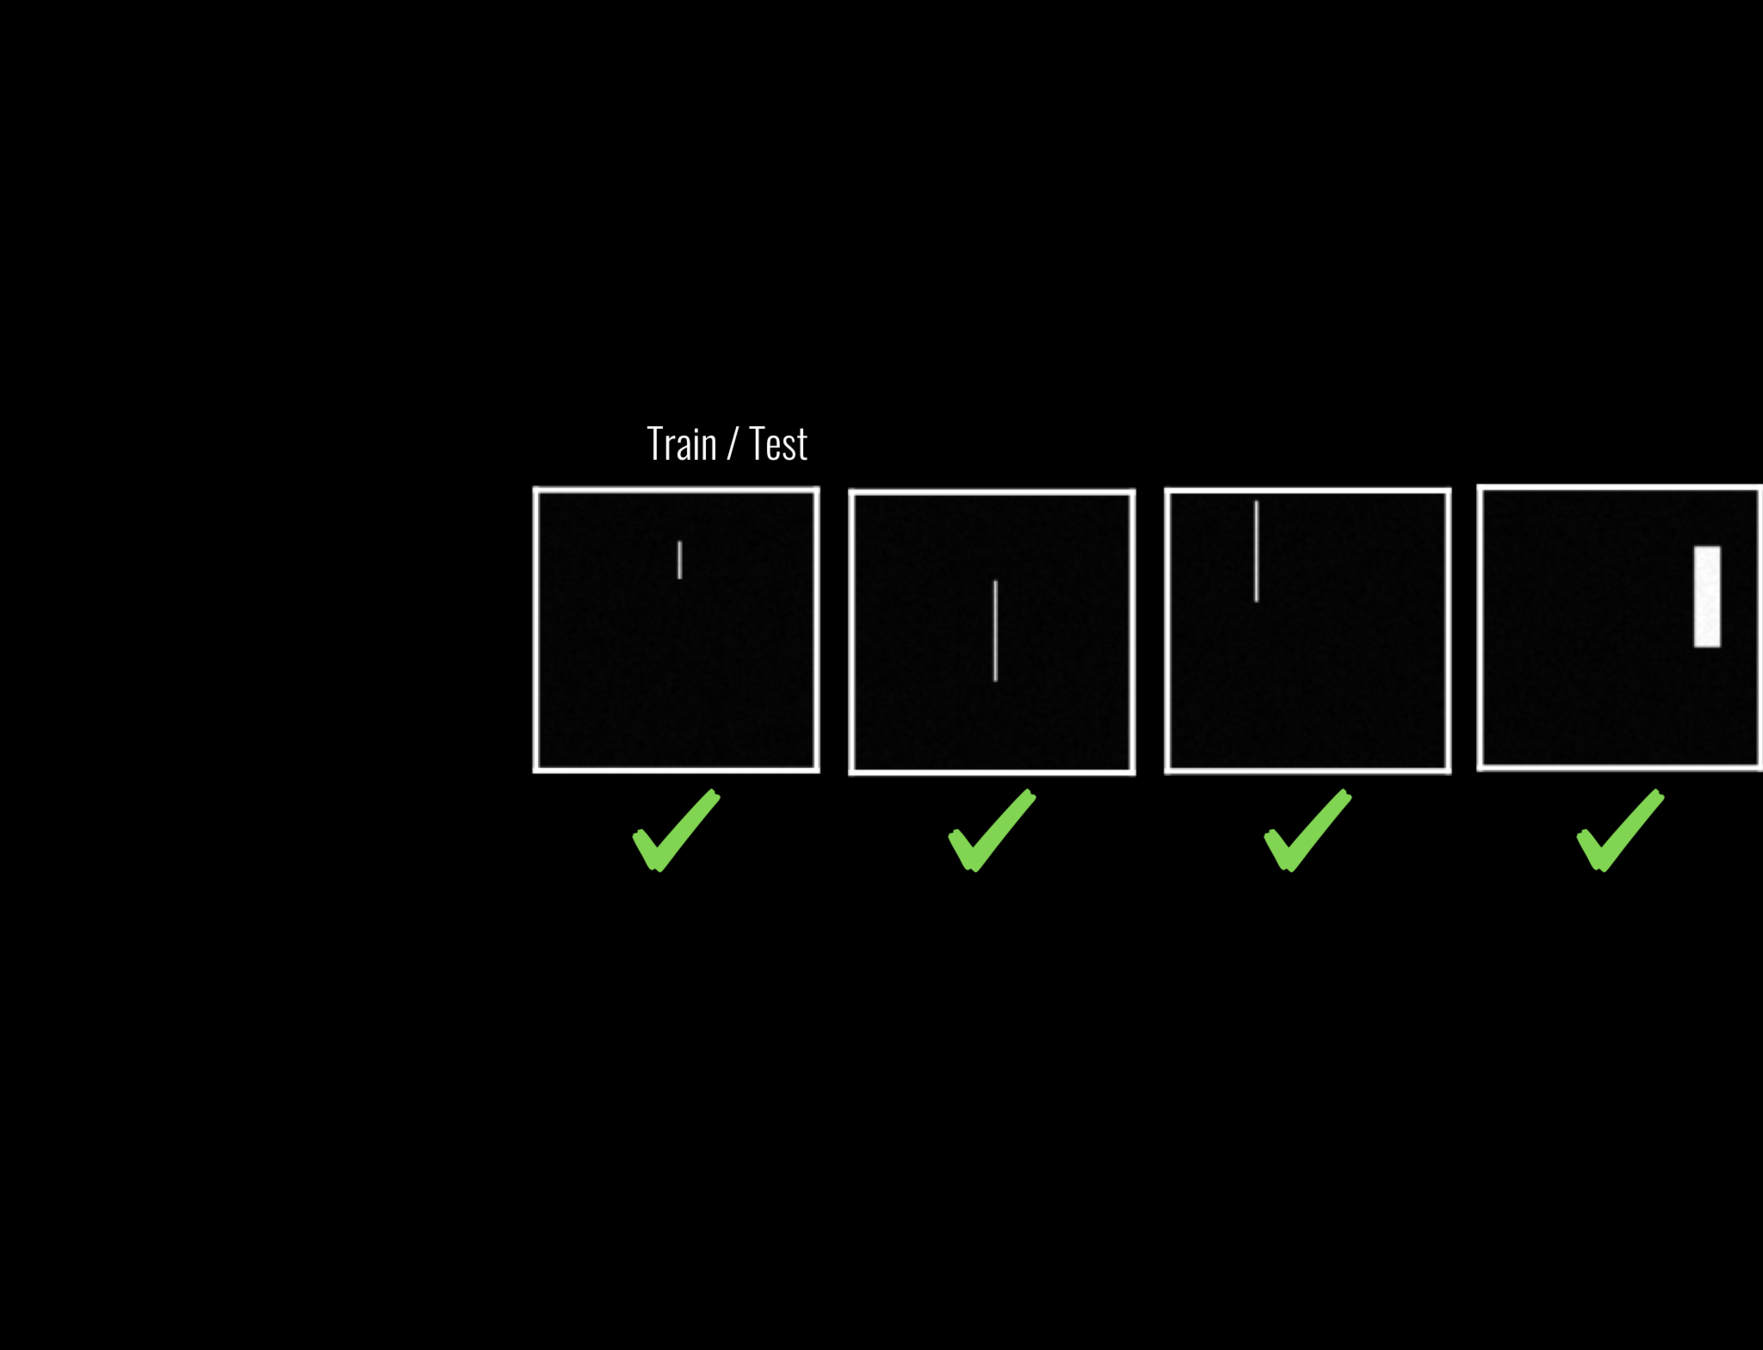
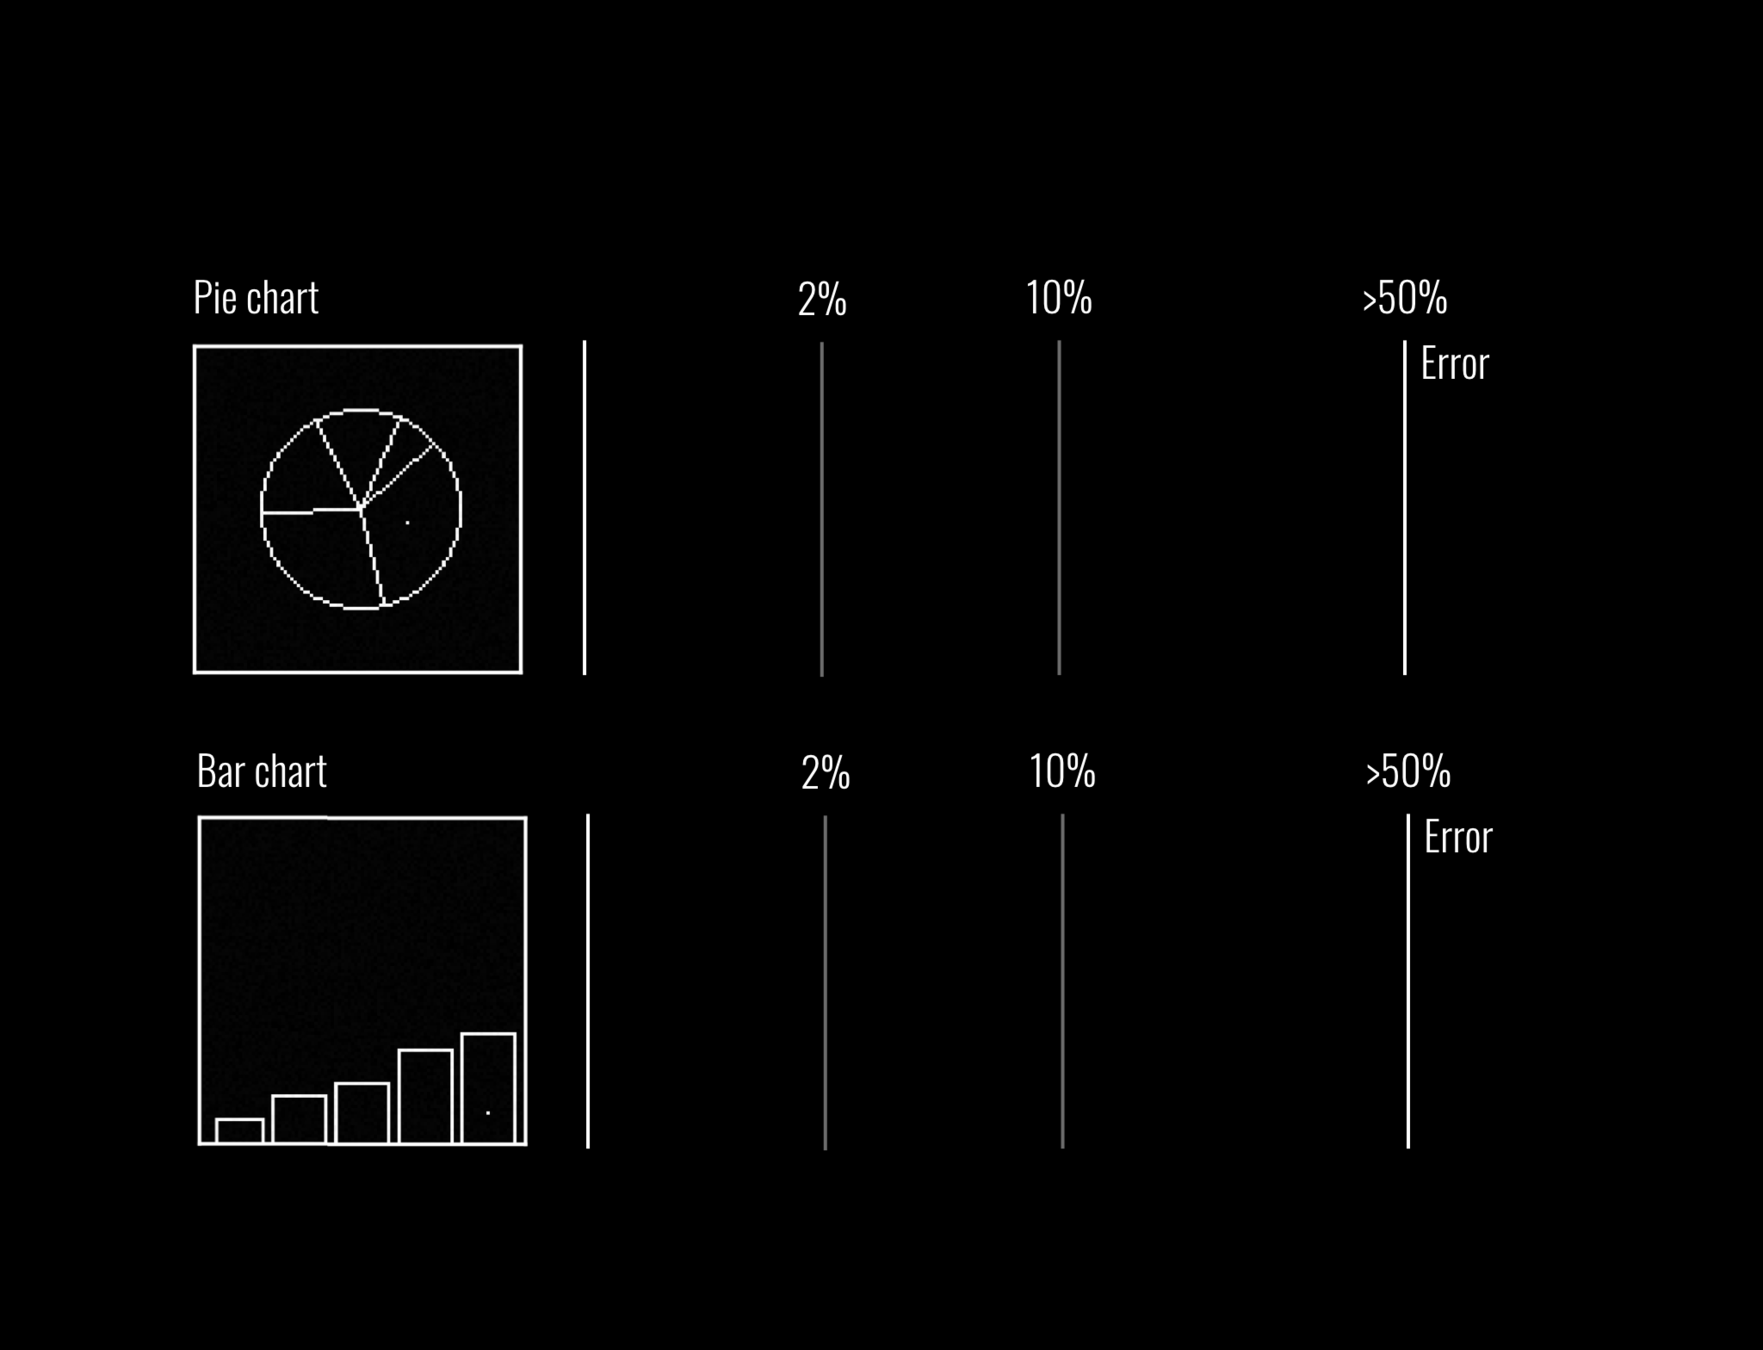
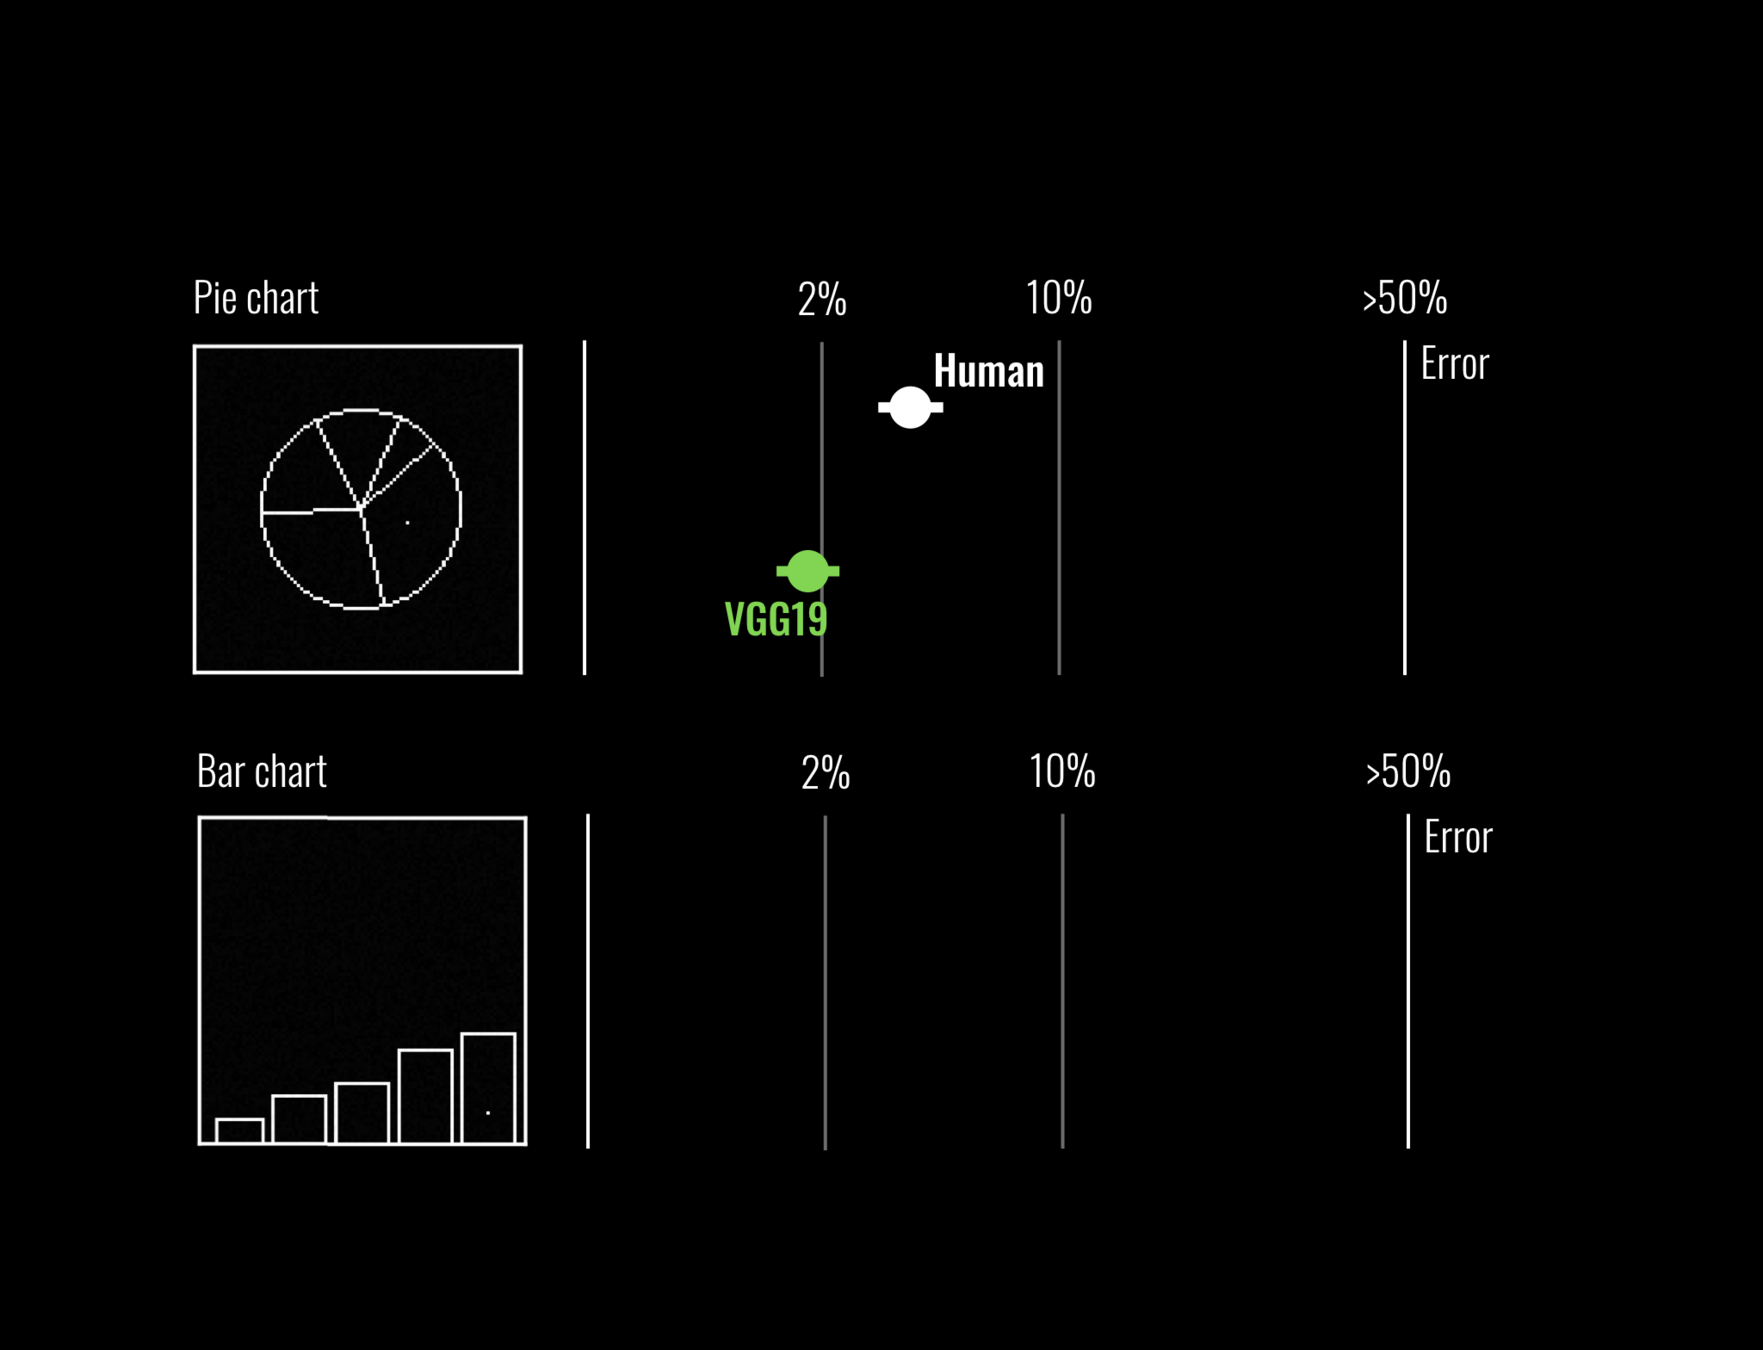
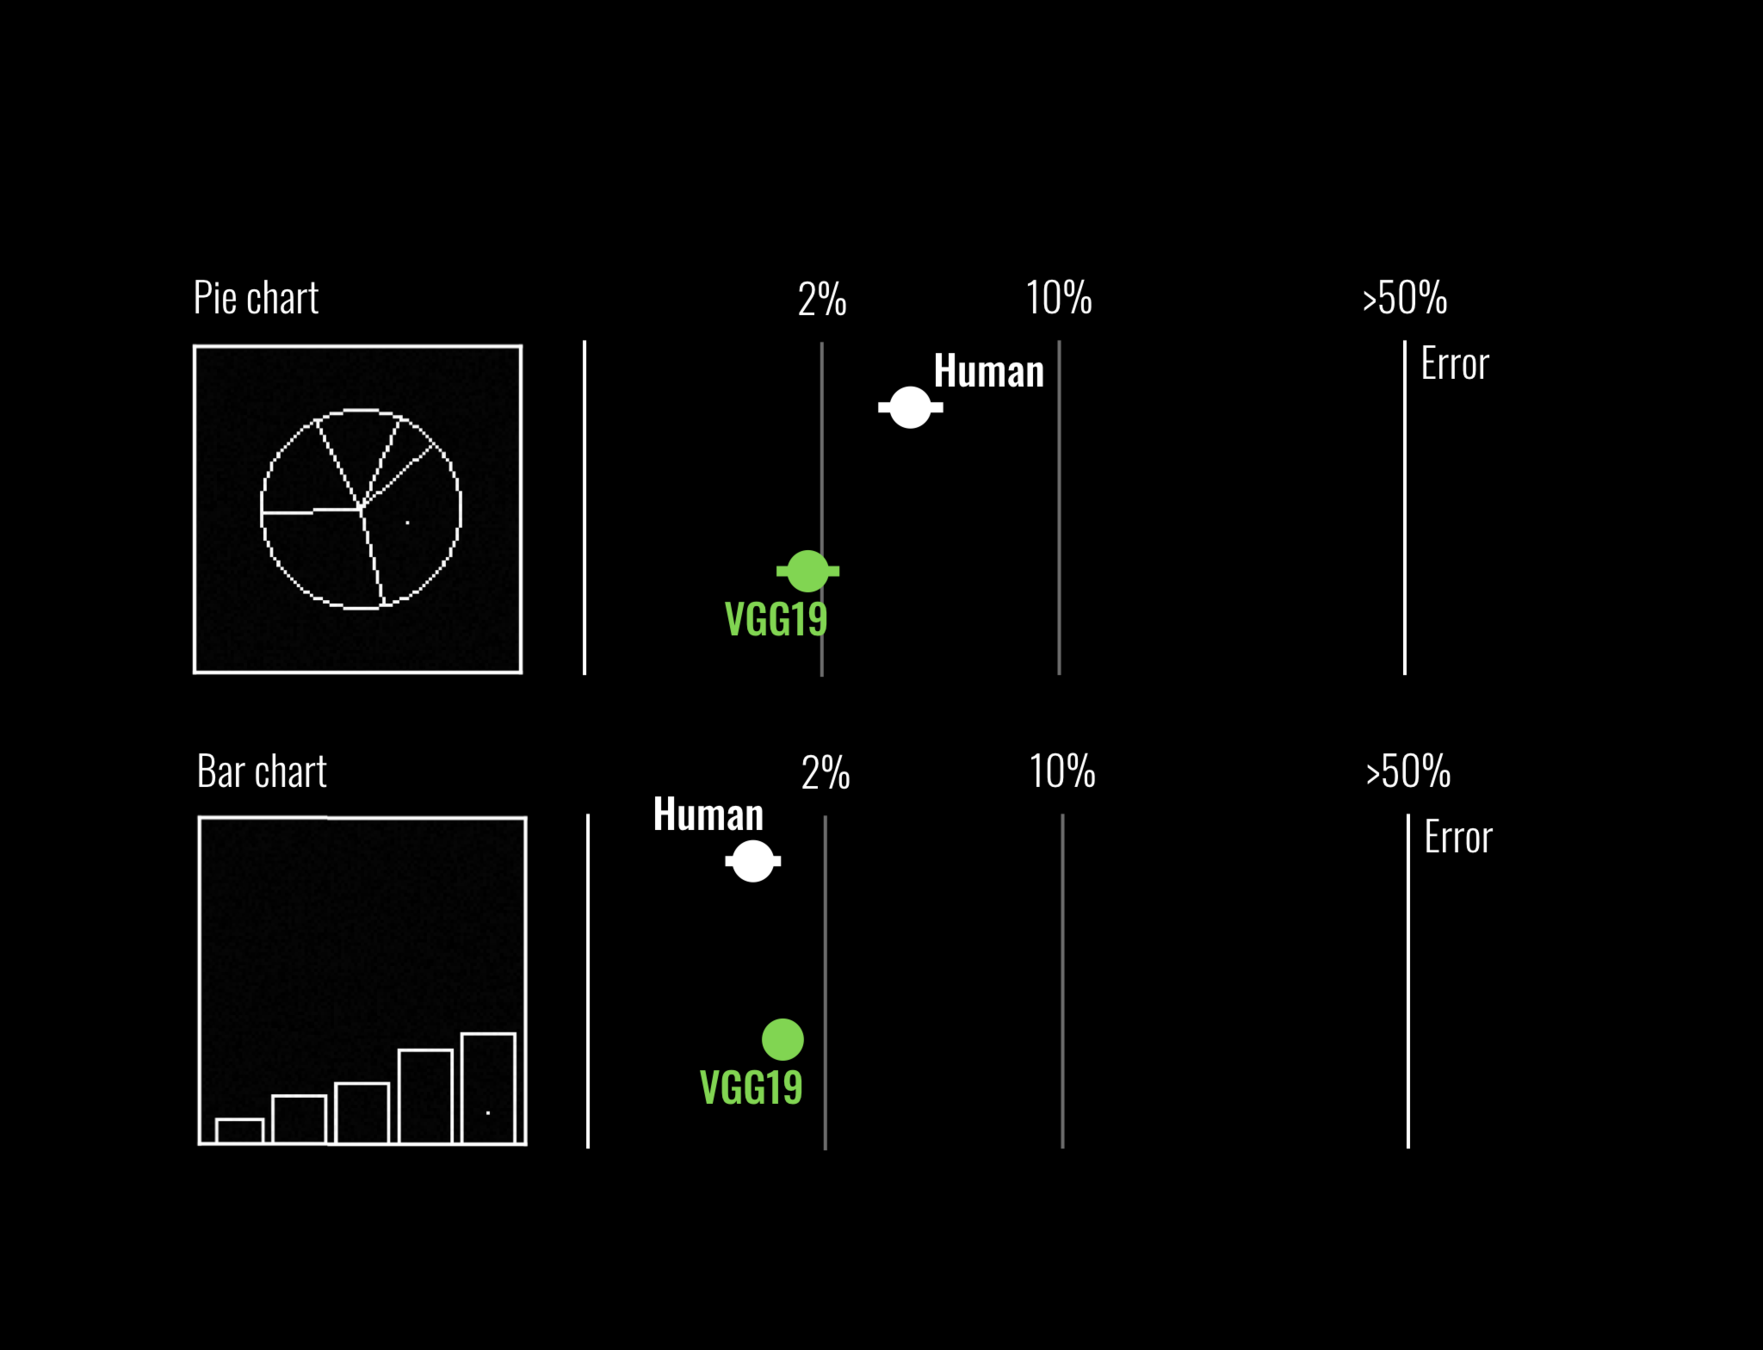
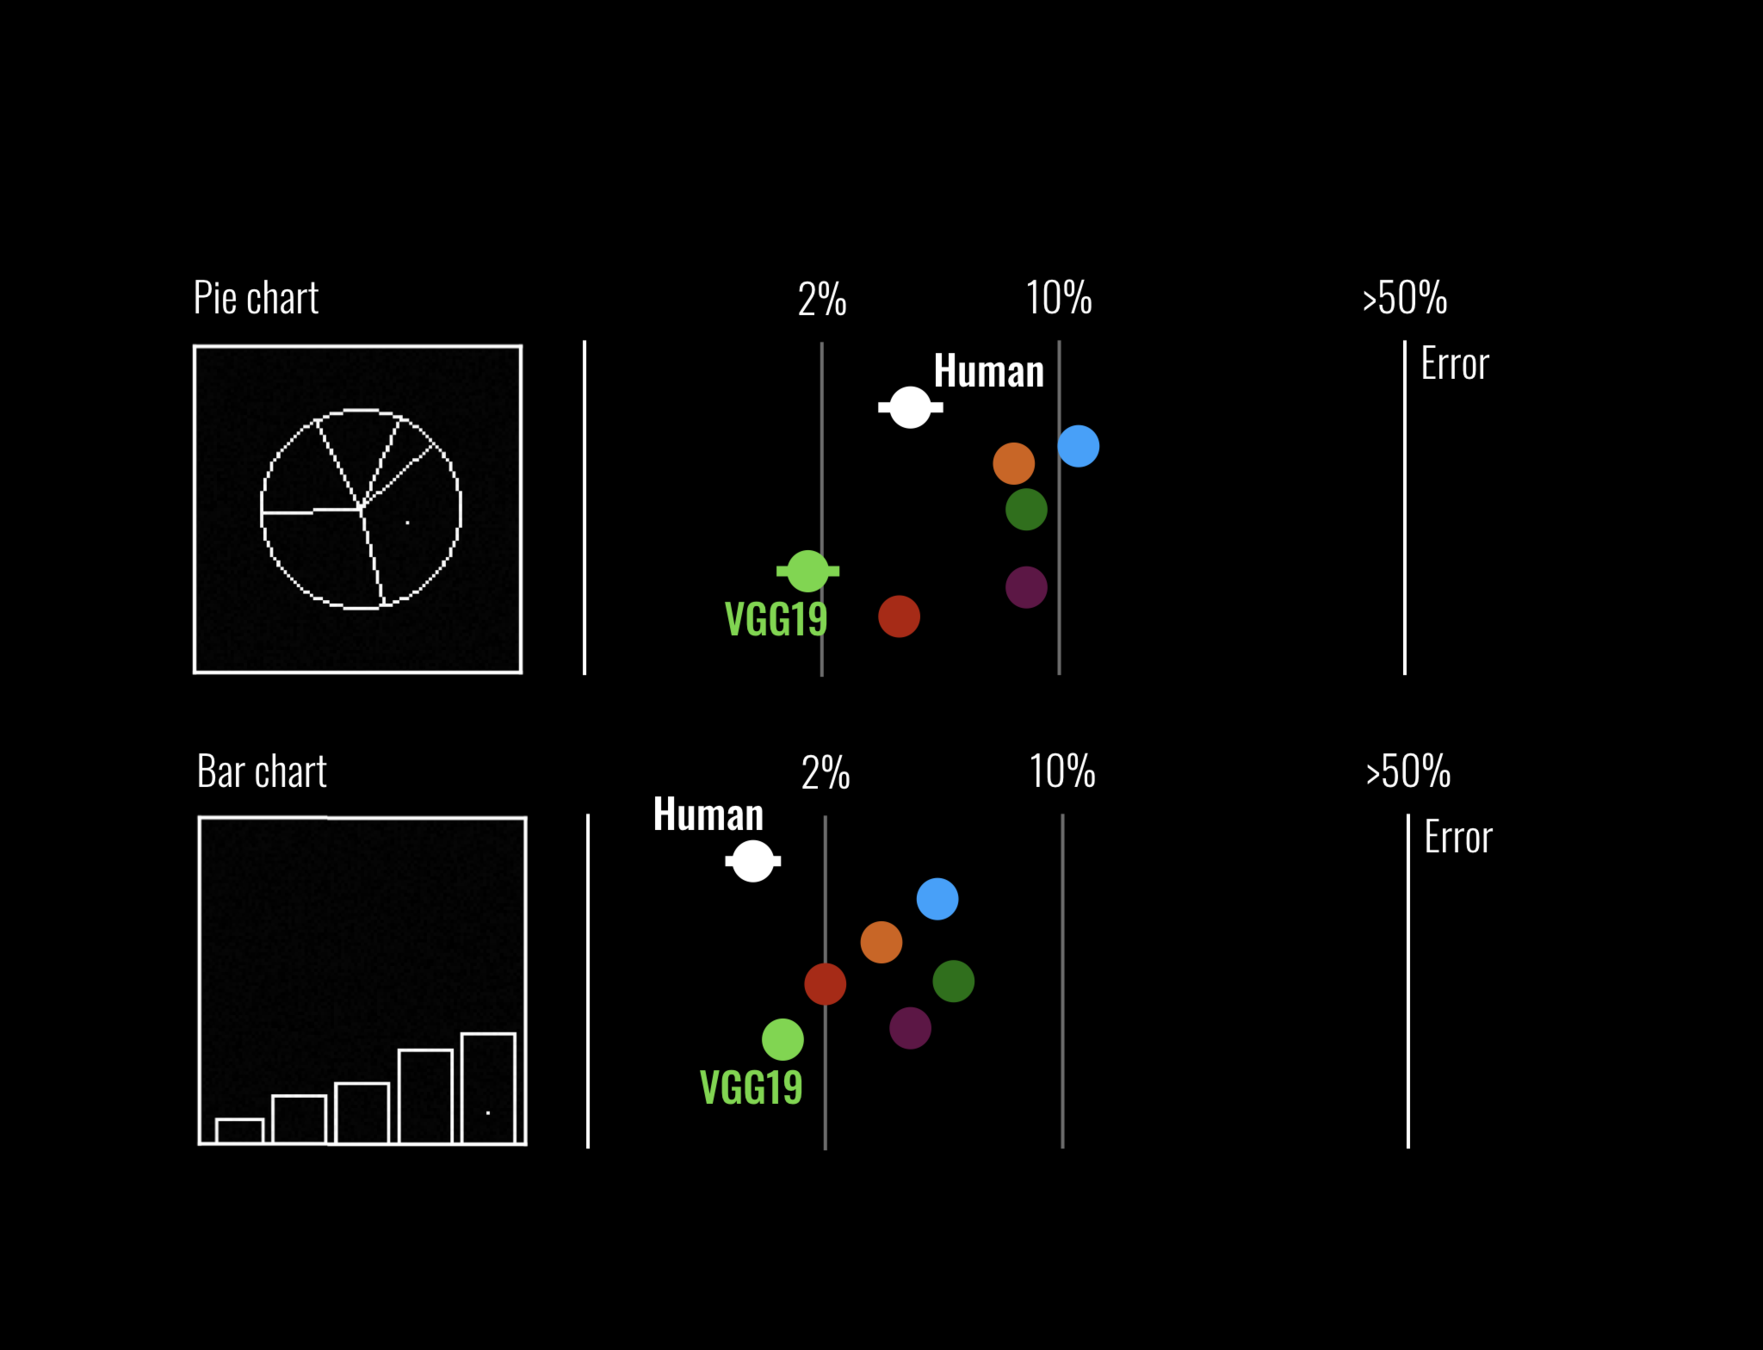
Machine Graphical Perception
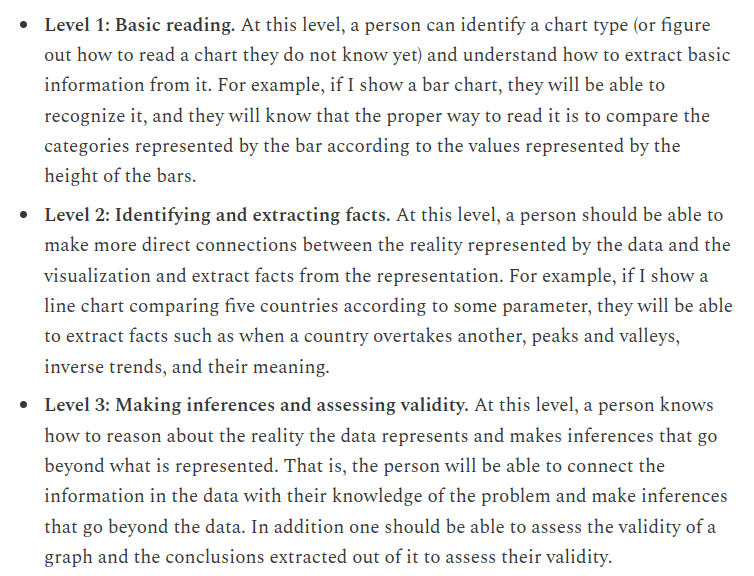
Visualization Literacy
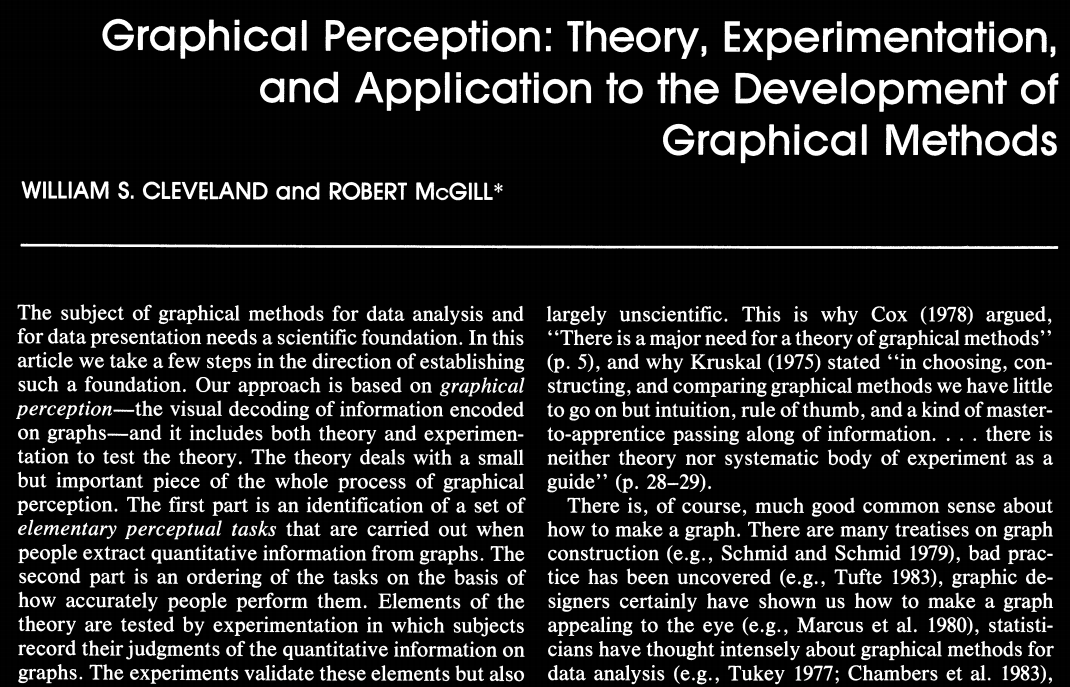
1984
IEEE Vis 2018
77°
0.856
[0.2, 0.14, 0.6, 0.8]
2500+ networks
Homework
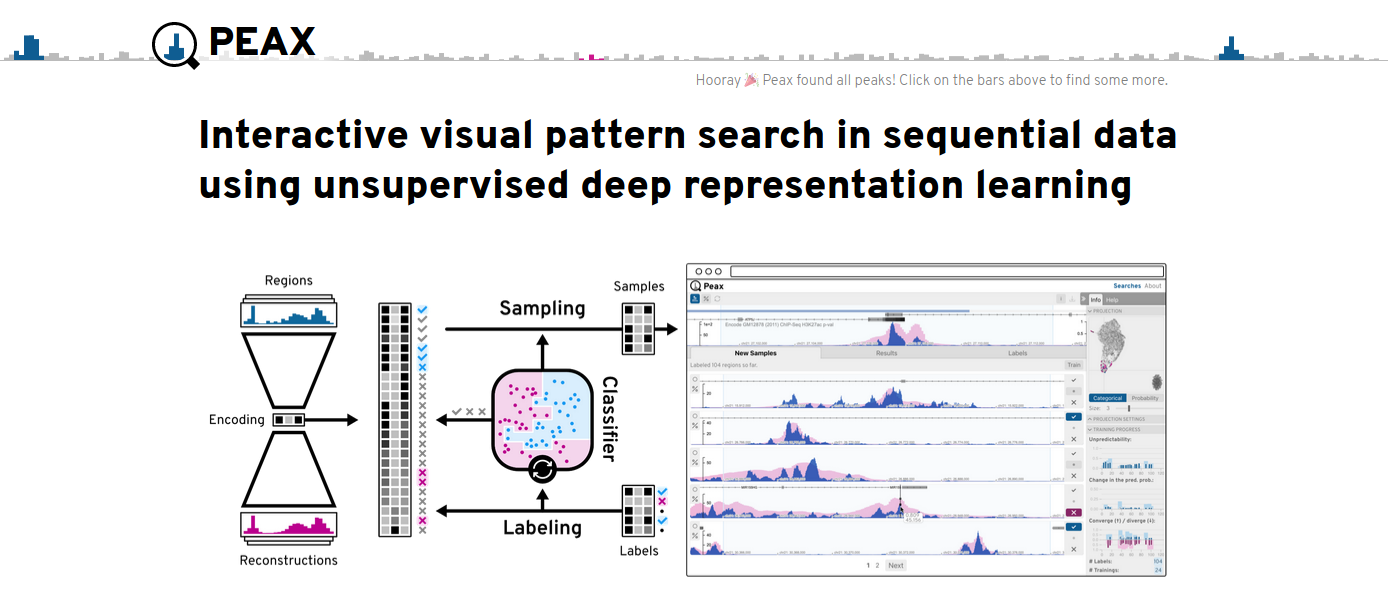
Auto-Encoder to find patterns in sequential genome data
Interactive ROI selection
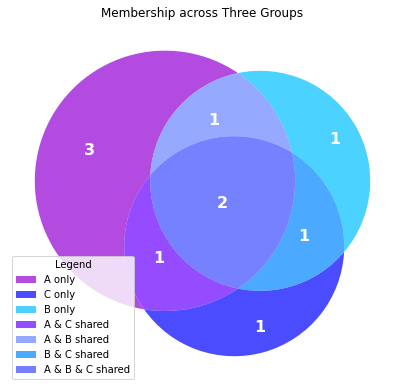
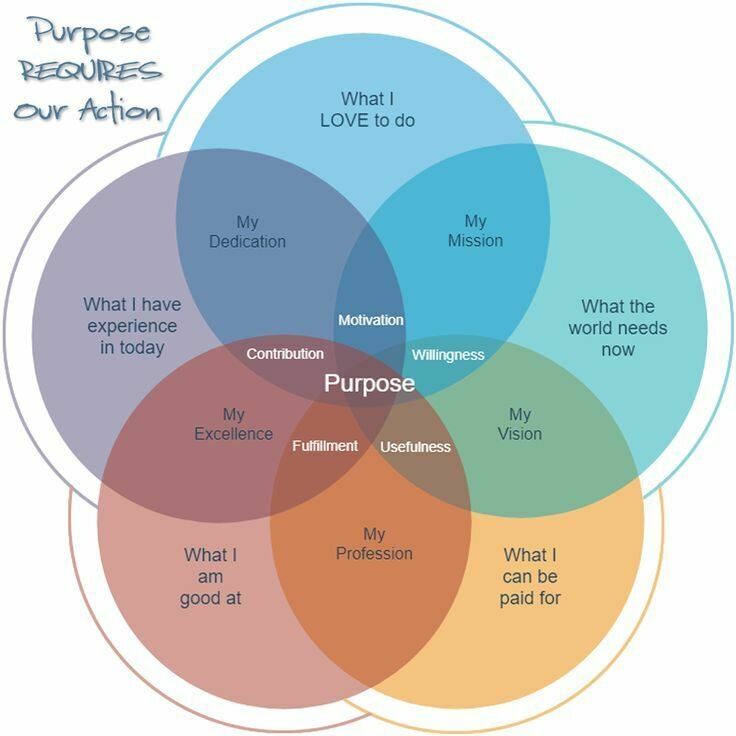
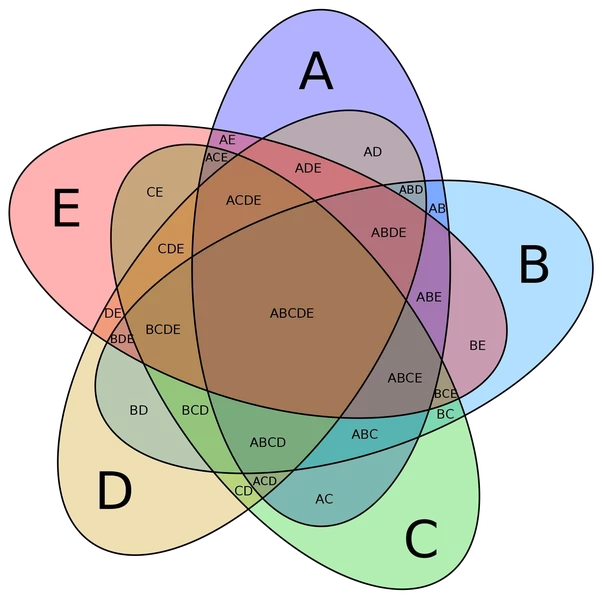
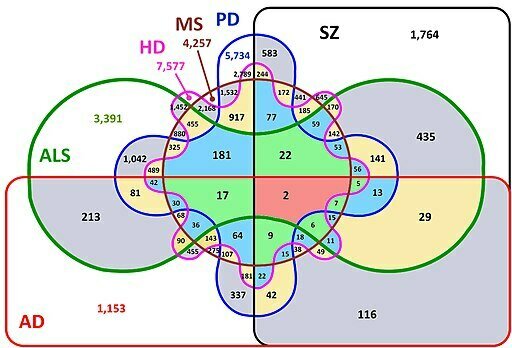
Venn Diagrams
gets complicated real fast
does not scale beyond 3 or 4 sets
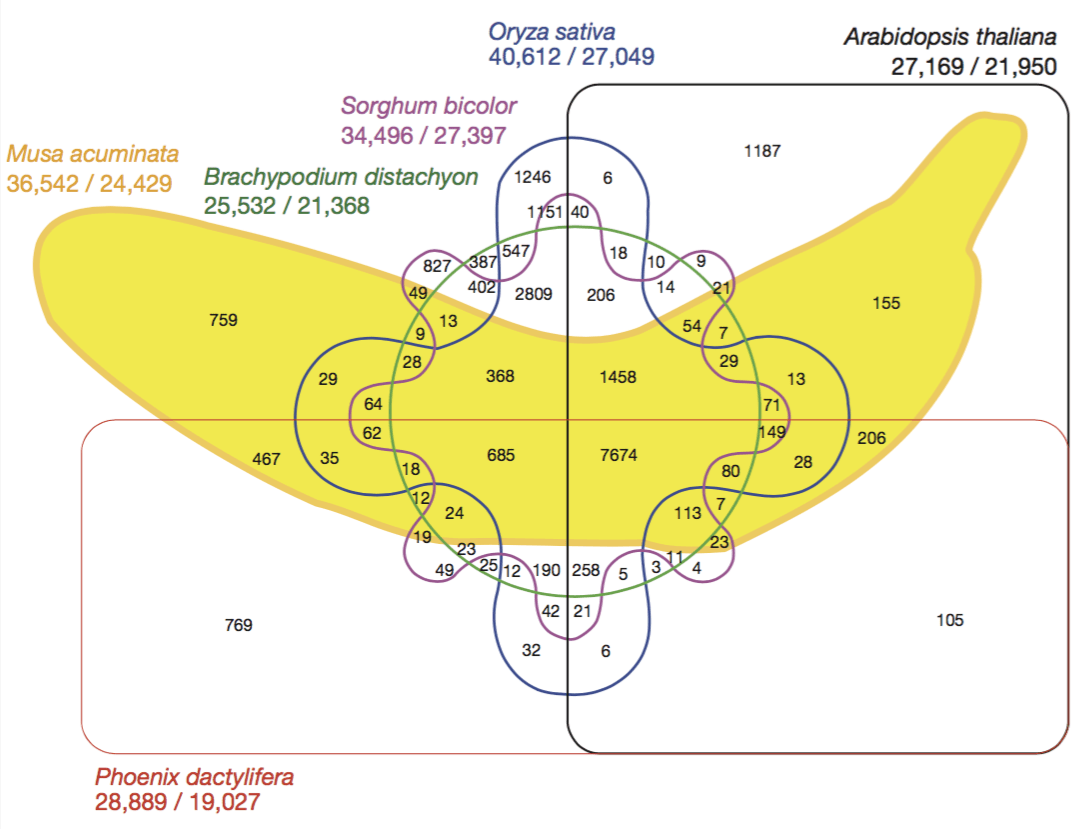
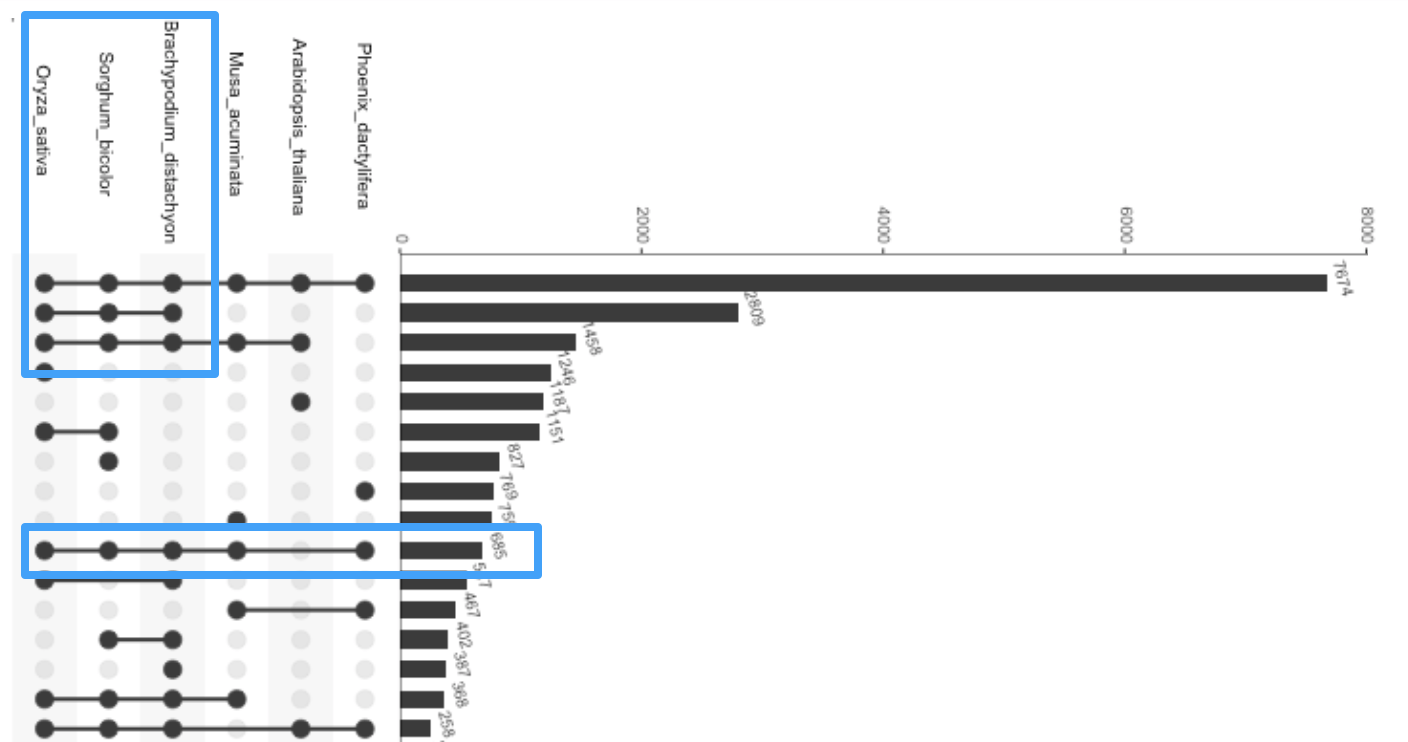
banana's genome vs five other species
which genes are shared?
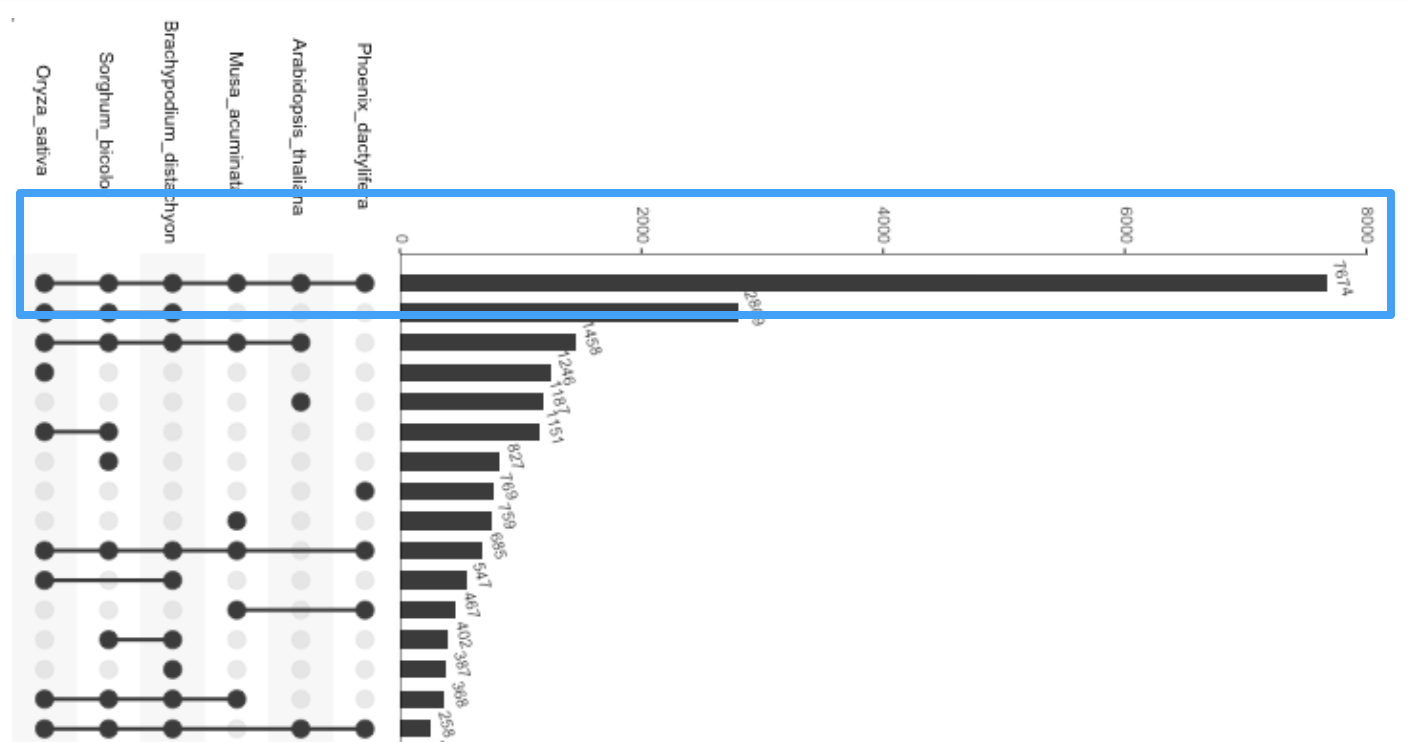
vast majority of genes is shared across all 6 species
first three species seem highly related
phoenix dactylifera seems most different
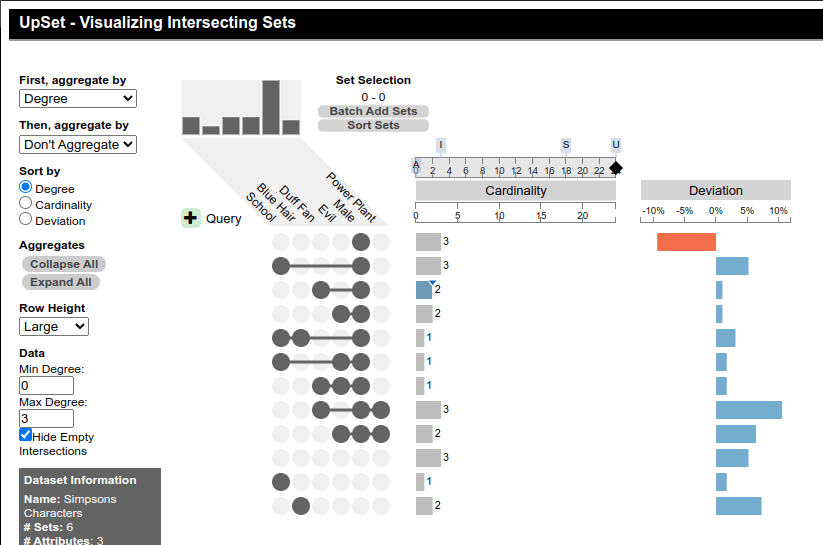
Homework
Use UpSet to figure out which males like Duff and do not work at the powerplant!
By Daniel Haehn
Slides for CS617 VISUALIZING.BOSTON - See https://cs617.orghttps://cs617.org


