


Daniel Haehn PRO
Hi, I am a biomedical imaging and visualization researcher who investigates how computational methods can accelerate biological and medical research.
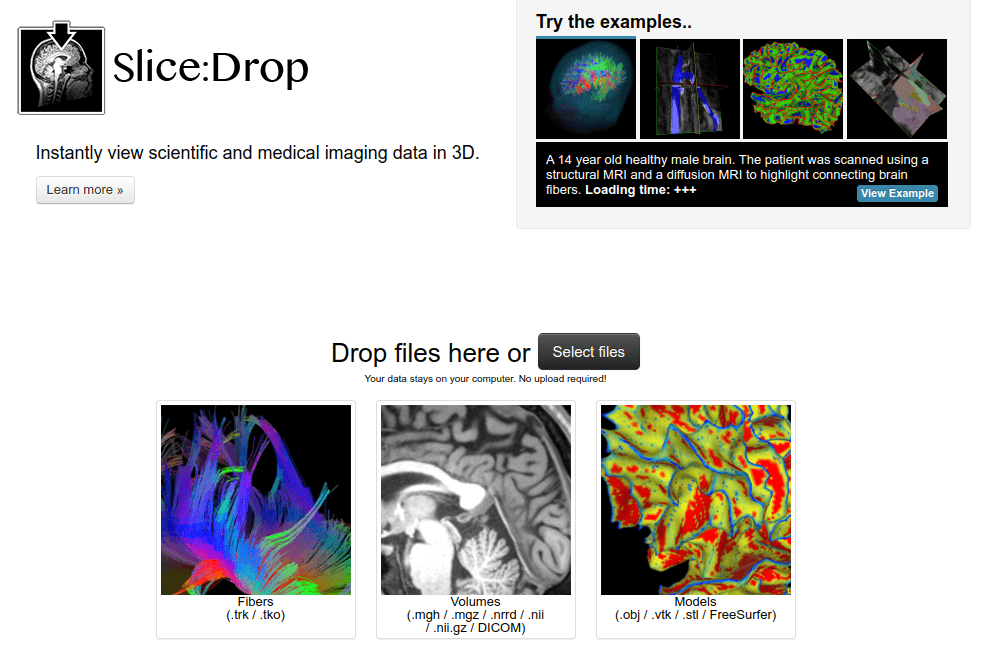
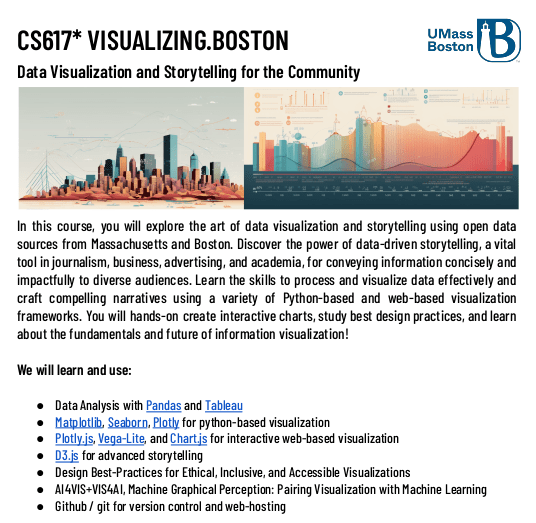
iTCGA: Visualization and Medical Imaging
Daniel Haehn
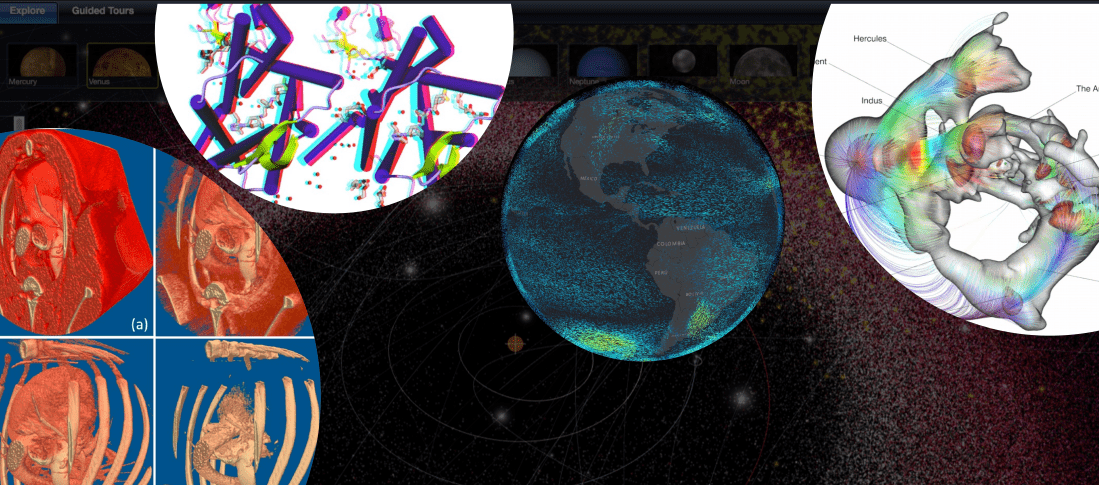
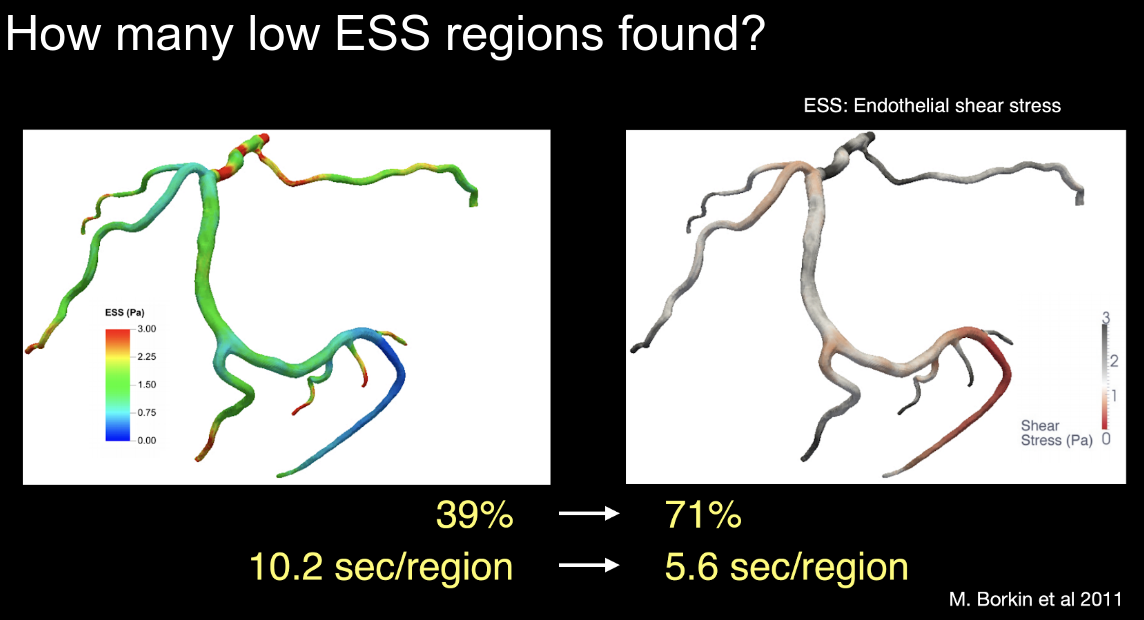
Scientific Visualization
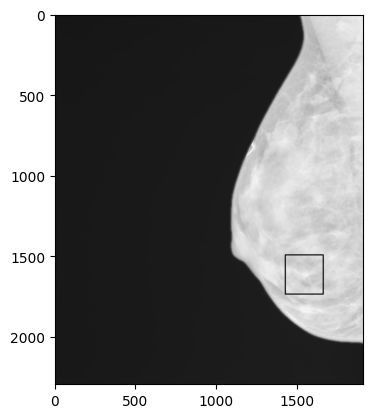
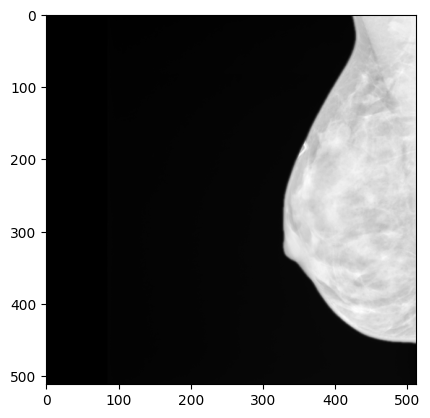
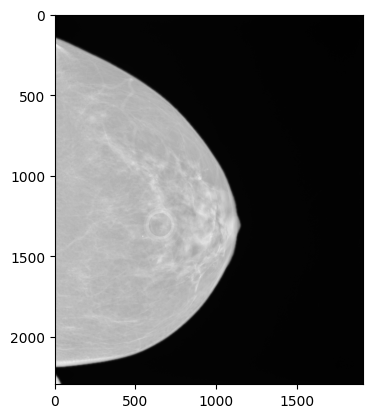
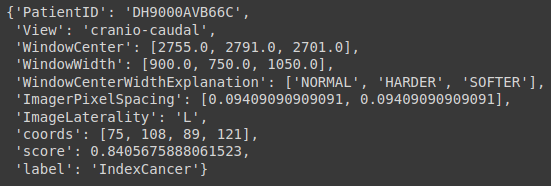
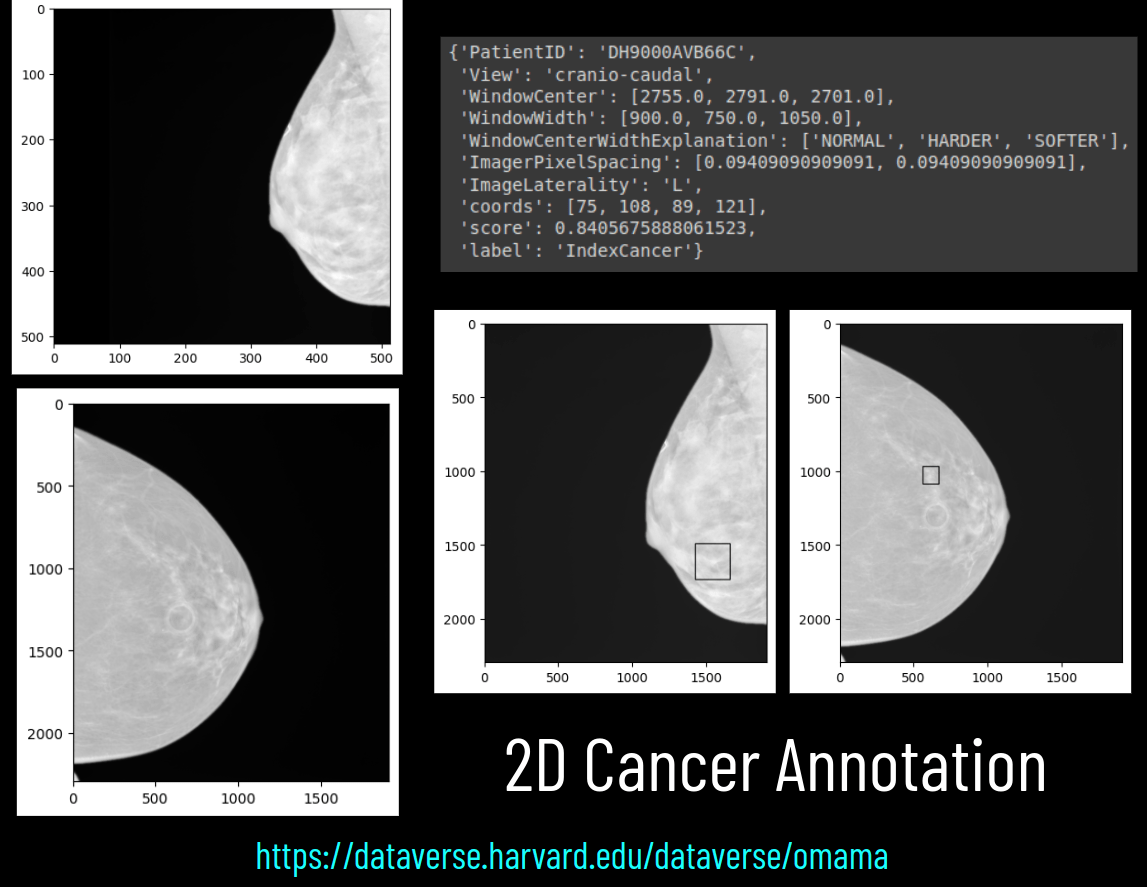
2D Cancer Annotation
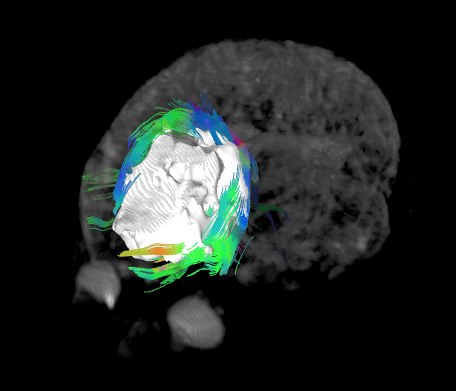
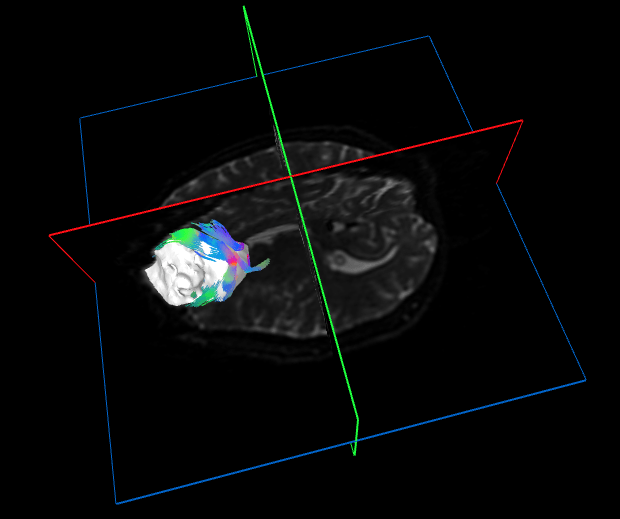
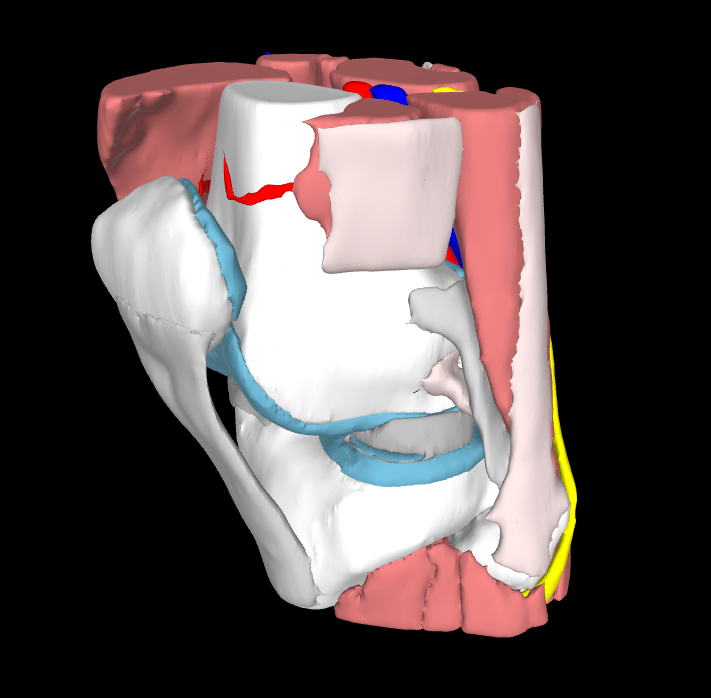
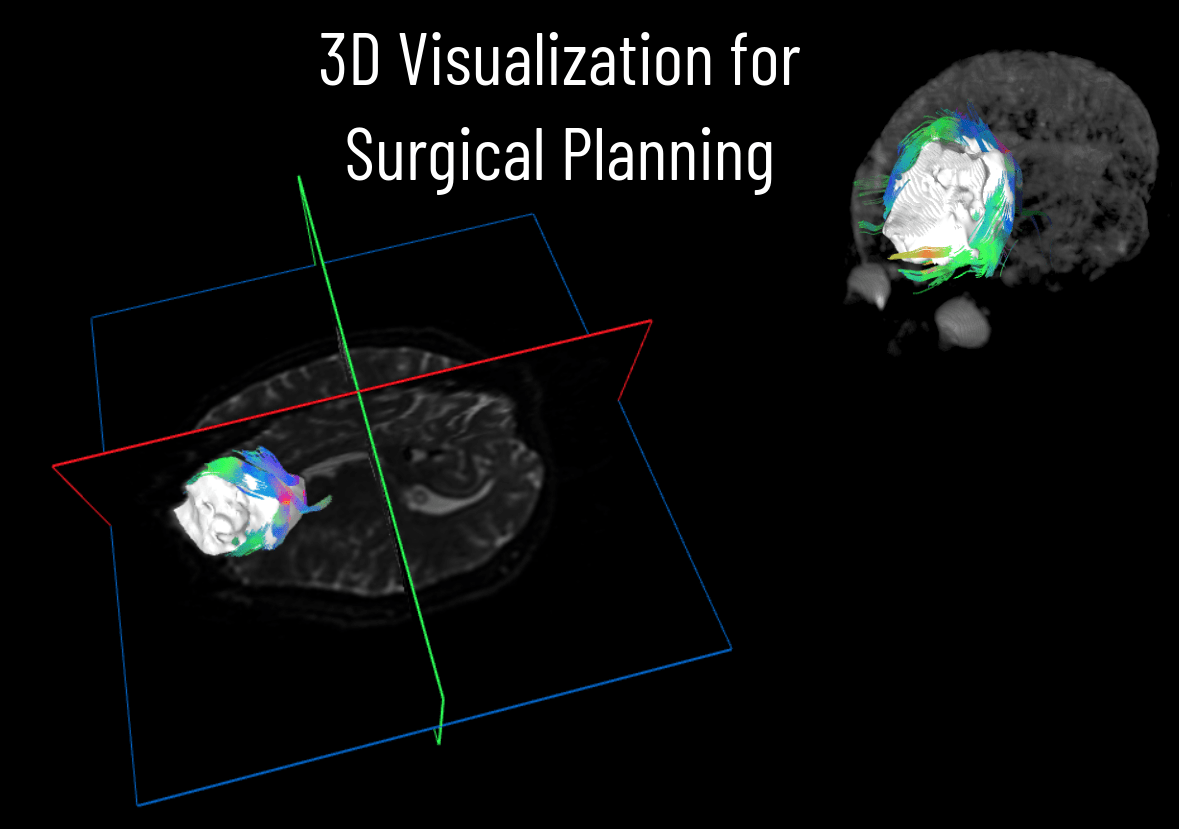
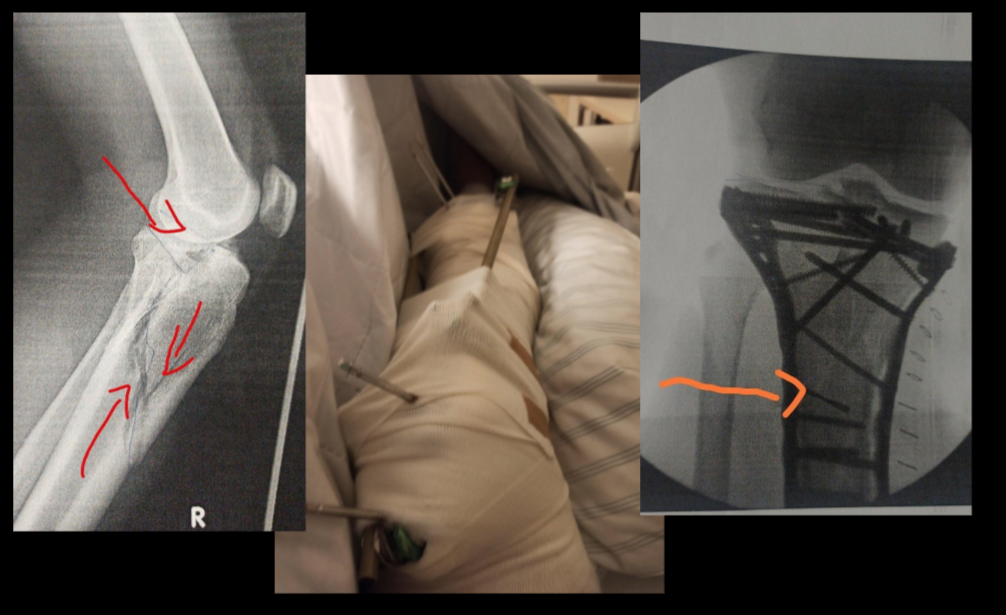
3D Visualization for Surgical Planning
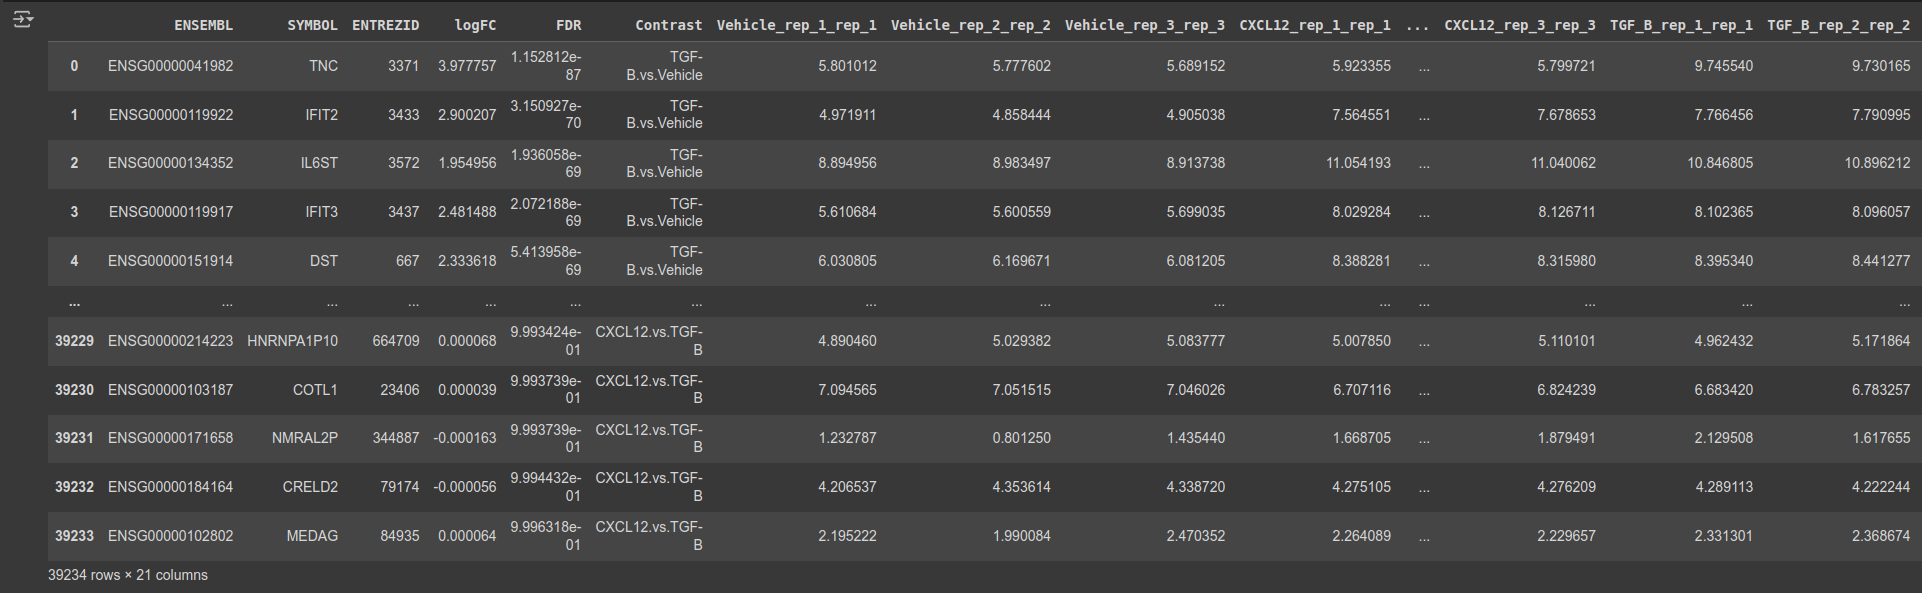
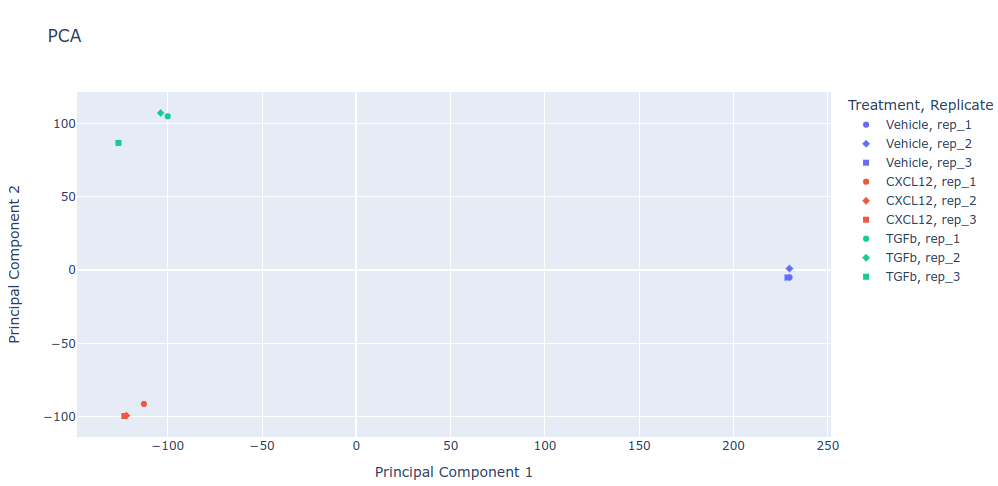
Kourosh's Gene Expression Data
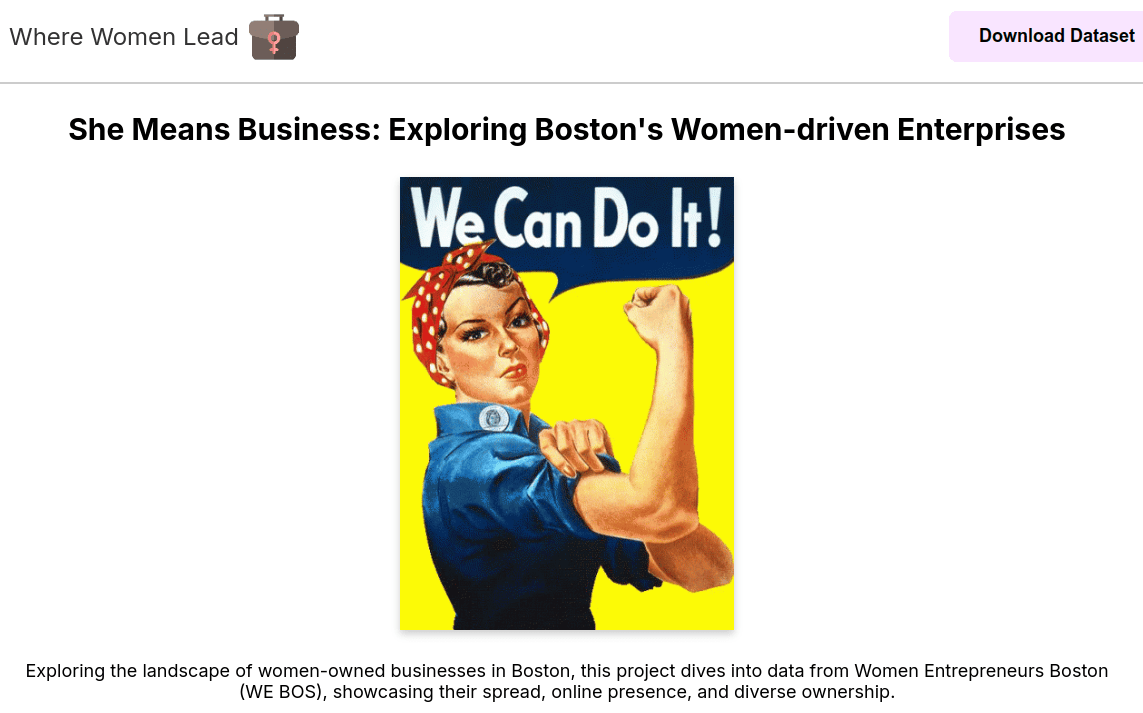
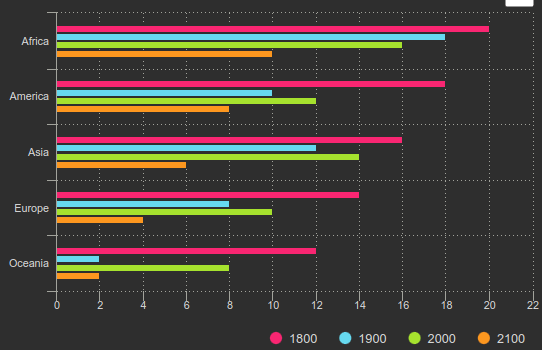
Information Visualization
Data Visualization
Scientific Visualization == black background
Information Visualization == white background
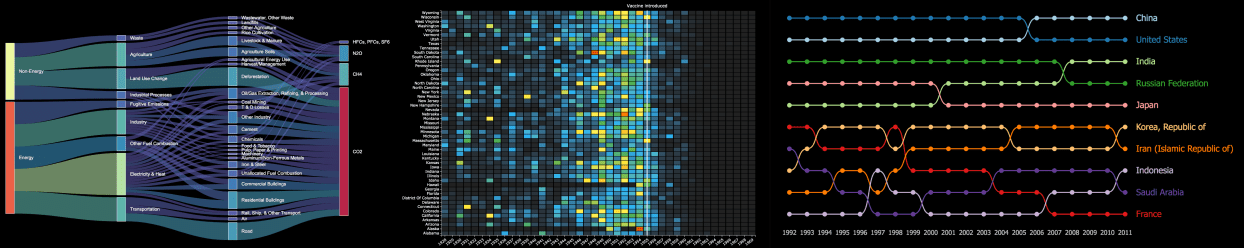
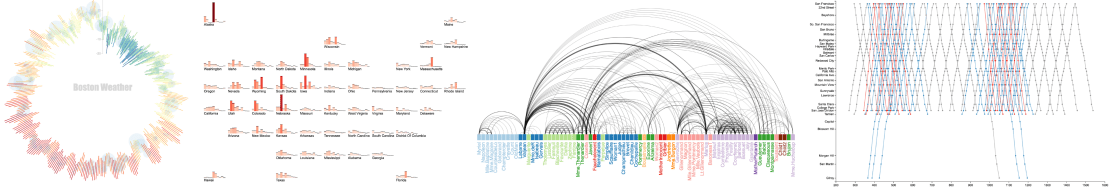
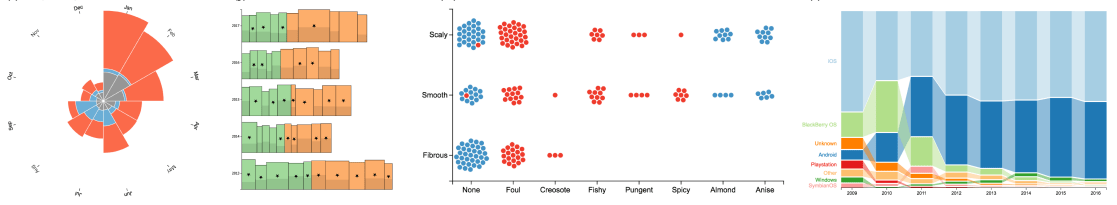
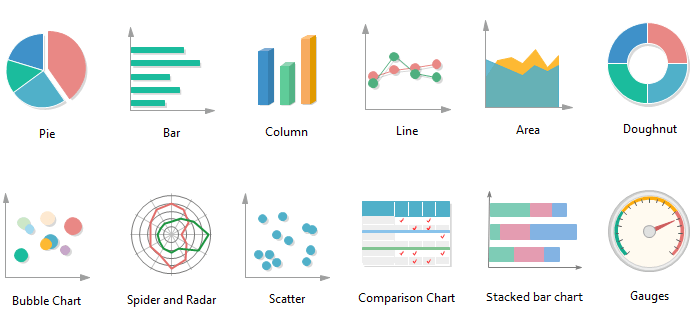
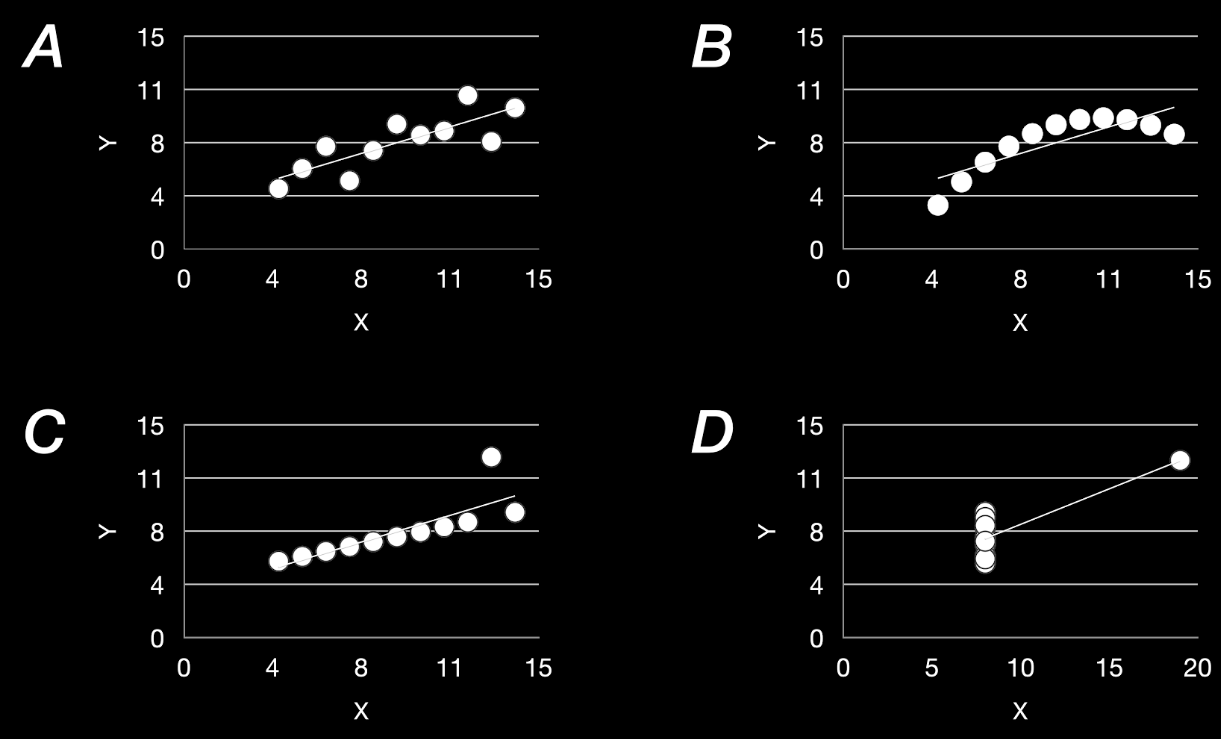
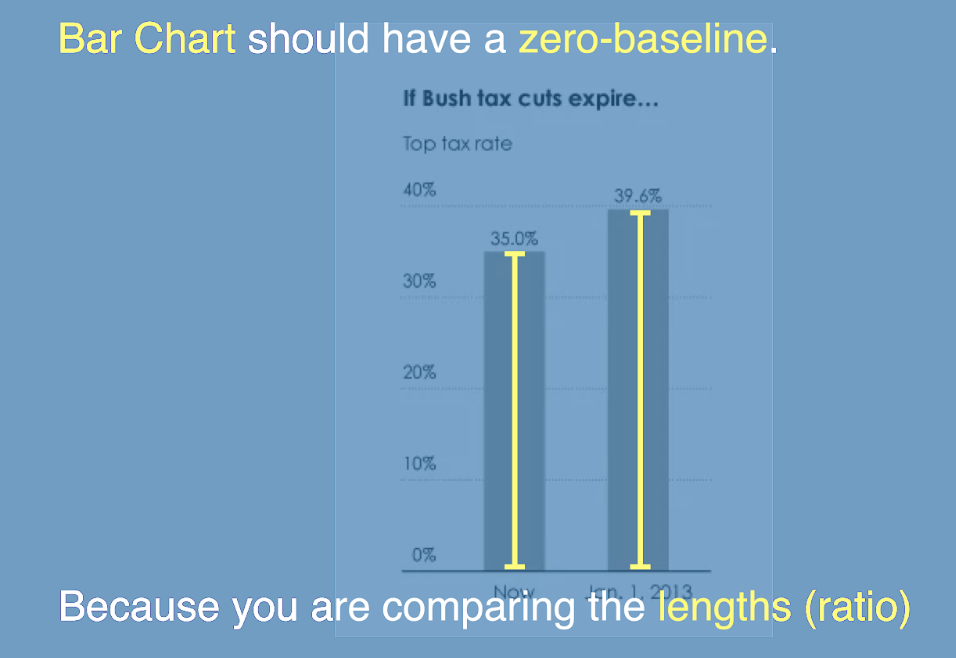
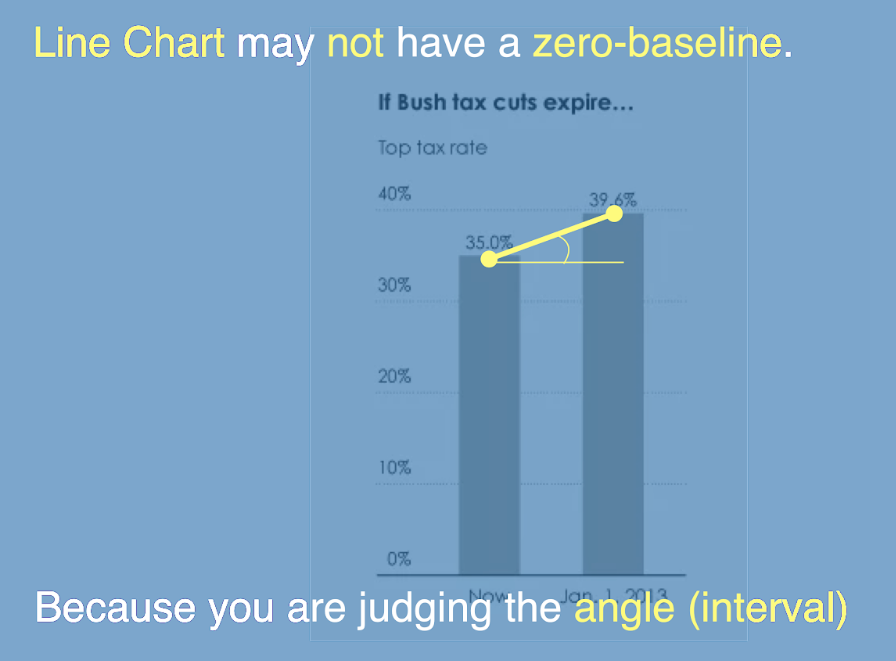
Charts
as building blocks
Information Visualization
Data Visualization
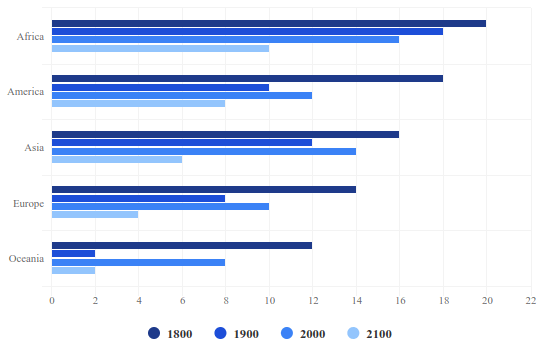
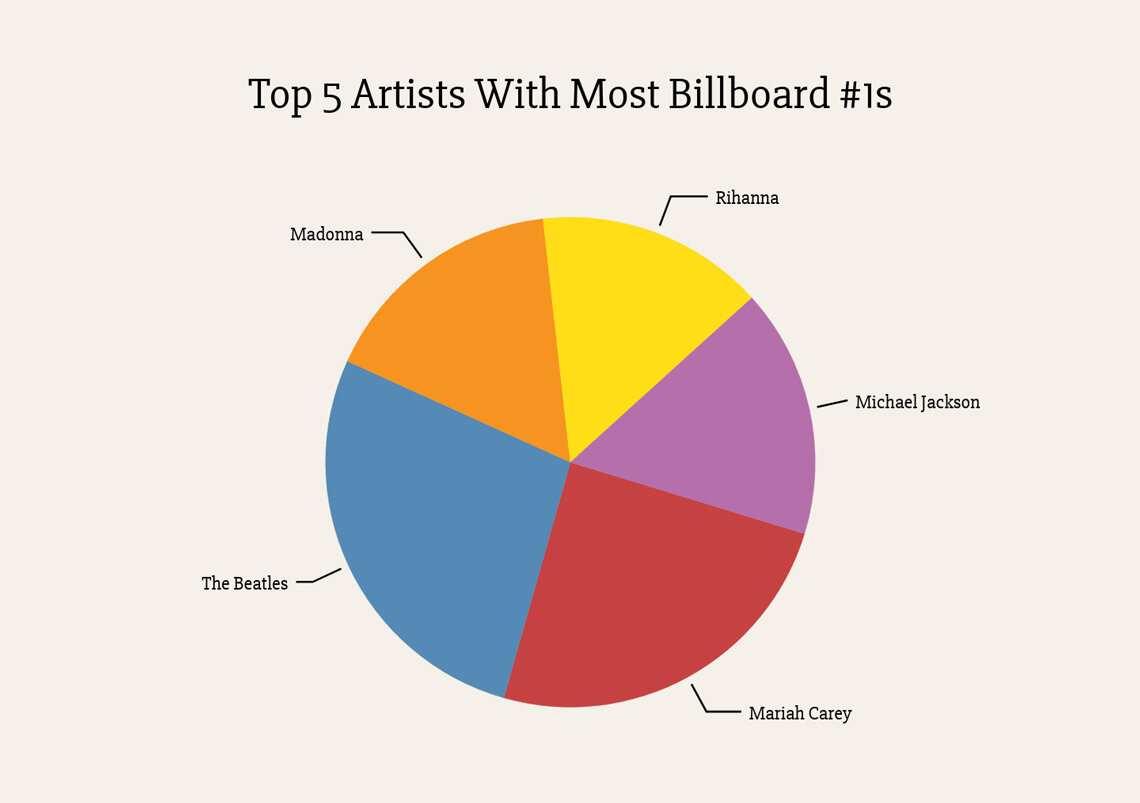
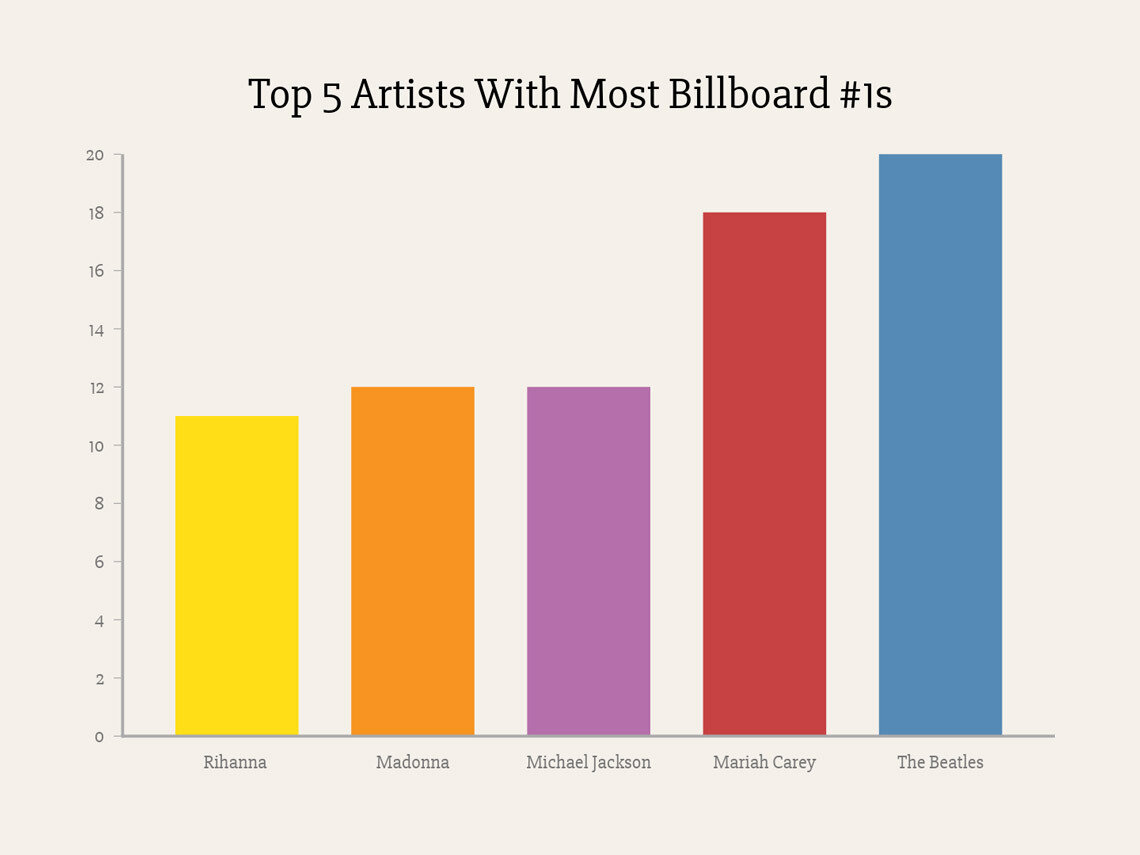
Who has the most #1s?
Who has the least?
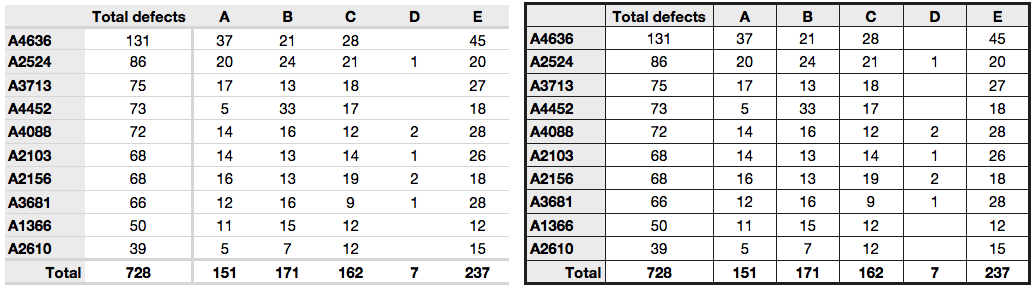
Tables are visualizations too!
this is one is better
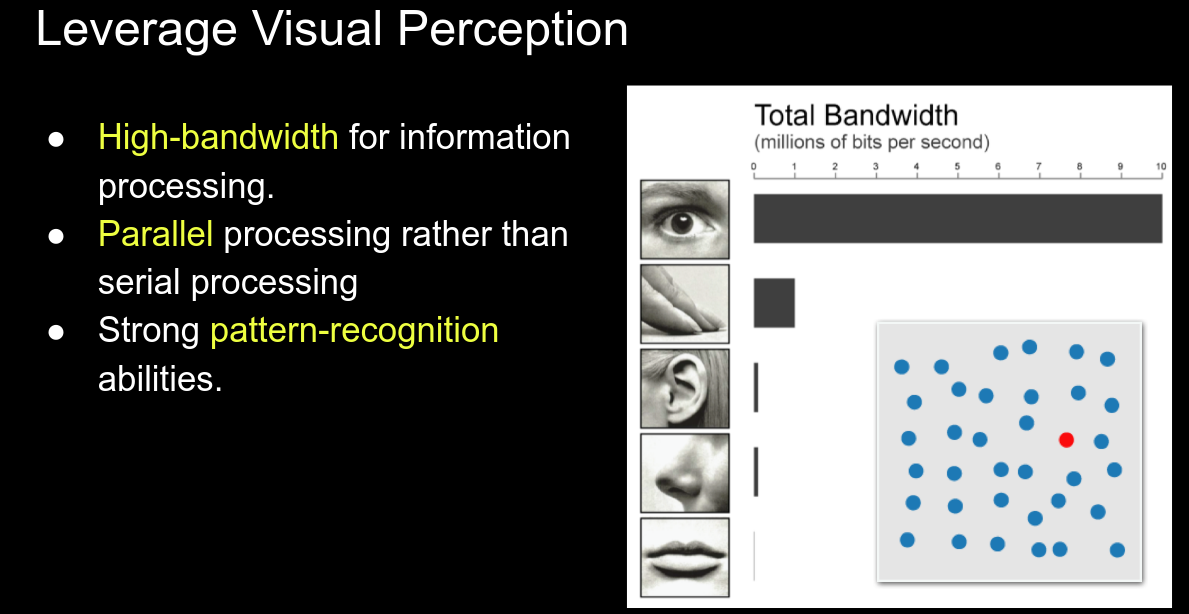
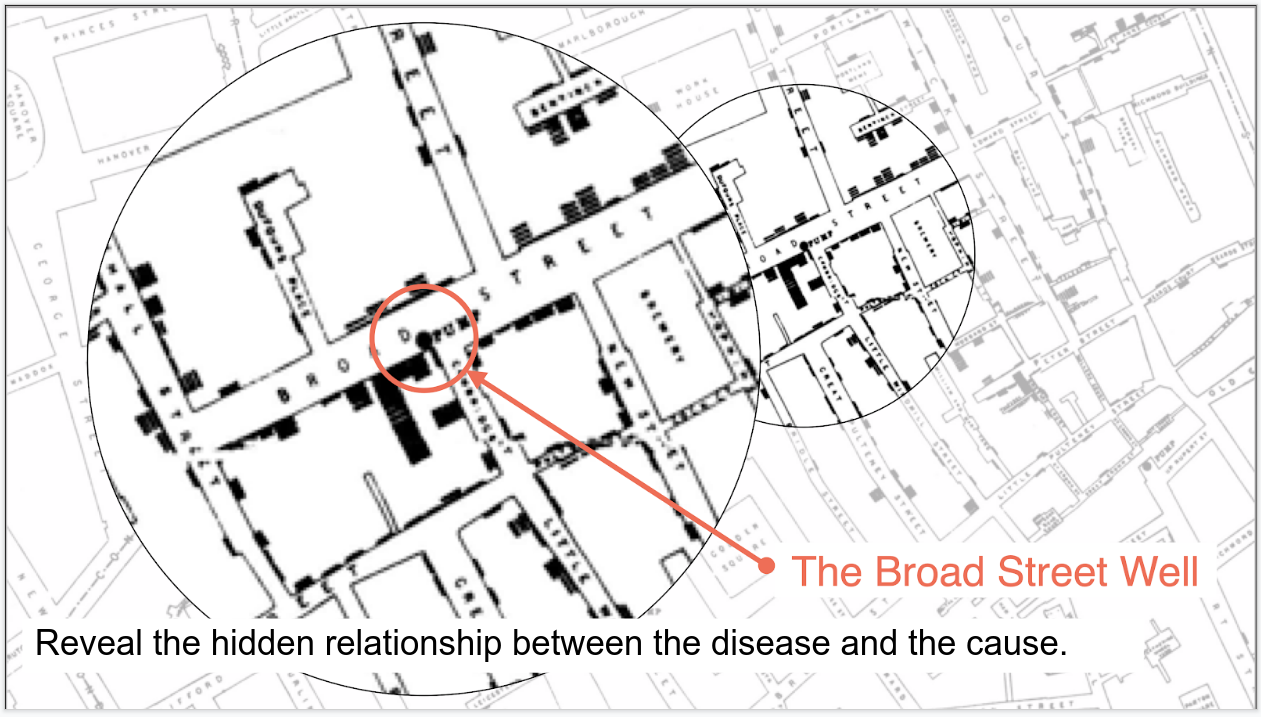
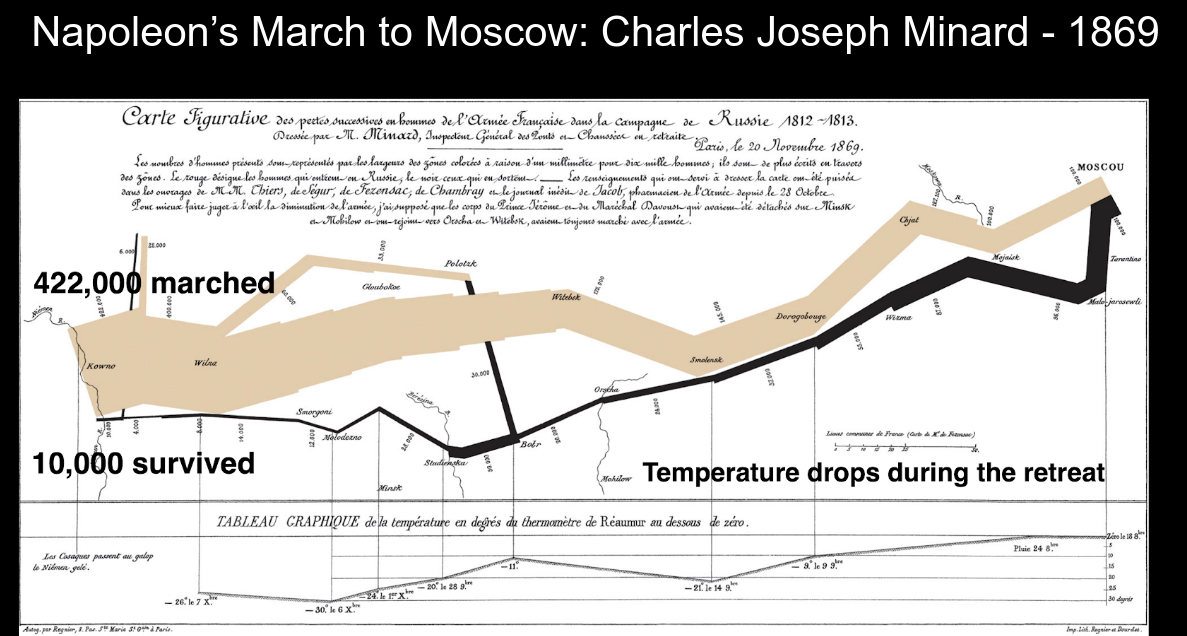
Visualizations should reduce the cognitive load when looking at data!
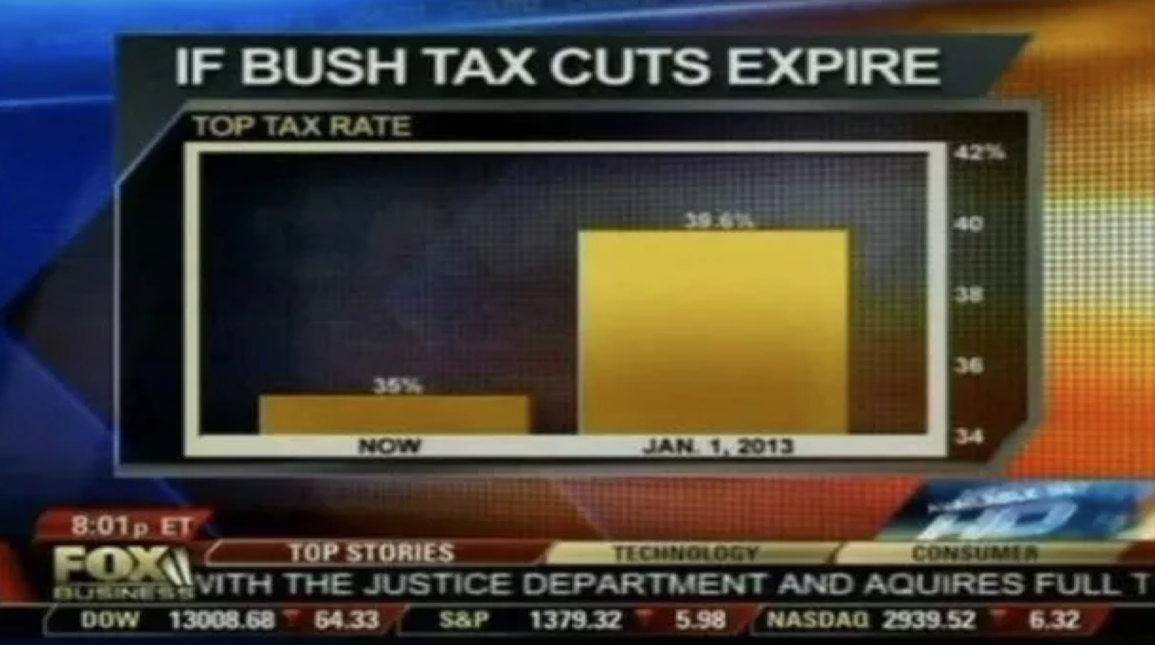
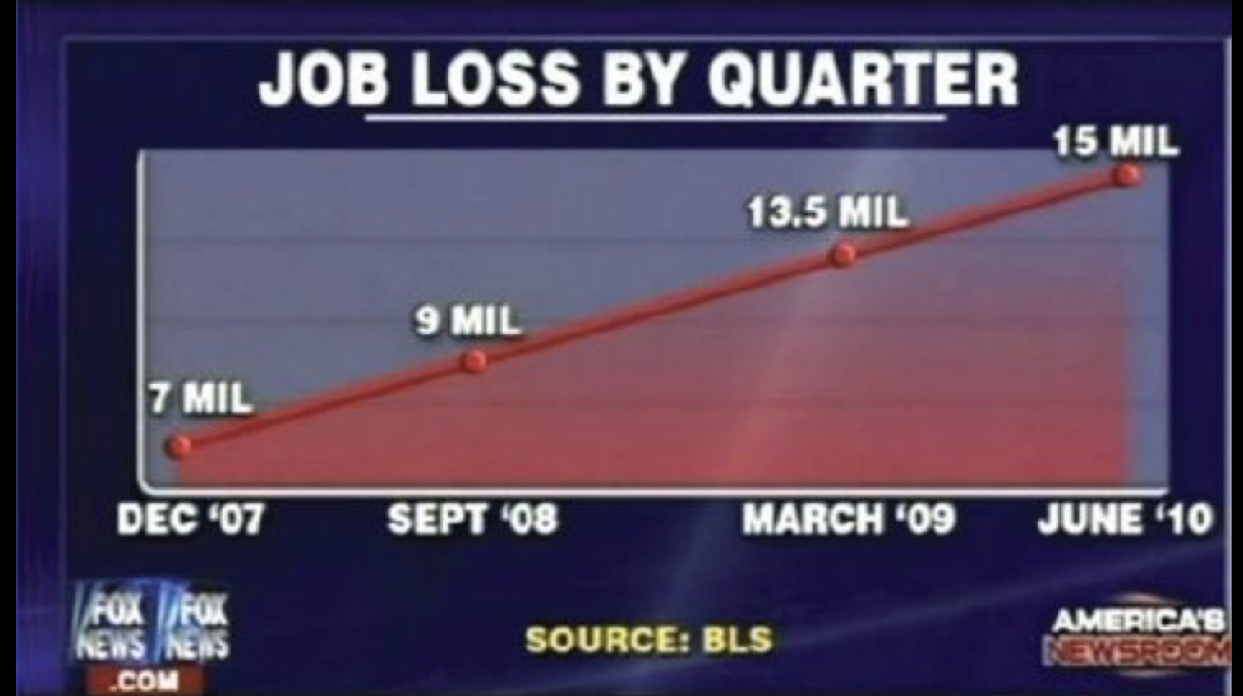
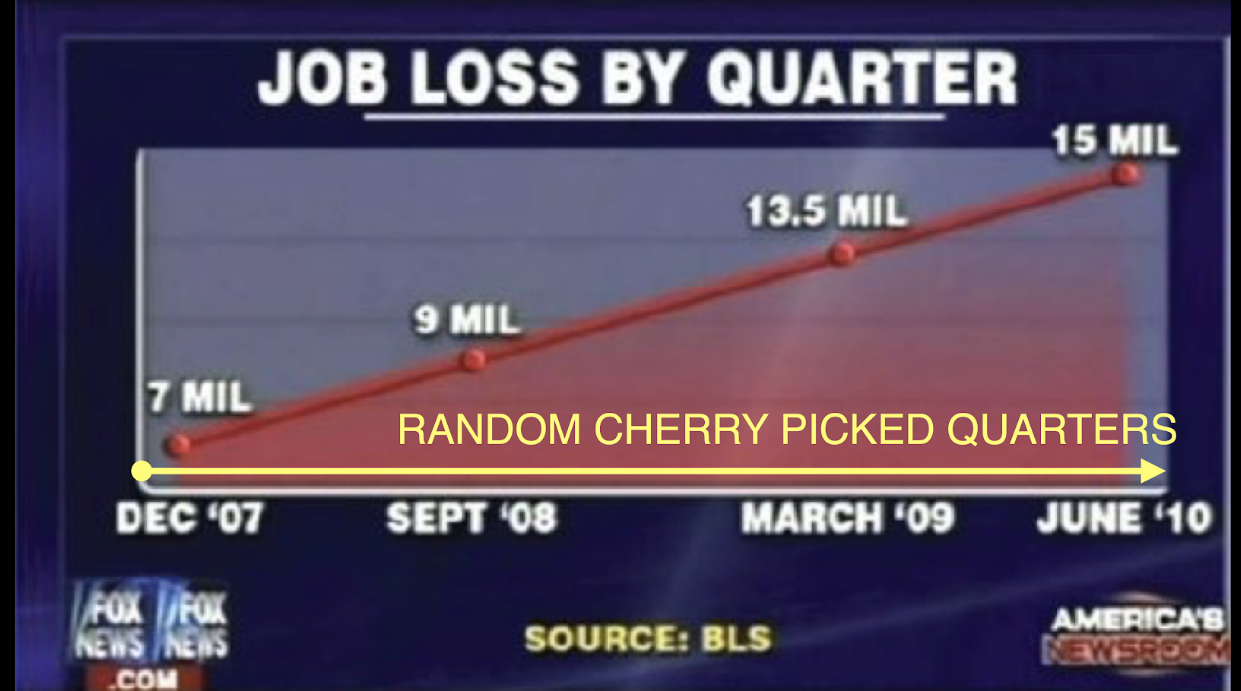
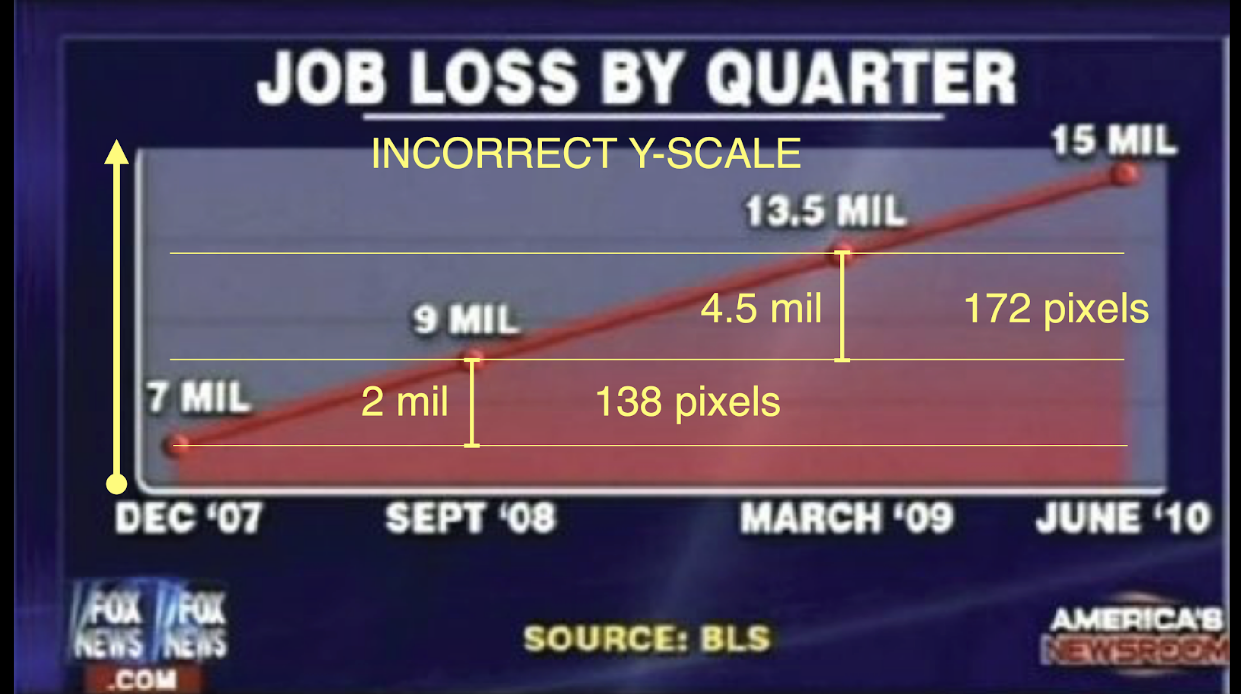
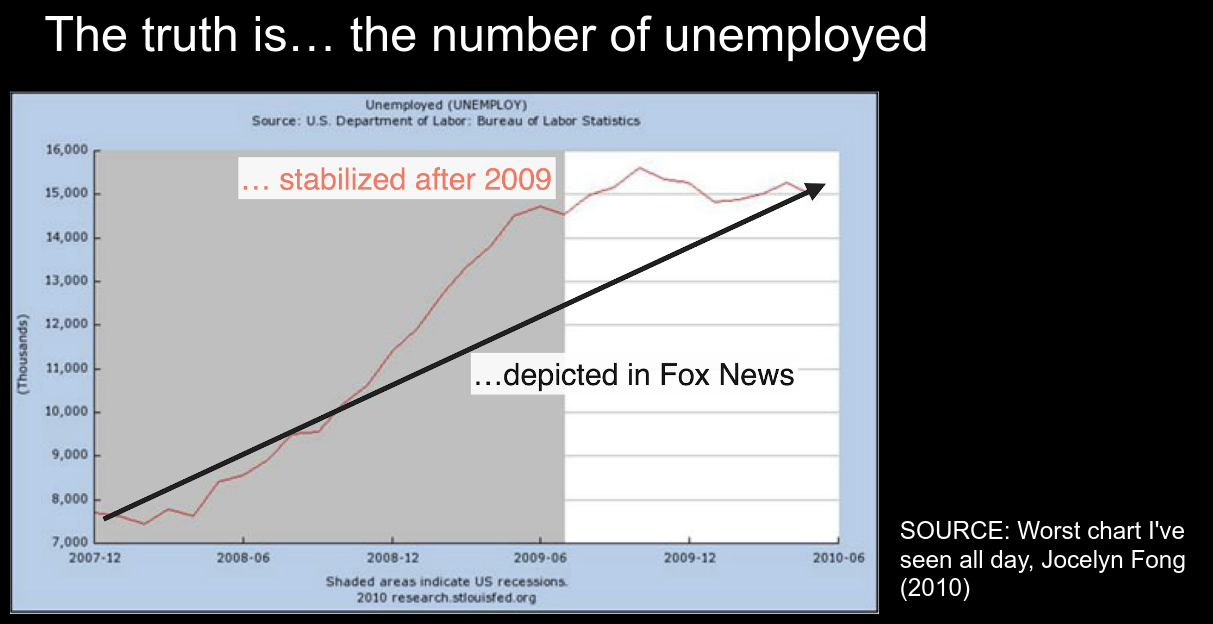
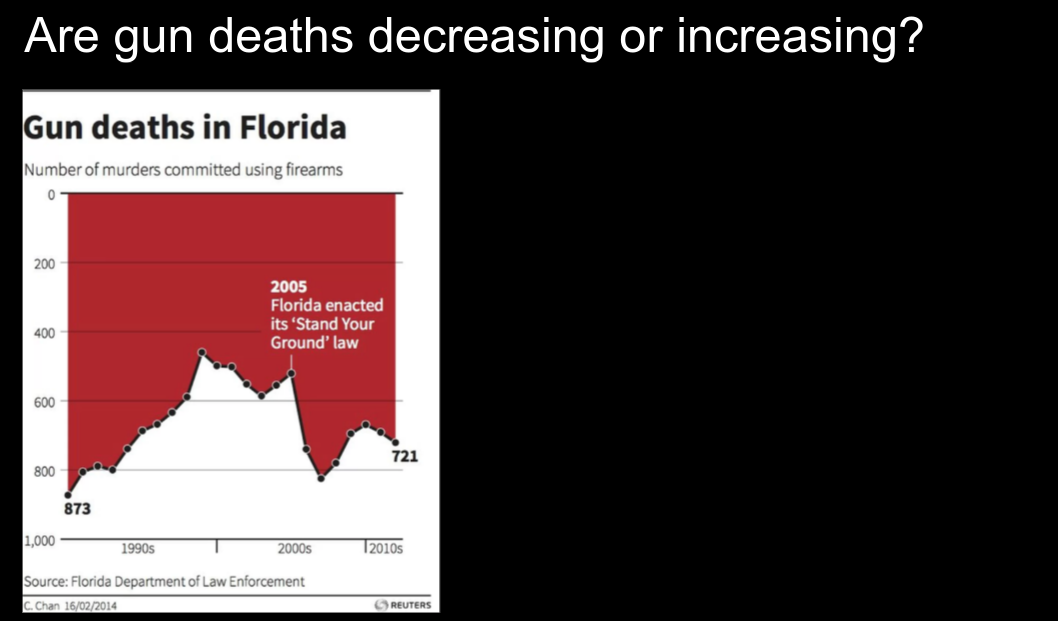
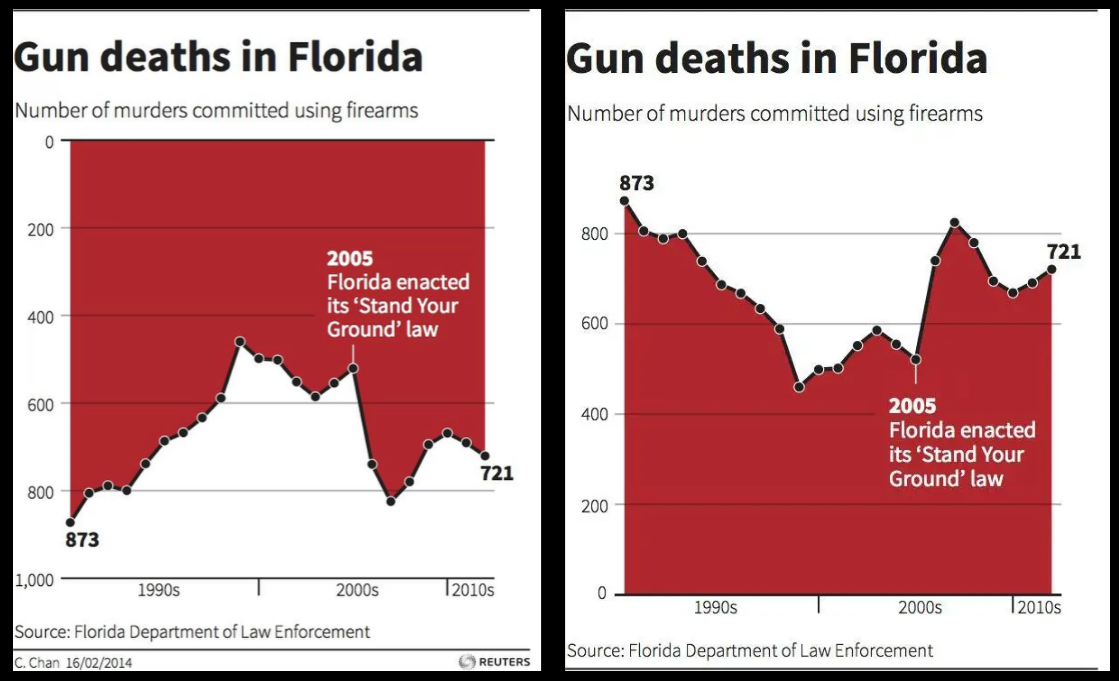
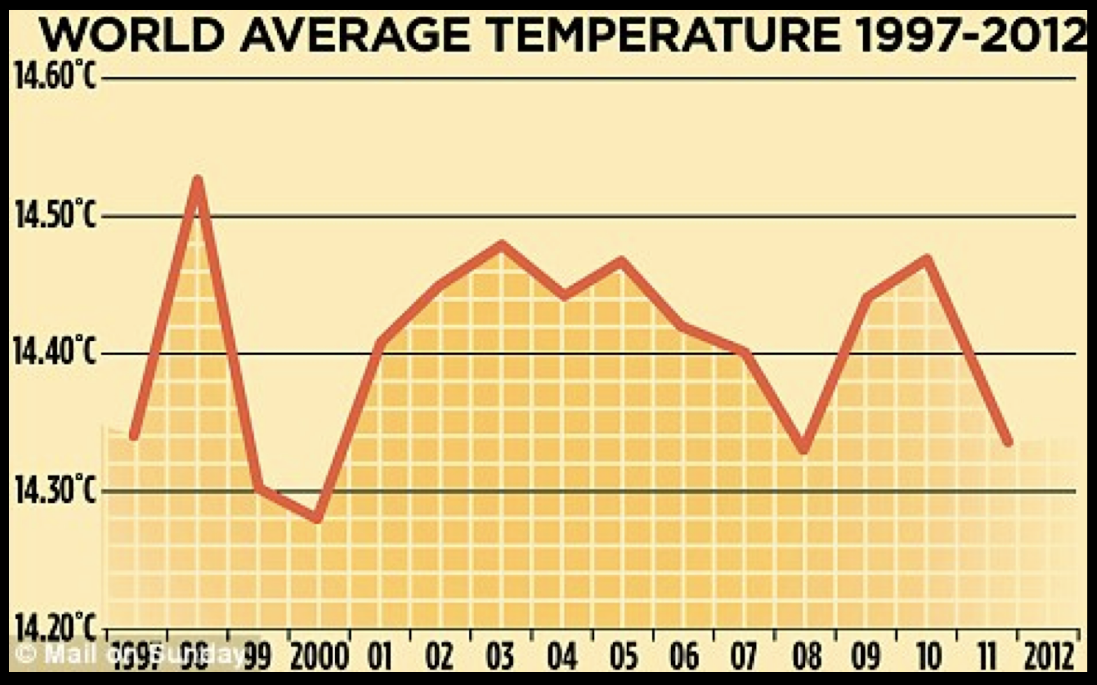
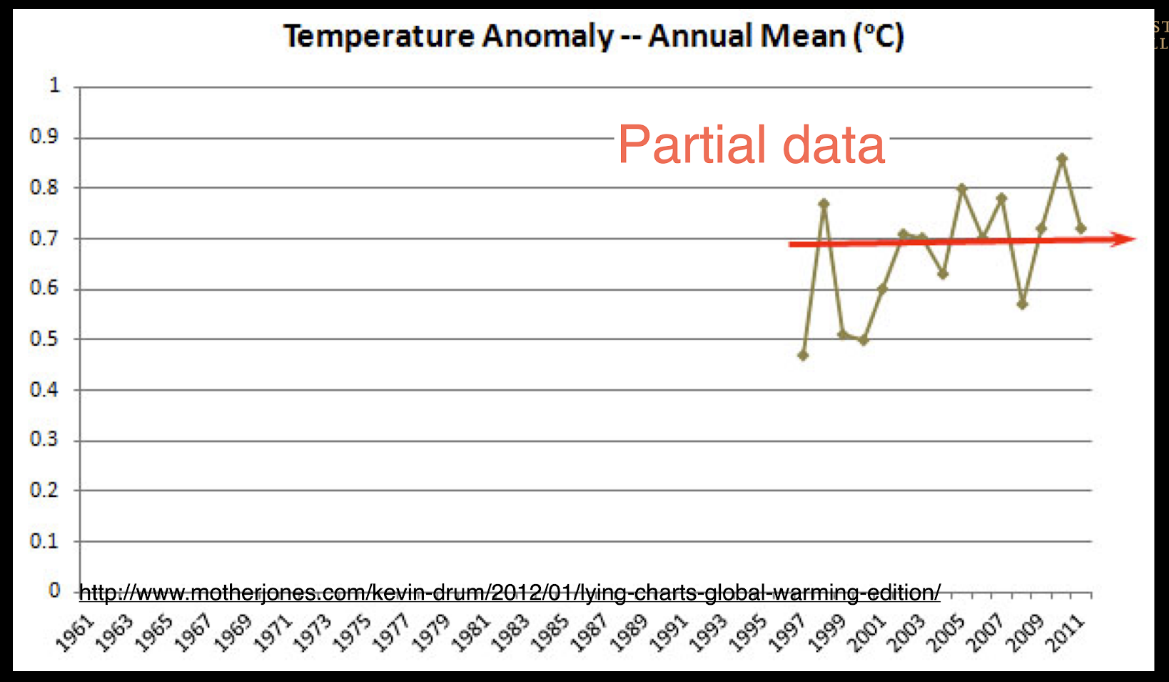
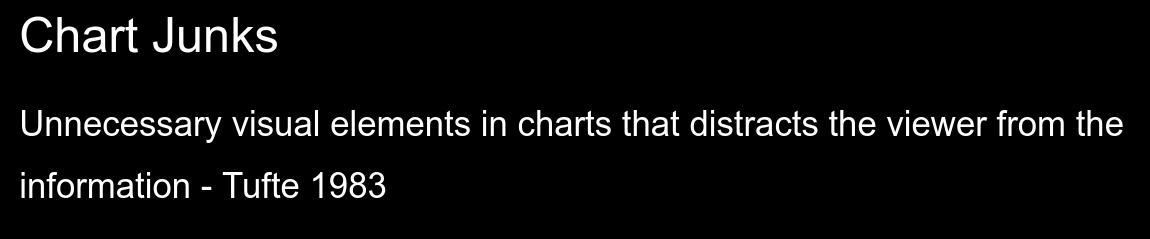
Bad Examples
Information Visualization
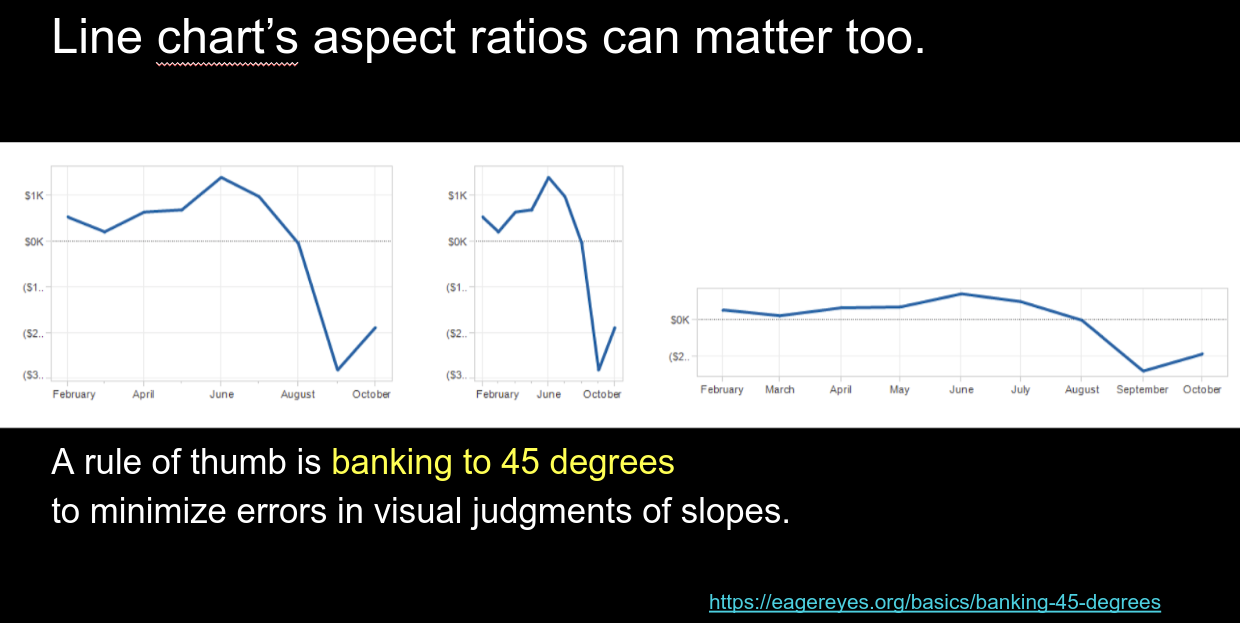
Line Chart Aspect Ratio
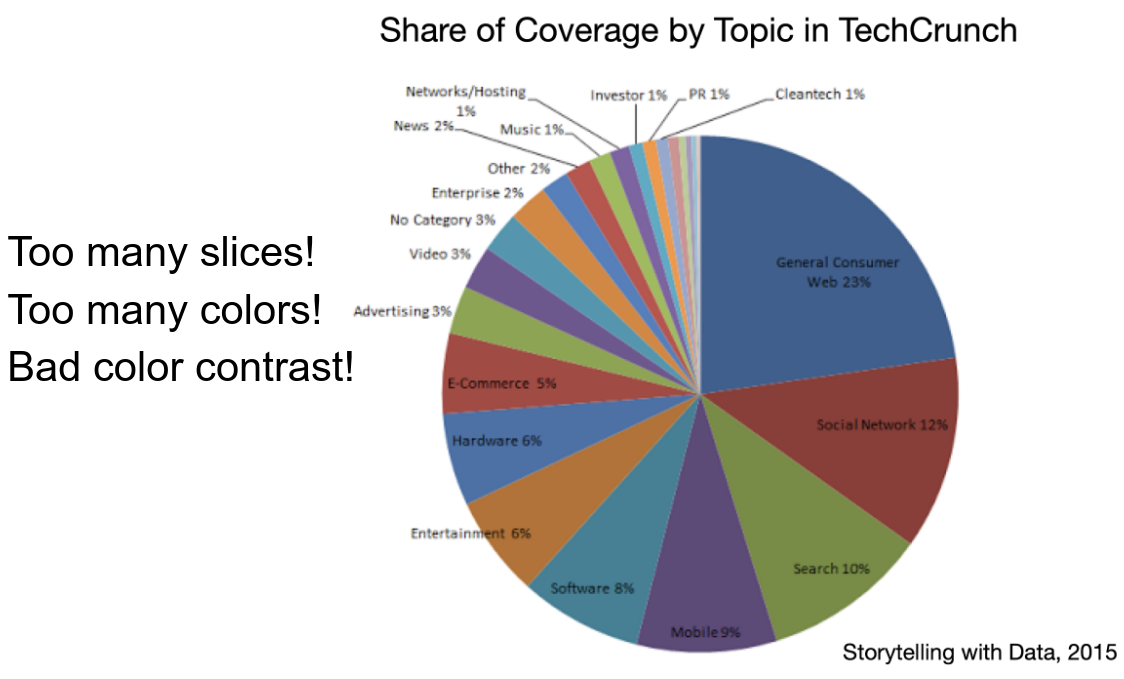
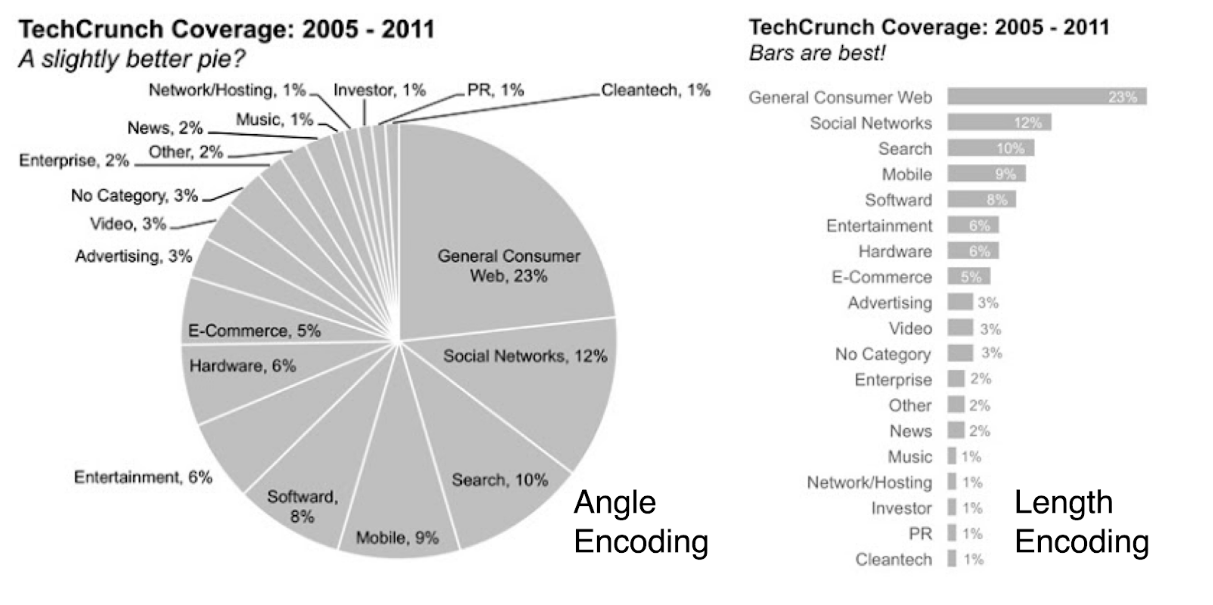
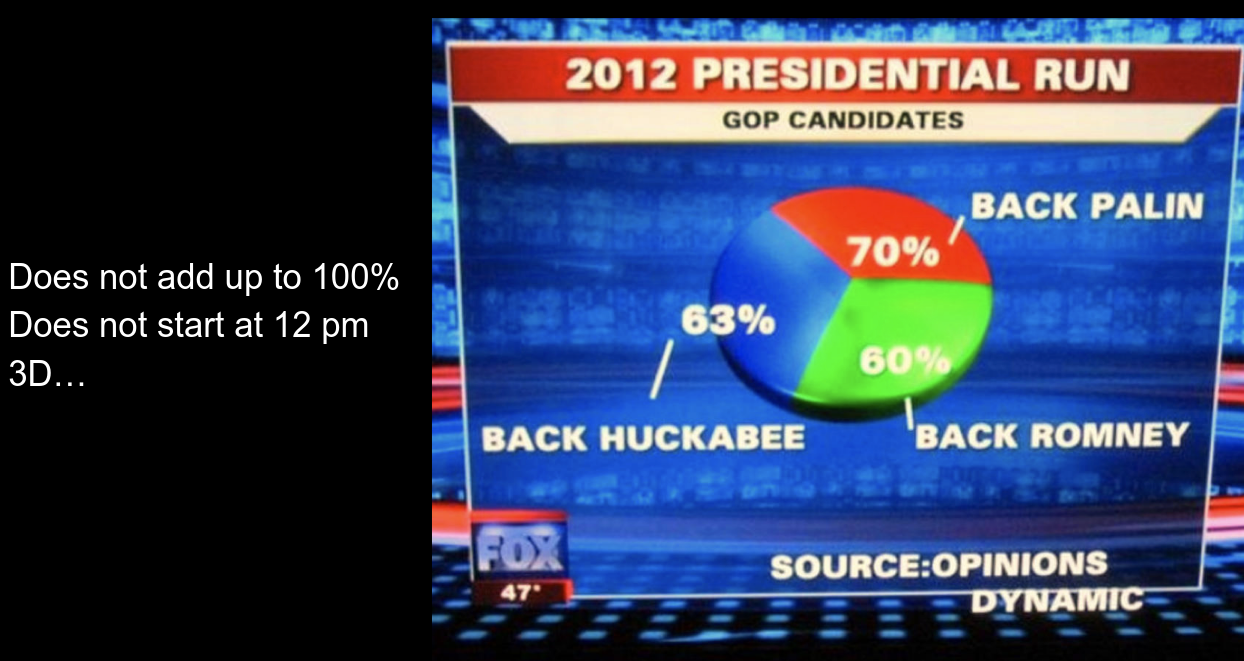
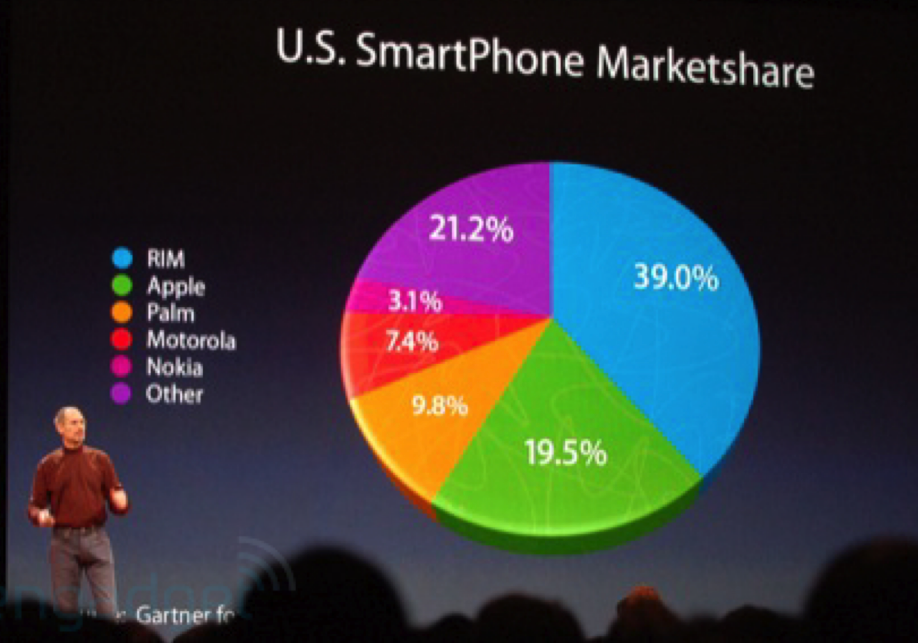
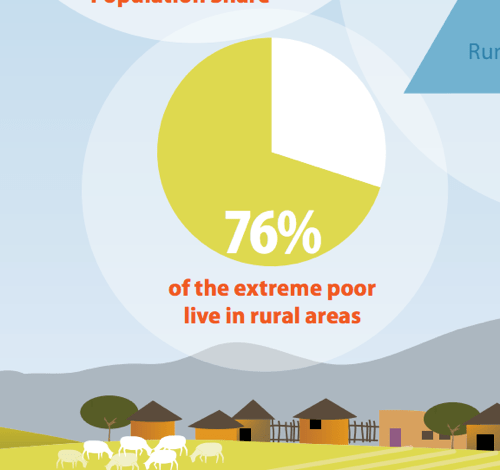
Pie Charts
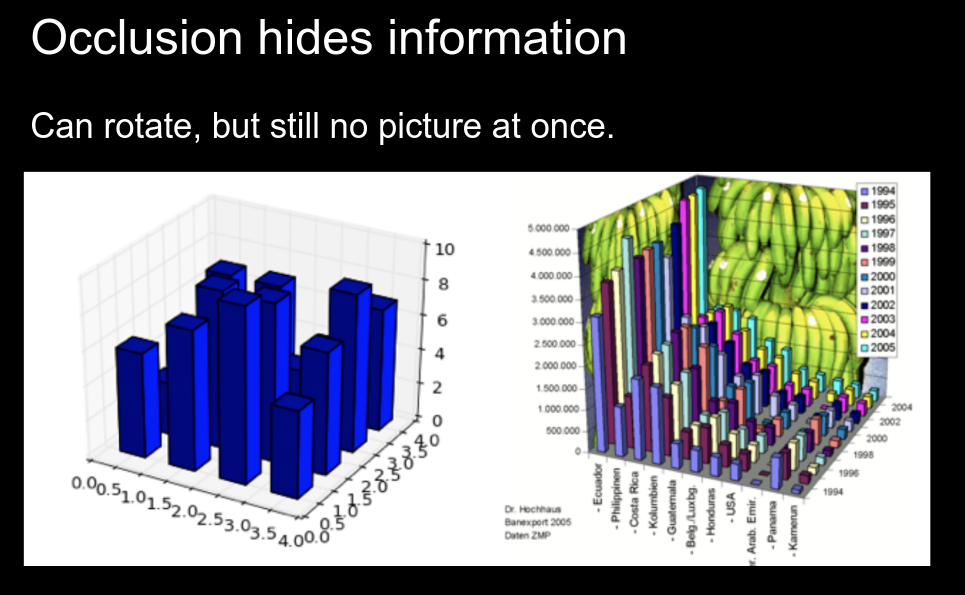
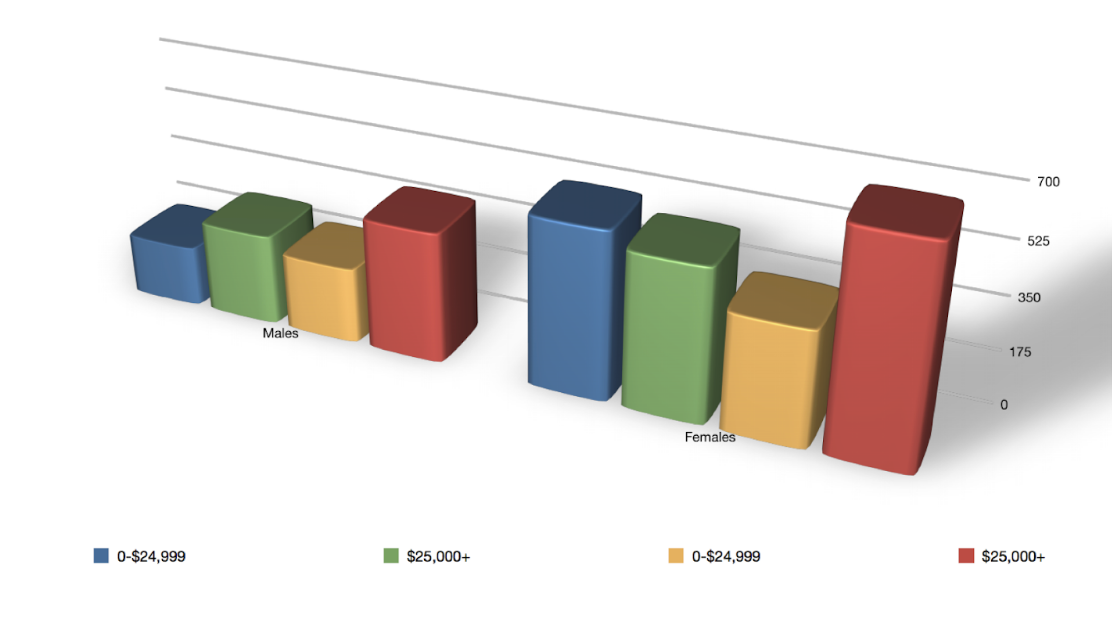
3D plots can lead to occlusion and confusion
and these are ugly colors!!
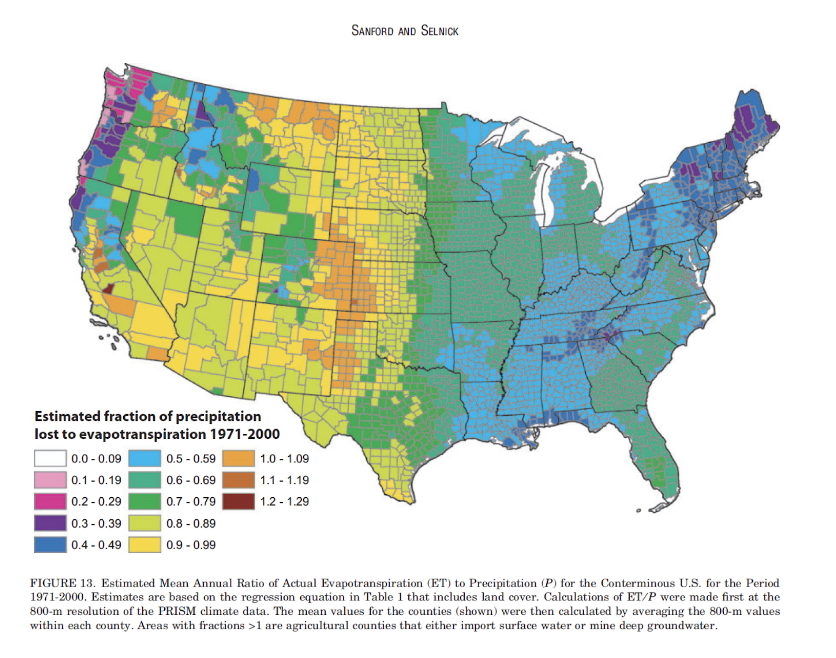
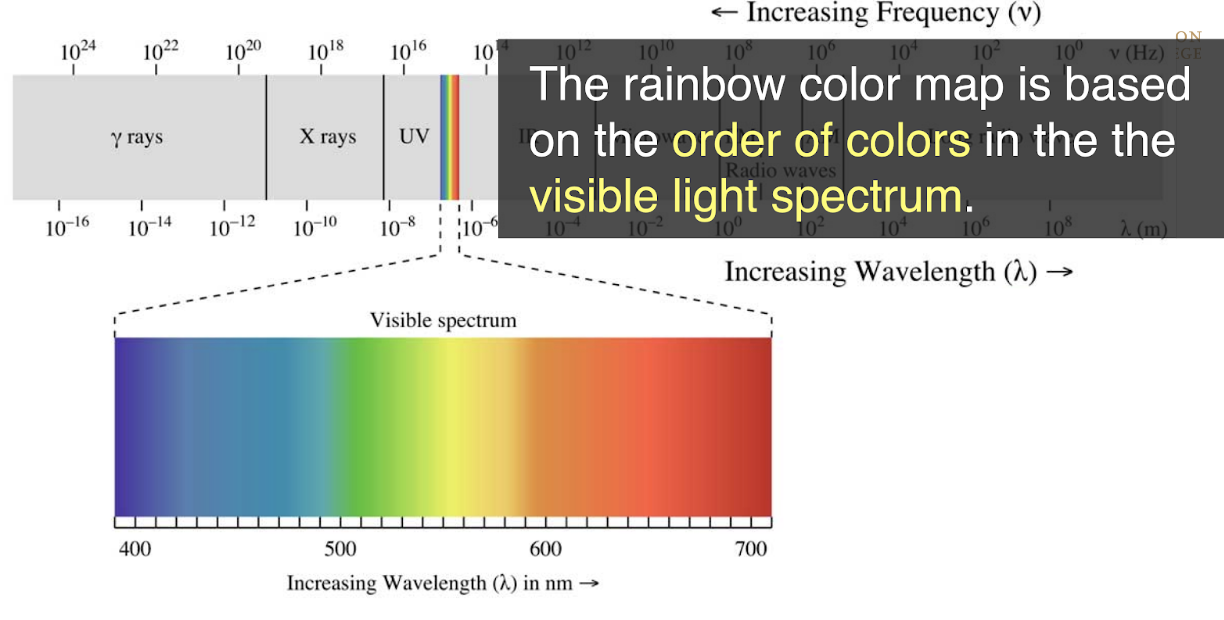
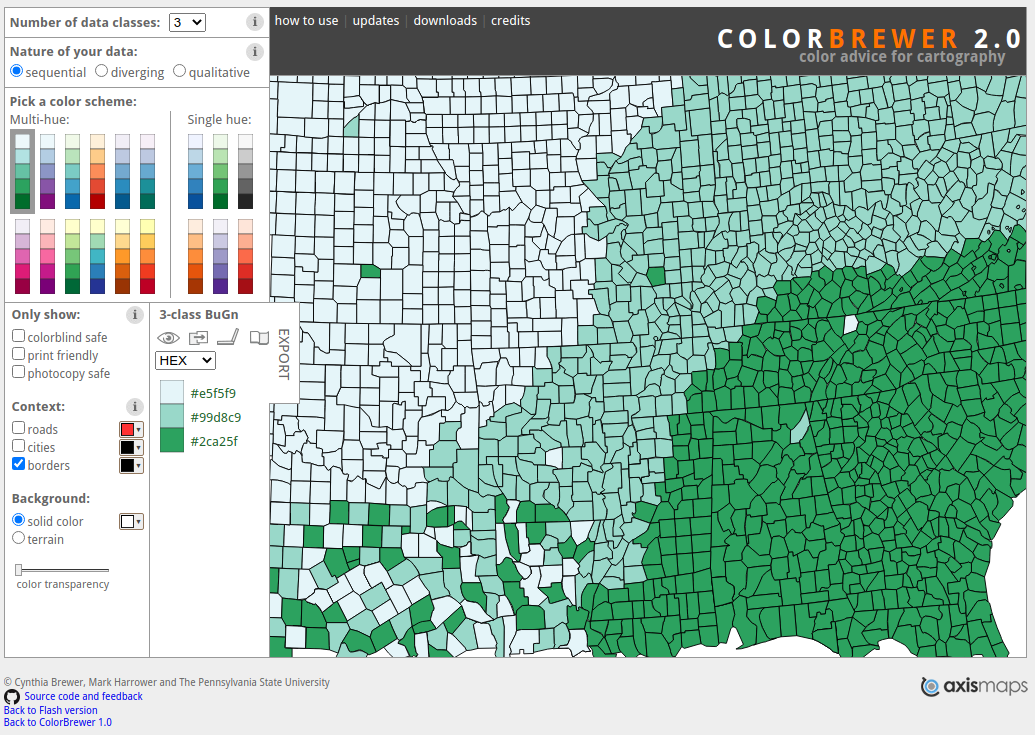
Colors!
Can you tell which color represents higher or lower values?
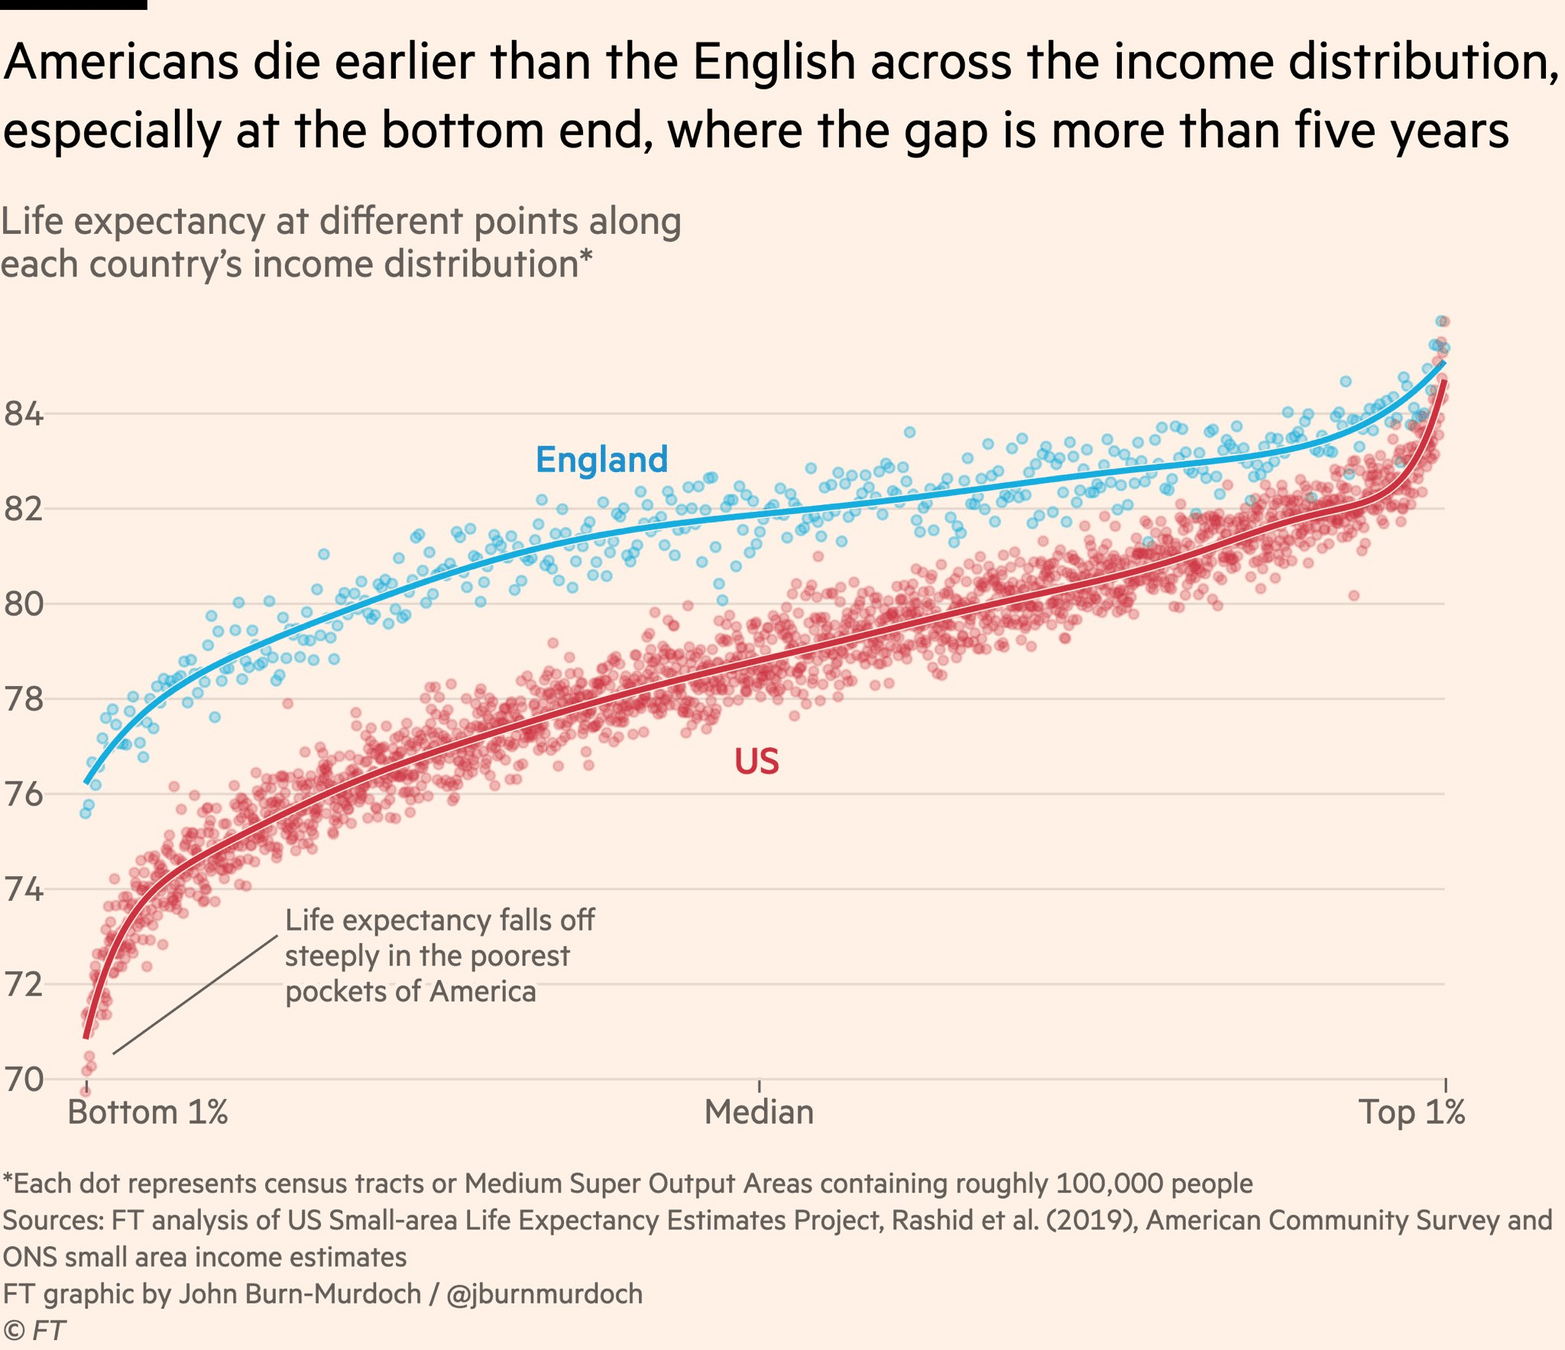
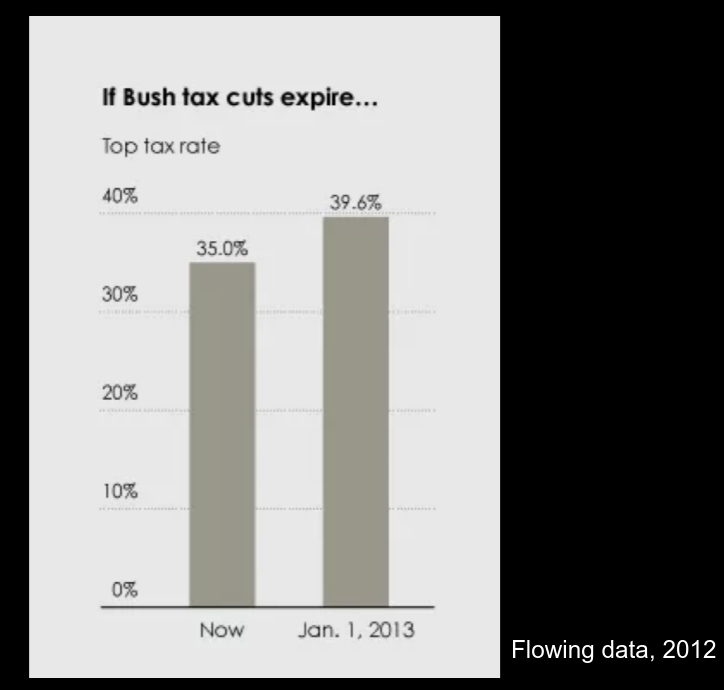
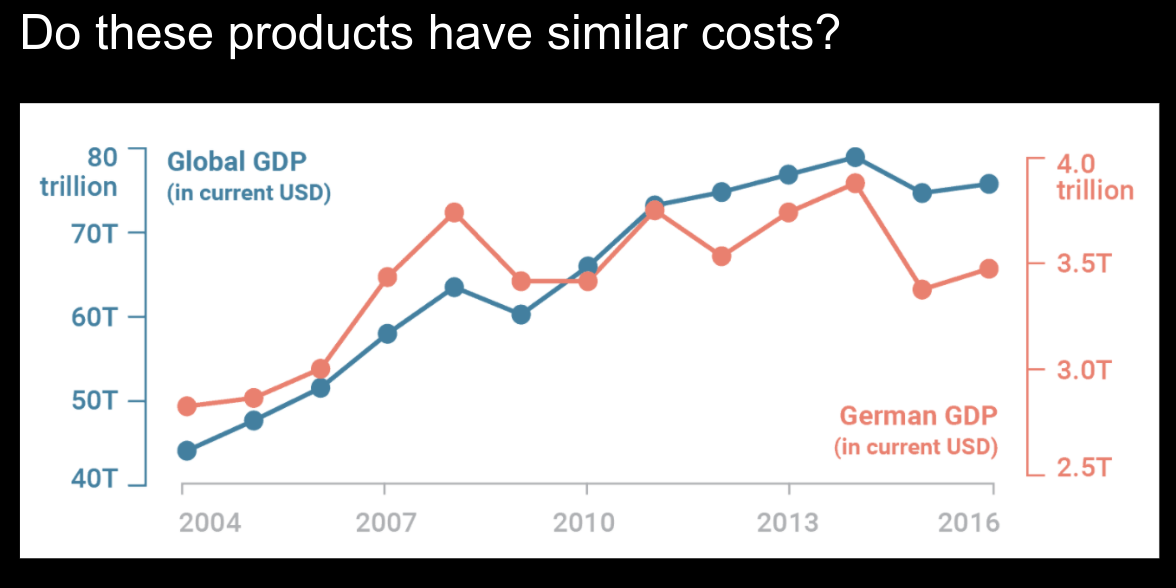
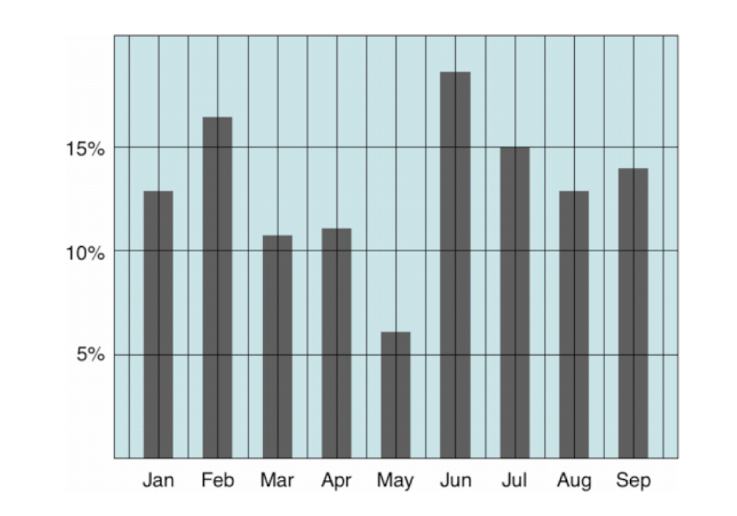
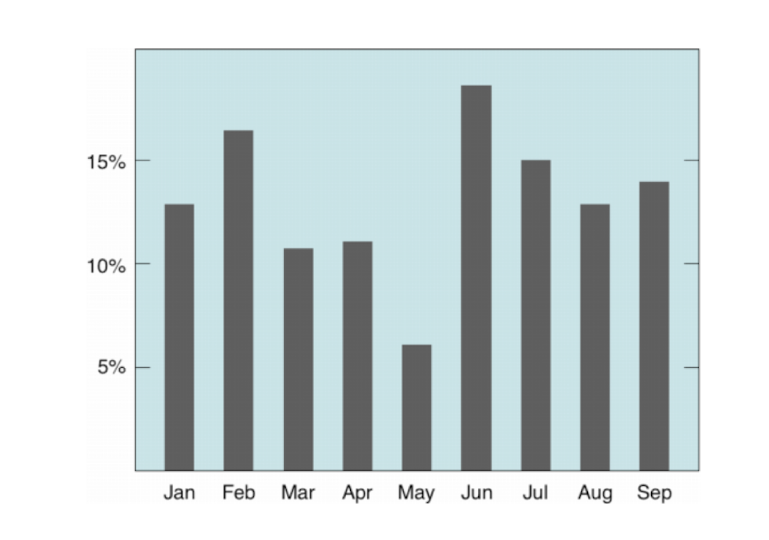
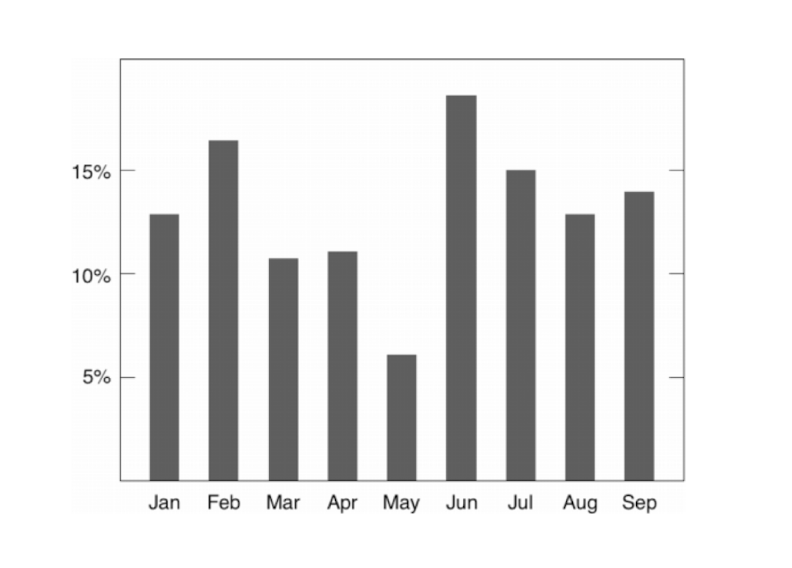
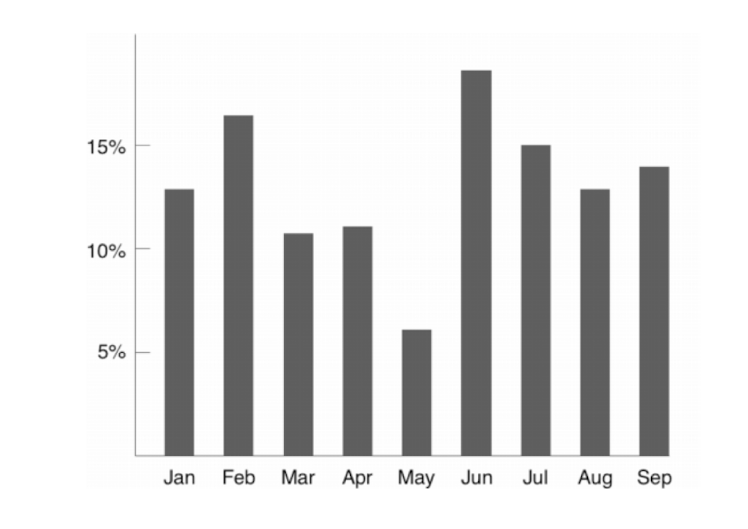
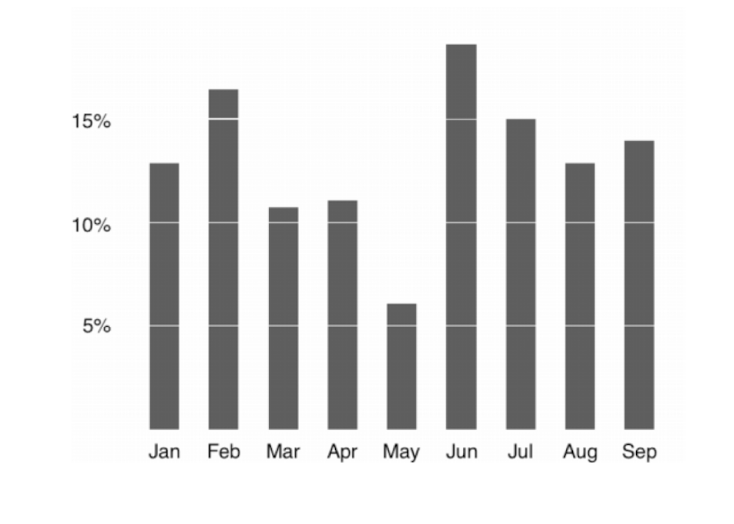
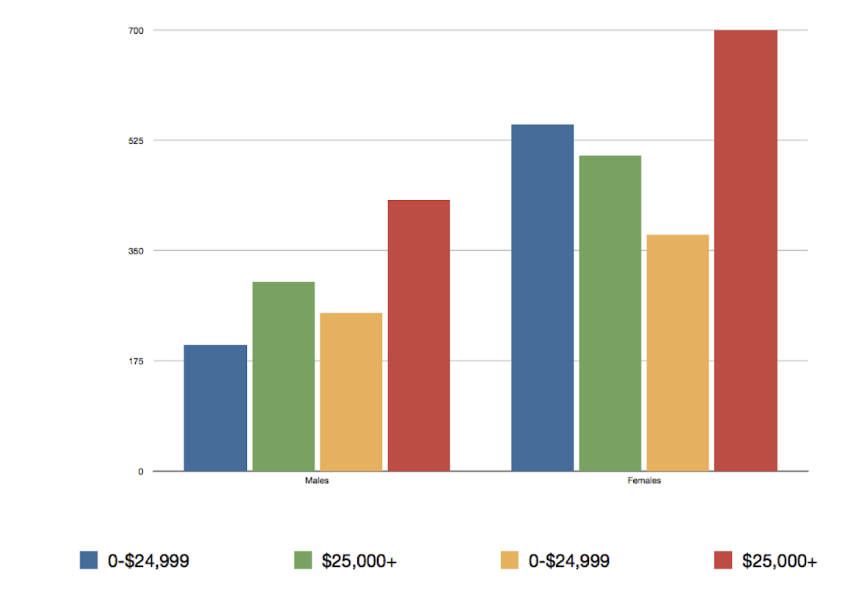
Let's make a chart beautiful!
What's wrong with this chart?
Source: World Bank
Scientific Visualization
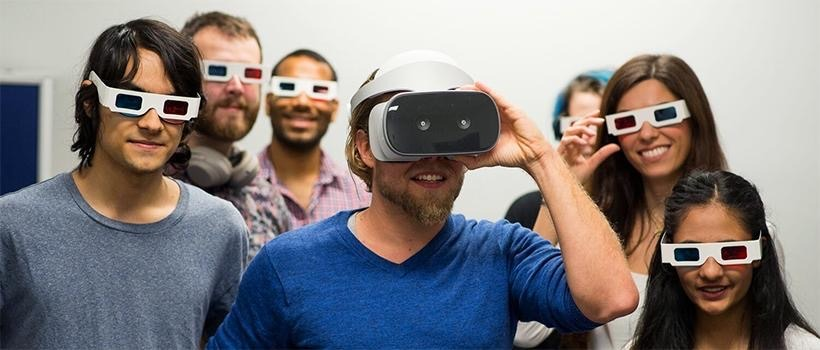
BYOD!
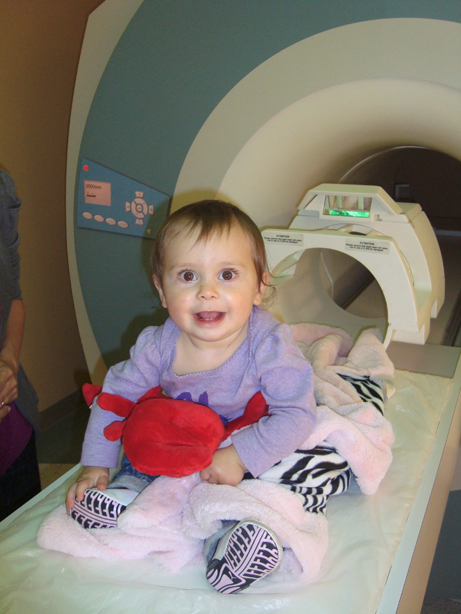
Brain Camera
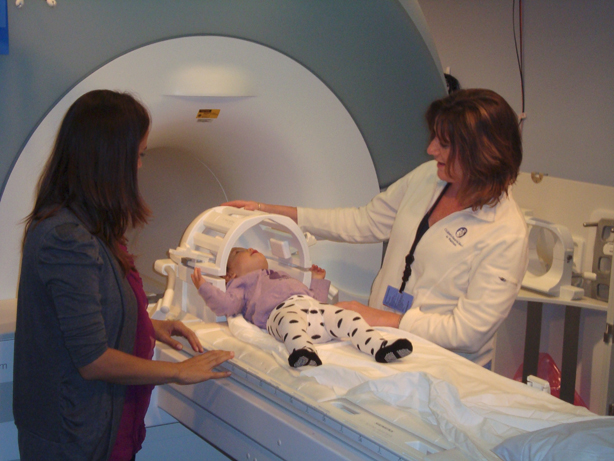
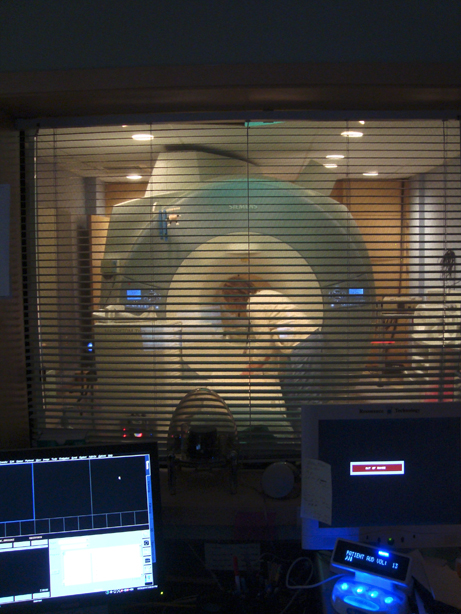
MRI Scanner
CT Scanner
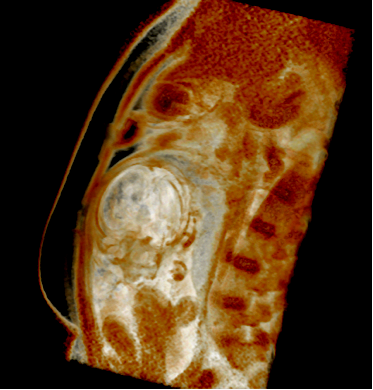
Fetal MRI
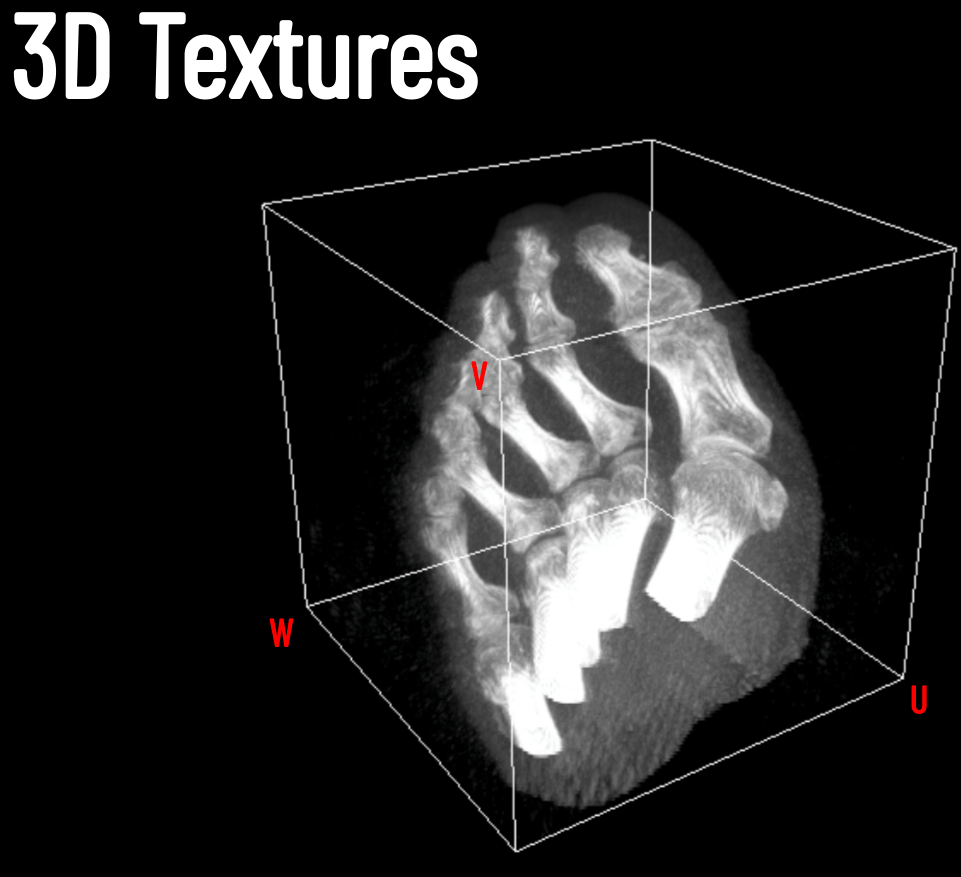
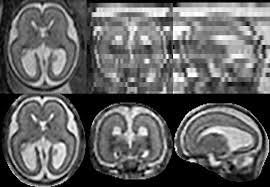
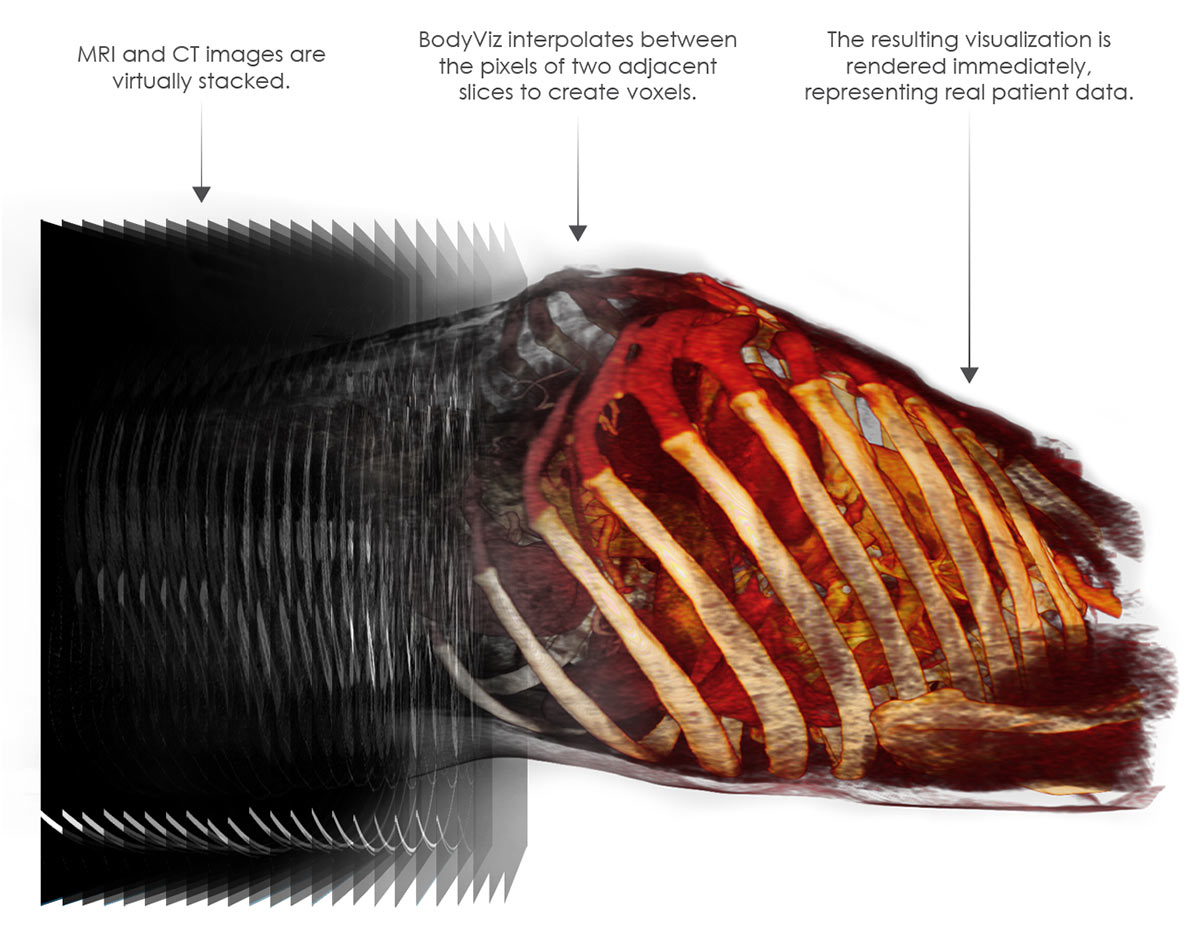
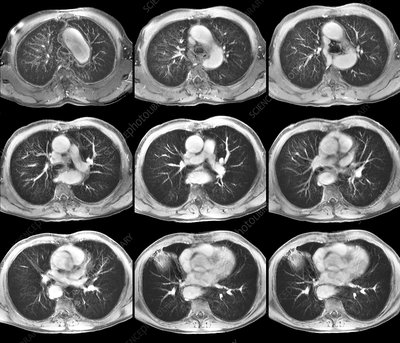
Image Volumes
2D
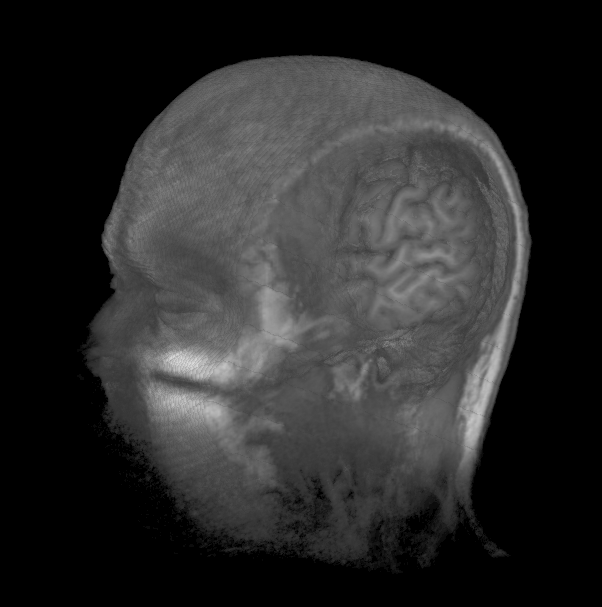
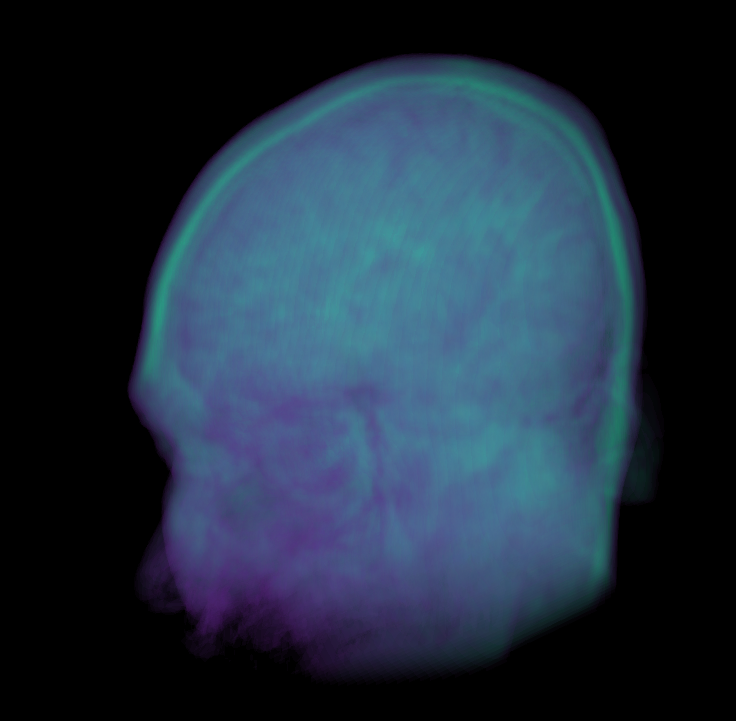
3D
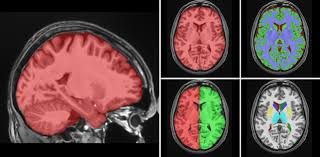
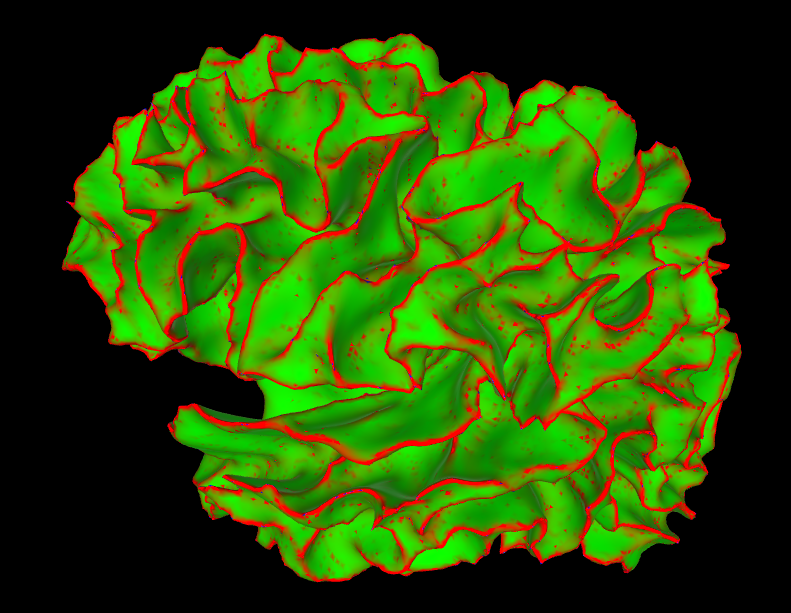
Marching Cubes creates 3D Meshes
Bill Lorensen 1987
Label Maps
R.I.P.
Ron Kikinis
B. Leonard Holman Professor of Radiology, Harvard Medical School
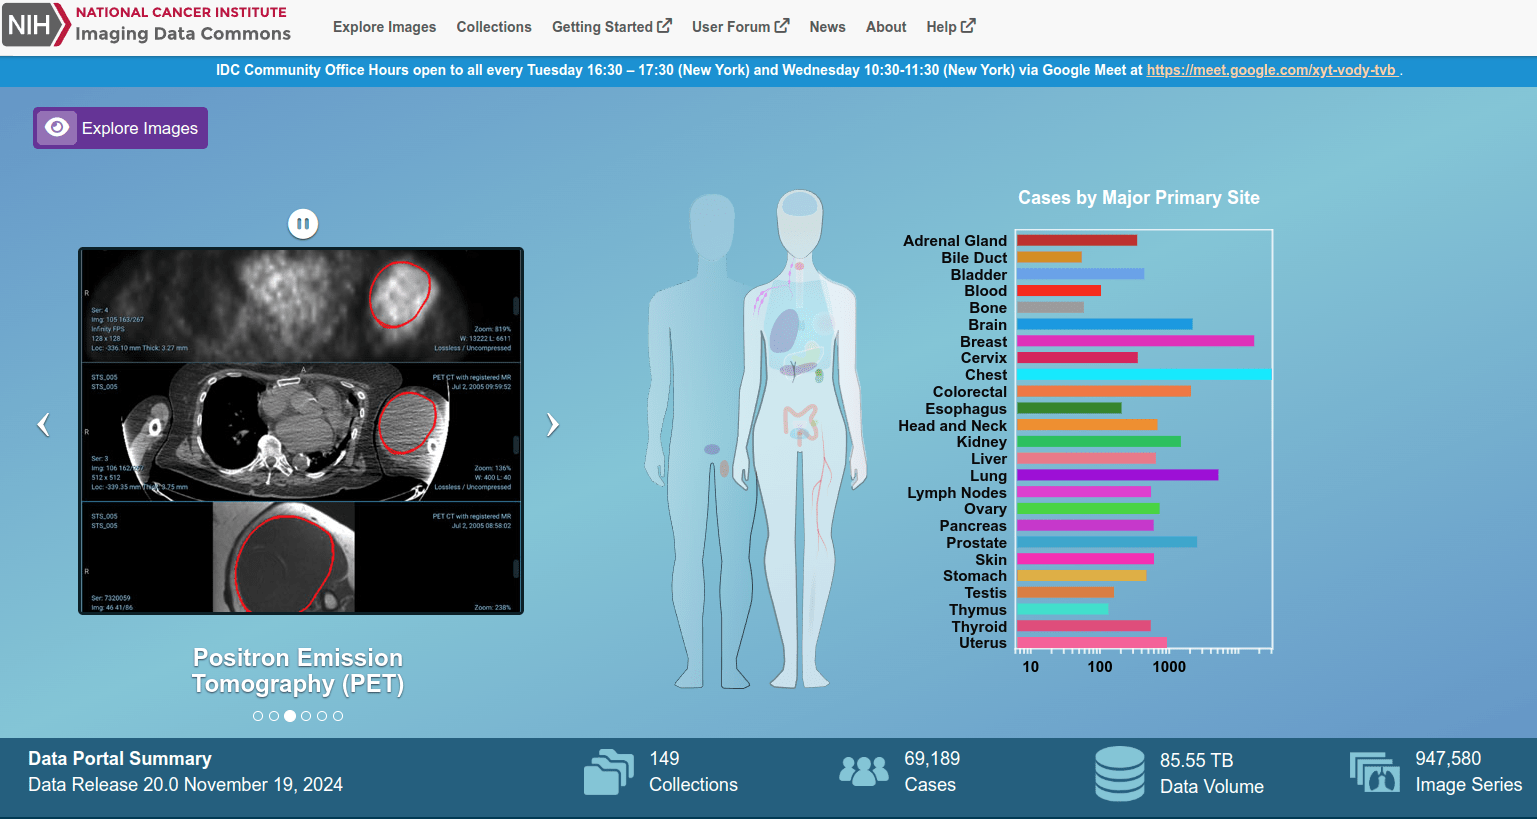
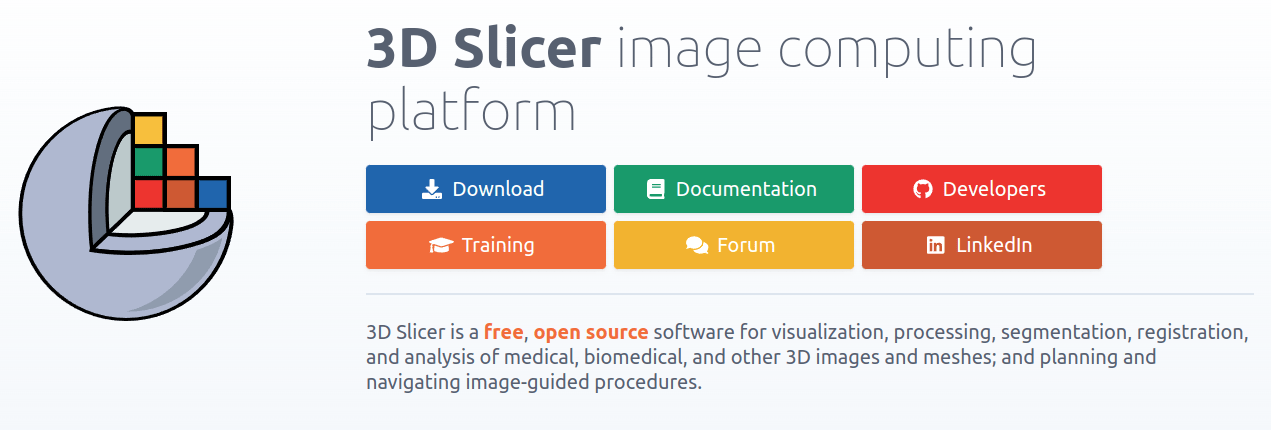
Download the same data to 3D Slicer using the IDC Browser extension!
Then, we will do Volume Rendering to analyze data and create a segmentation mesh of the tumor.
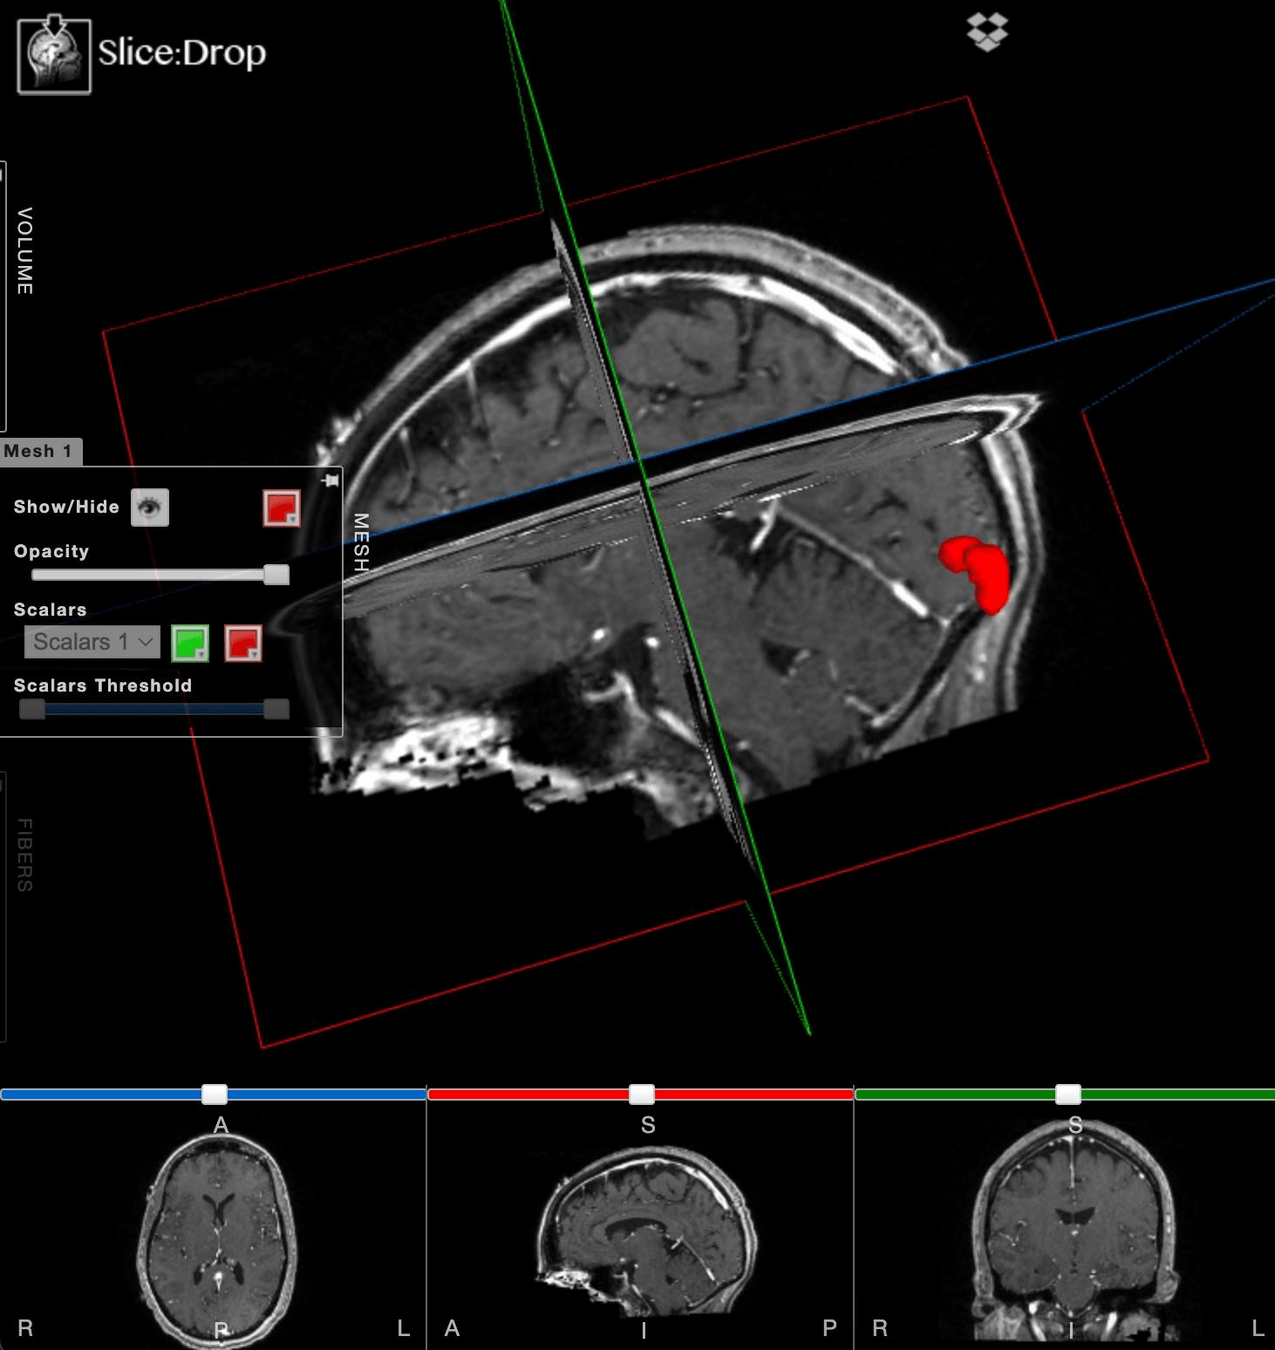
After export, let's load it in SliceDrop!
or BYOD!
window.onload = function() {

    r = new X.renderer3D();
    r.init();

    volume = new X.volume();
	volume.file = 'https://fly.cs.umb.edu/data/X/daniel.nii';

    r.add(volume);

    r.render();

}
find me (follow the ) and connect on LinkedIn!
By Daniel Haehn
Research Immersion in Cancer Genomics: Genomics & Data Science Workshop


