Monitoring
with ZenOSS
Agenda
- The Zen of monitoring
- What is monitoring? What is it for?
- The koans of monitoring
- The dharma of alerting
- What is alerting?
- Alert categories
- Anatomy of an alert
- The Kaizen with ZenOSS
- What is ZenOSS?
- Basics
- Metric collection
- Data to information
- Alerts and notifications
What is monitoring?
- Observe: State, Changes
- Identify: Events, Trends
What is it for?
- Baselining
- Evaluation
- Prevention
- Analysis
- Planning
- Automation
The koans of monitoring: Metrics
- Metrics are storage data structures for numeric inputs
- Time sliced inputs extracted from metrics are timeseries
- Statistical calculations can be applied to timeseries
- Combining those timeseries, these statistical calculations, and grouped with other timeseries, we got informational charts
- These charts answer the koans on the system
The koans of monitoring: Units
- Amounts are collections of values. Generic quantity stats. Matches in a search result, visitors, or packet sizes.
- Time delays shows time taken to complete something. Watch out average and high percentiles. CPU cycles per process, seconds per request, or minutes per visit.
- Amount per time depicts speeds and performance. Good to see distribution in high percentiles. Bitrate, IOPS, requests per minute, or monthly visitors.
The koans of monitoring: Quantities
- Flow recording events, usually aggregated. Consider distribution and high percentiles.
- Throughput, usually rates over time periods, represent continuity and intensity. Use them for thresholds and bottleneck identification.
- Stock arise assets' quantities. Single metrics.
- Availability are aggregated on expected results. Can be seen as percentage.
The koans of monitoring: Some stats
- n
- sum(n) of values from all inputs
- avg(n) Arithmetic mean
- max(n), min(n), p90(n), p95(n) Extreme values
- σ(n) Standard deviation
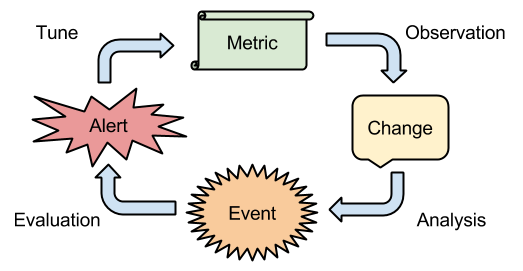
What is alerting?
- Detect: Changes, Events, Alarms
- Avoid: False positives and negatives
- Notify: Proper recipients

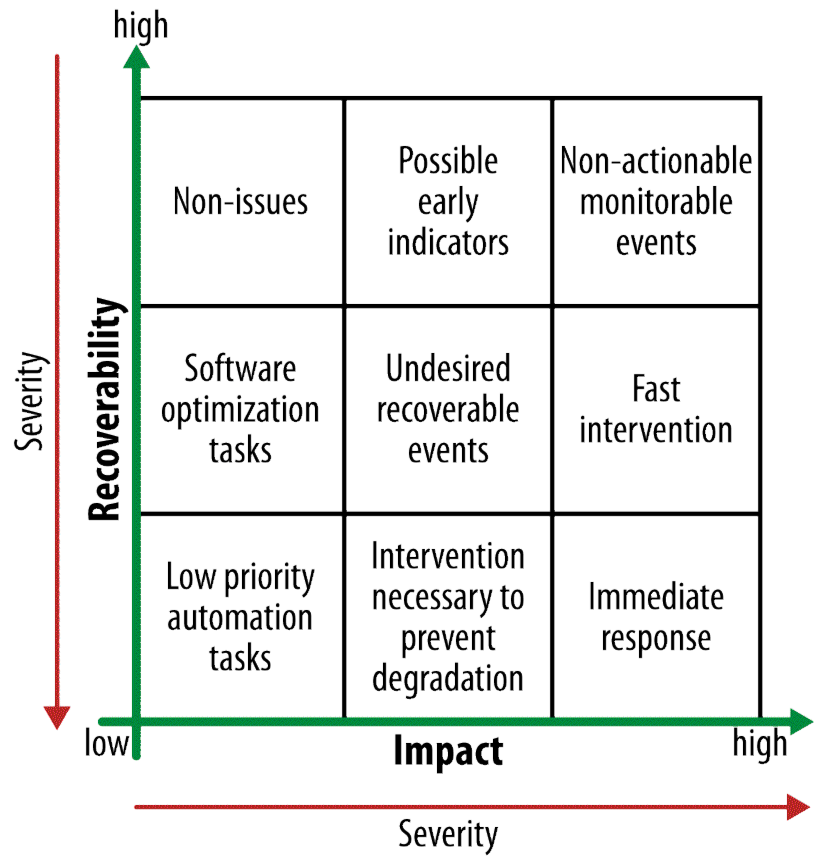
Alert categories

Anatomy of an alarm
- An alarm is a boolean function
- Result changes are alarm state transition
- It is composed of relations between inputs:
- Metric monitors: Thresholds on metric values
- Date/time evaluations: Alert in periods
- Other alarms: Coindicence of more alarms
What is ZenOSS?
- IT monitoring and alerting platform
- Open source
- Extendable
- Standard-based
- Automatable
- Flexible
What does it provide?
-
Discovery and inventory
-
API to interact with
-
Metric collection, graphing, and alerting
-
Event logging
-
Cross-referenced reports
-
SNMP, SSH, JMX, WMI, Nagios, NRPE
-
Monitoring daemons
-
Small fingerprint
Basics
-
Navigation
-
Adding nodes
- Node details
Metric collection
- Monitoring templates
-
Nagios perfdata
-
Daemons
Data to information
-
Reports
-
Graph creation
Alerts and notifications
- Events
- Triggers
Monitoring with ZenOSS
By Ignasi Fosch Alonso
Monitoring with ZenOSS
- 1,253


