Monitoring
with ZenOSS
Agenda
-
The
Zen
of monitoring
- What is monitoring? What is it for?
- The koans of monitoring
-
The
dharma
of alerting
- What is alerting?
- Alert categories
- Anatomy of an alert
- The Kaizen with ZenOSS
- What is ZenOSS?
- Basics
- Metric collection
- Data to information
- Alerts and notifications
What is monitoring?
- State
-
Changes
- Events
-
Trends
What is it key for?
- Incident and resource exhaustion prevention
- Availability and performance analysis
- Event management and response automation
- Decision making
- Evolutive product baselining
The koans of monitoring (I)
A metric is a data structure optimized for storage and retrieval of numeric inputs and their related properties.
Inputs from those metrics are extracted, within a time slice, producing timeseries, which combined with statistical calculations on them, and grouped with other timeseries, provides answers to questions on the state, trending, and evolution of the system.
With those grouped timeseries, based on those metrics,
and their related statistics,
monitoring tools and techniques can answer any
Koan
about support, planning, or business.
The koans of monitoring (II)
About metrics' units:
-
Amount
: Collection of discrete or continuous values. Most common type, like matches in a search result, or packet size.
- Time delays: Time for something to complete, like a CPU cicles for a task, seconds taken by a request, or minutes for a visit on the site. Most closely watched stats are average, median, and high percentiles.
- Amount per time: Discrete or continuous amount per unit of time, or throughput, like bit rate, IOPS, requests per minute, or monthly visitors. Good stat to watch is distribution via high percentiles.
About metrics' number of inputs: Multiple or Single
The koans of monitoring (III)
About metrics' type of quantity:
- Flow: It records events and related properties. Variable inputs from multiple sources are aggregated. Distribution and high percentiles are meaningful stats.
- Throughput: It measures rate of processing over period of time. recording continuity and intensity. Used to alert on threshold surpassing and to identify bottlenecks.
- Stock: It shows assets' quantities at specific point in time, so these are single metrics. Flow and throughput represent changes and intensity of these.
- Availability: Aggregated metric on an expected result. Low variability (0 or 1), can be yielded to an availability percentage.
What is alerting?
To detect and notify proper recipients
about meaningful events that denote a
grave change of state
. It requires good balance between sensitivity and specificity to avoid false positives.
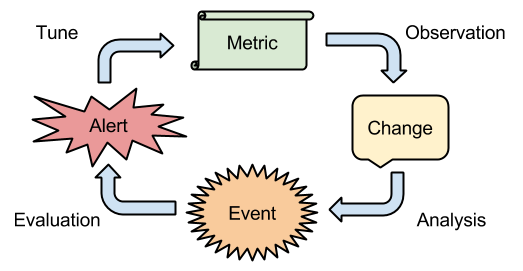
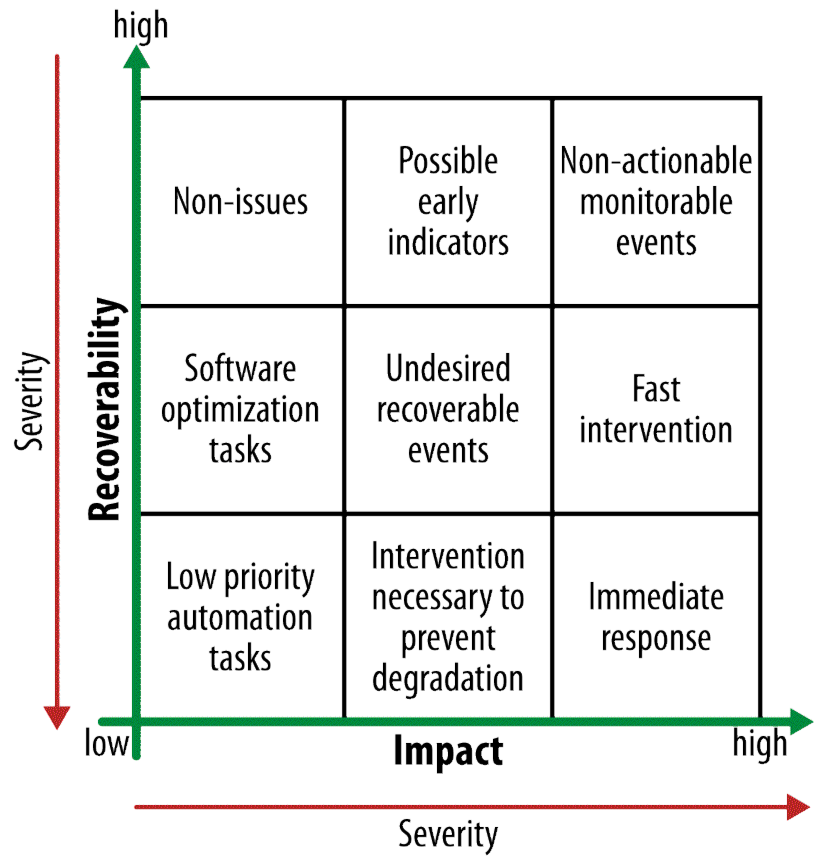
Alert categories
Anatomy of an alarm
An alarm is a boolean function, returning alert (1) or clear (0). Any change in the result is an alarm state transition, which will imply an action to be taken. It is composed of relations between boolean inputs of three types:
-
Metric monitors, which reacts to trespassed thresholds on metric values. Those can be upper, lower, out of range, or not recorded values.
-
Date/time evaluations, so maintenance windows and automated processes causing metrics to change would prevent the alarm to activate the action. Or the contrary, to make this happen.
-
Other alarms, so action would be taken if two alarms happen simultaneously or not.
What is ZenOSS?
Complete IT monitoring and alerting platform, including inventorying features. It's open source, extendable, standard-based, flexible and automatable.
What does it provide?
-
Discovery and inventory
-
API to interact with
-
Metric collection, graphing, and alerting
-
Event logging
-
Cross-referenced reports
-
SNMP, SSH, JMX, WMI, Nagios, NRPE
-
Monitoring daemons
-
Small fingerprint
Basics
-
Navigation
-
Adding nodes
- Node details
Metric collection
- Monitoring templates
-
Nagios perfdata
-
Daemons
Data to information
-
Reports
-
Graph creation
Alerts and notifications
-
Events
-
Triggers
-
Users
Login
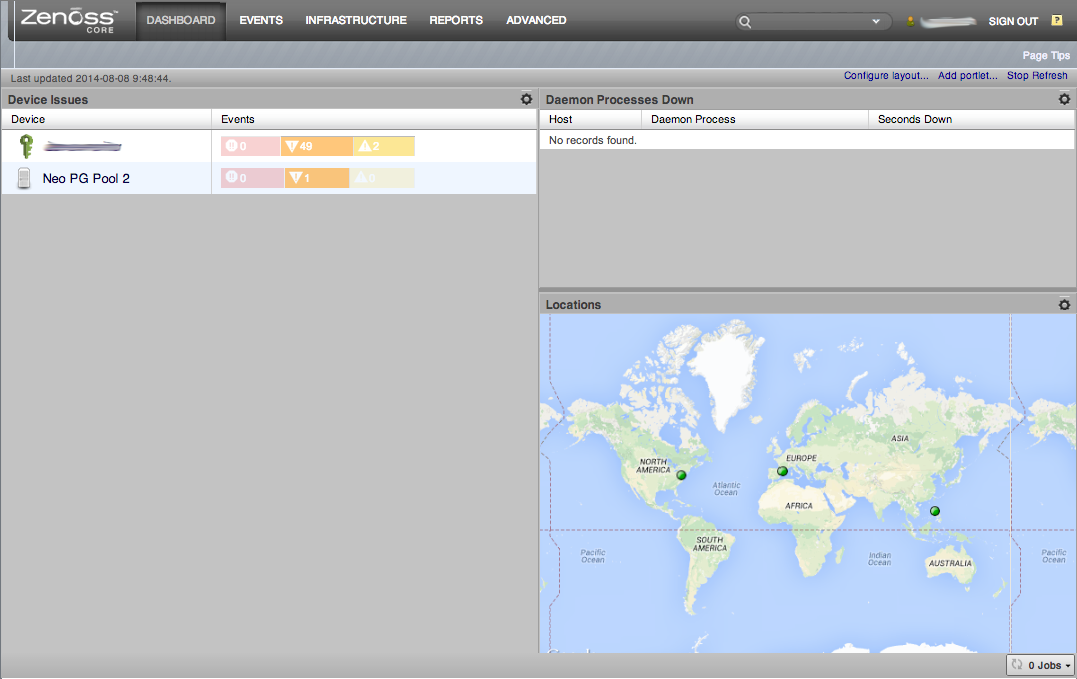
Dashboard
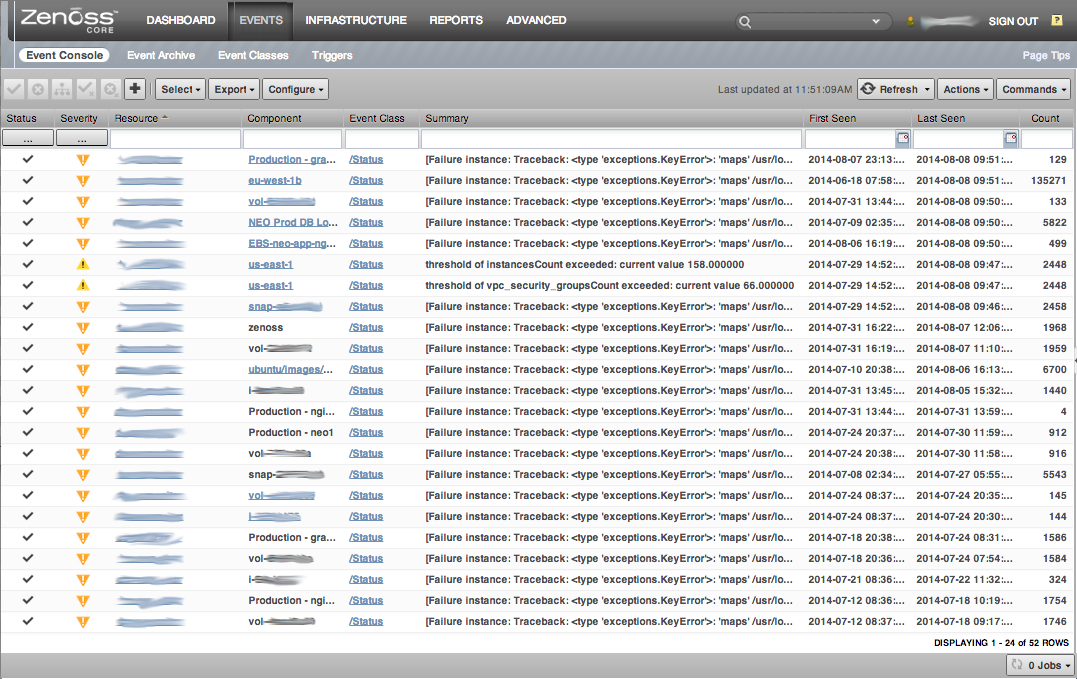
Events
Infrastructure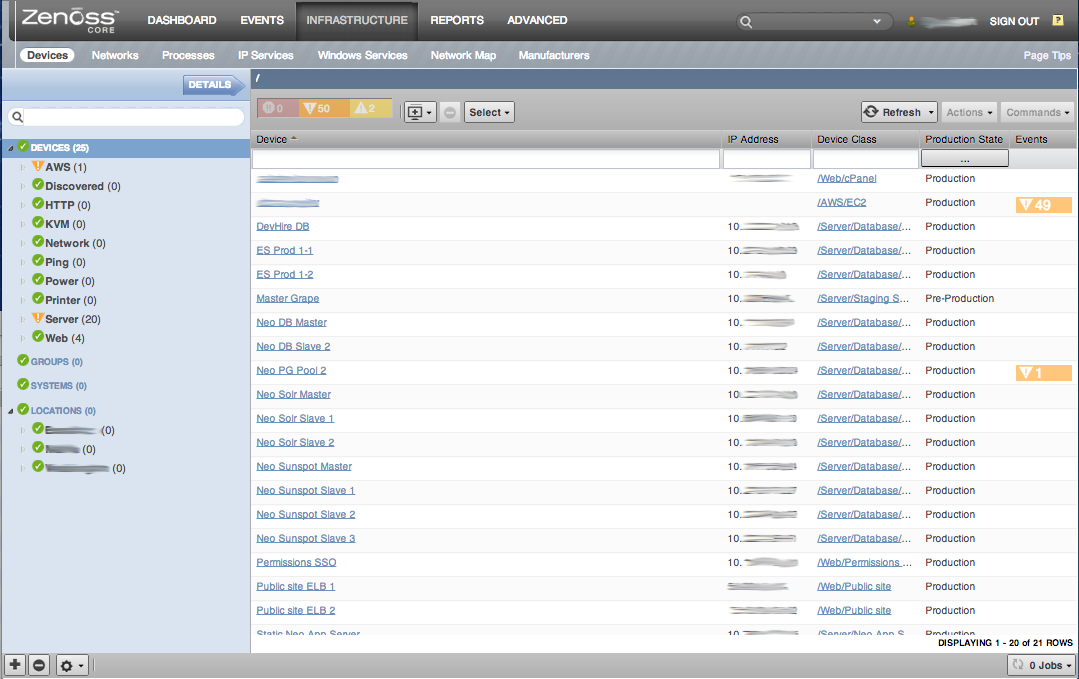
Reports
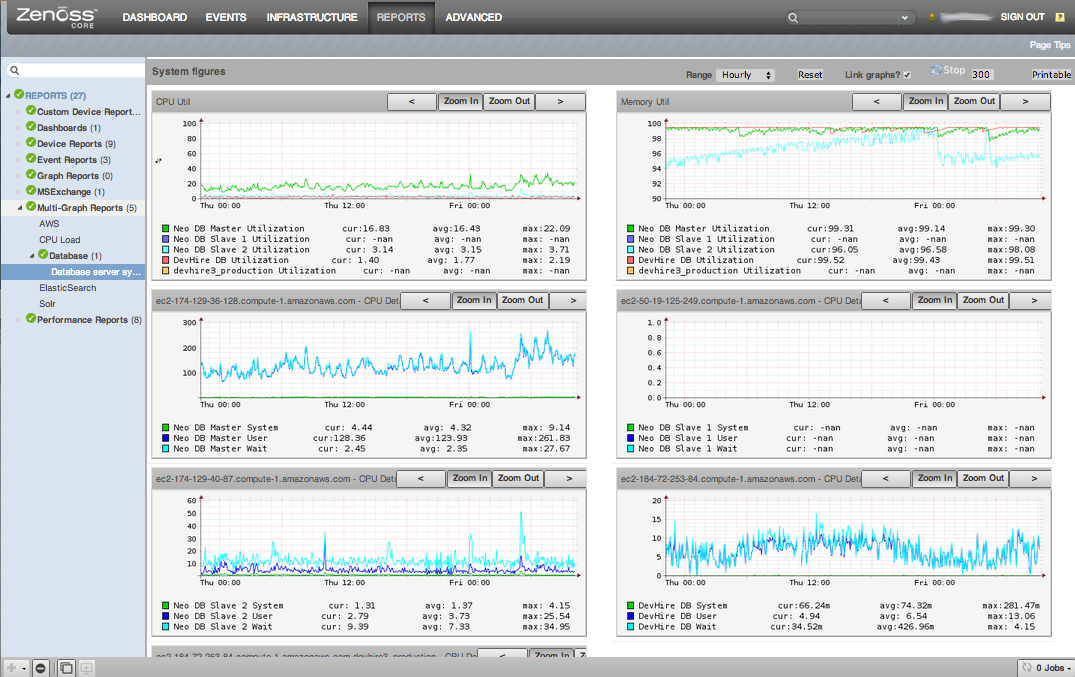
Advanced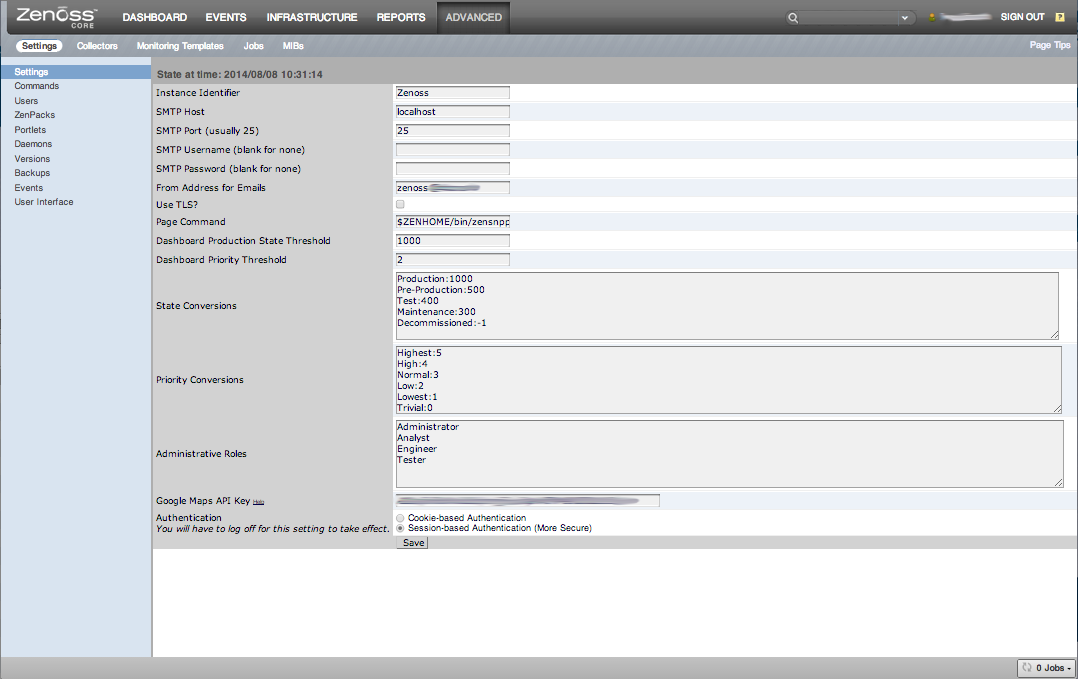
Monitoring with ZenOSS (OLD)
By Ignasi Fosch Alonso
Monitoring with ZenOSS (OLD)
- 1,068
