


Ishanu Chattopadhyay PRO
ML Data Science Biomedicine Social Science Faculty
The Ethical Conundrum of Standardized Screening
Ishanu Chattopadhyay
Assitant Professor, Medicine
04.19.2023
Ian Cero, Peter A. Wyman, I. Chattopadhyay, Robert D. Gibbons, Predictive equity in suicide risk screening, Journal of the Academy of Consultation-Liaison Psychiatry, 2023. https://doi.org/10.1016/j.jaclp.2023.03.005
AI
Equity
&
Fairness
Ian Cero
Peter Wyman
Robert Gibbons
Suicide is a major public health concern
1 death by suicide every 40 seconds
As per the data from the CDC, in 2019, there were over 47,500 suicide deaths in the U.S., with an age-adjusted rate of 13.9 per 100,000 individuals.
10th leading cause of death in the United States
Screening Tests are Increasingly common
Columbia-Suicide Severity Rating Scale (C-SSRS)
Patient Health Questionnaire-9 (PHQ-9)
Ask Suicide-Screening Questions (ASQ)
These screening tools are not meant to be diagnostic but rather to help identify individuals who may need further evaluation or intervention to prevent suicide.
Primary Care
Emergency Dept
School & Community
Screening Tests are Increasingly common
Columbia-Suicide Severity Rating Scale (C-SSRS)
Patient Health Questionnaire-9 (PHQ-9)
Ask Suicide-Screening Questions (ASQ)
Primary Care
Emergency Dept
School & Community
The increasing standardization of suicide risk screening suggests predictive models balance not only accuracy, but also fairness for the different groups of people whose futures are being predicted
Accuracy
Fairness
Group A
Group B
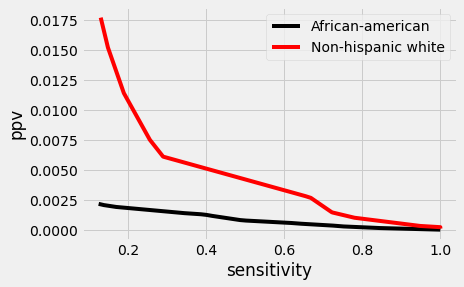
Ask Suicide-Screening Questions (ASQ) has high and equivalent sensitivity and specificity for suicide ideation across black and white youth in the emergency department.
Black
Sensitivity
Specificity
Non-Hispanic White
Equal across groups
ASQ
Different Base rates (prevalence)
6.11 per 100,000*
15.68 per 100,000*
Non-Hispanic White
Black
*CDC 2019 Data
Uneven base rates
Mathematically unavoidable trade-off between model accuracy and fairness
Another Example: criminal recidivism
ProPublica recently analyzed over 10,000 of the actual predictions from a popular recidivism prediction model (COMPAS)
Black defendants were twice as likely as white defendants to receive a false positive classification
Creators of COMPAS presented equally compelling findings
model’s overall classification accuracy (about 64%) was in fact equal for both black and white defendants
UNLIKELY due to "biased data", or model
Predictive disparity is likely caused by uneven base rates on the outcome being predicted*
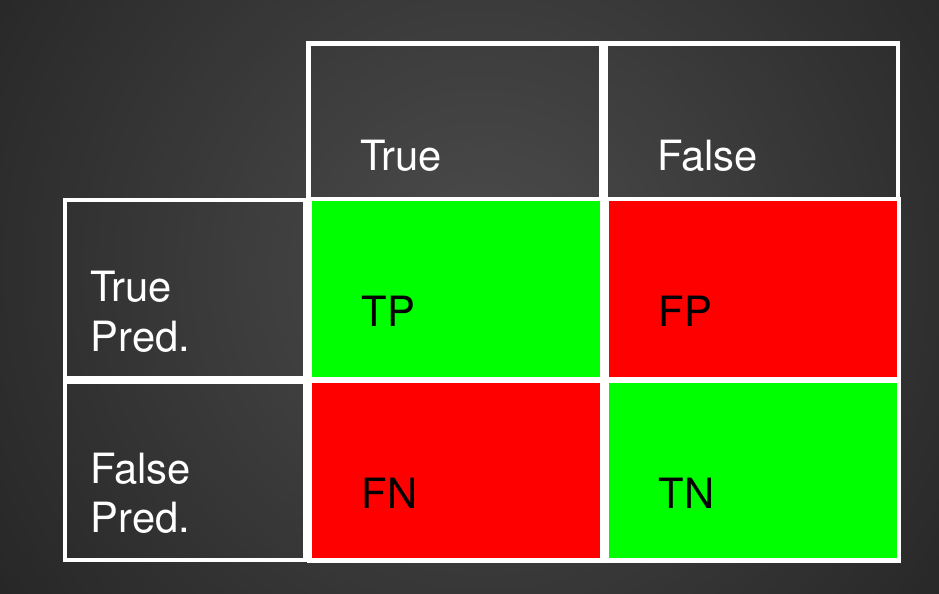
Classification Problem
Target Condition
Target Condition
Target Condition
Target Condition
Target Condition
Target Condition
Target Condition
Target Condition
Target Condition
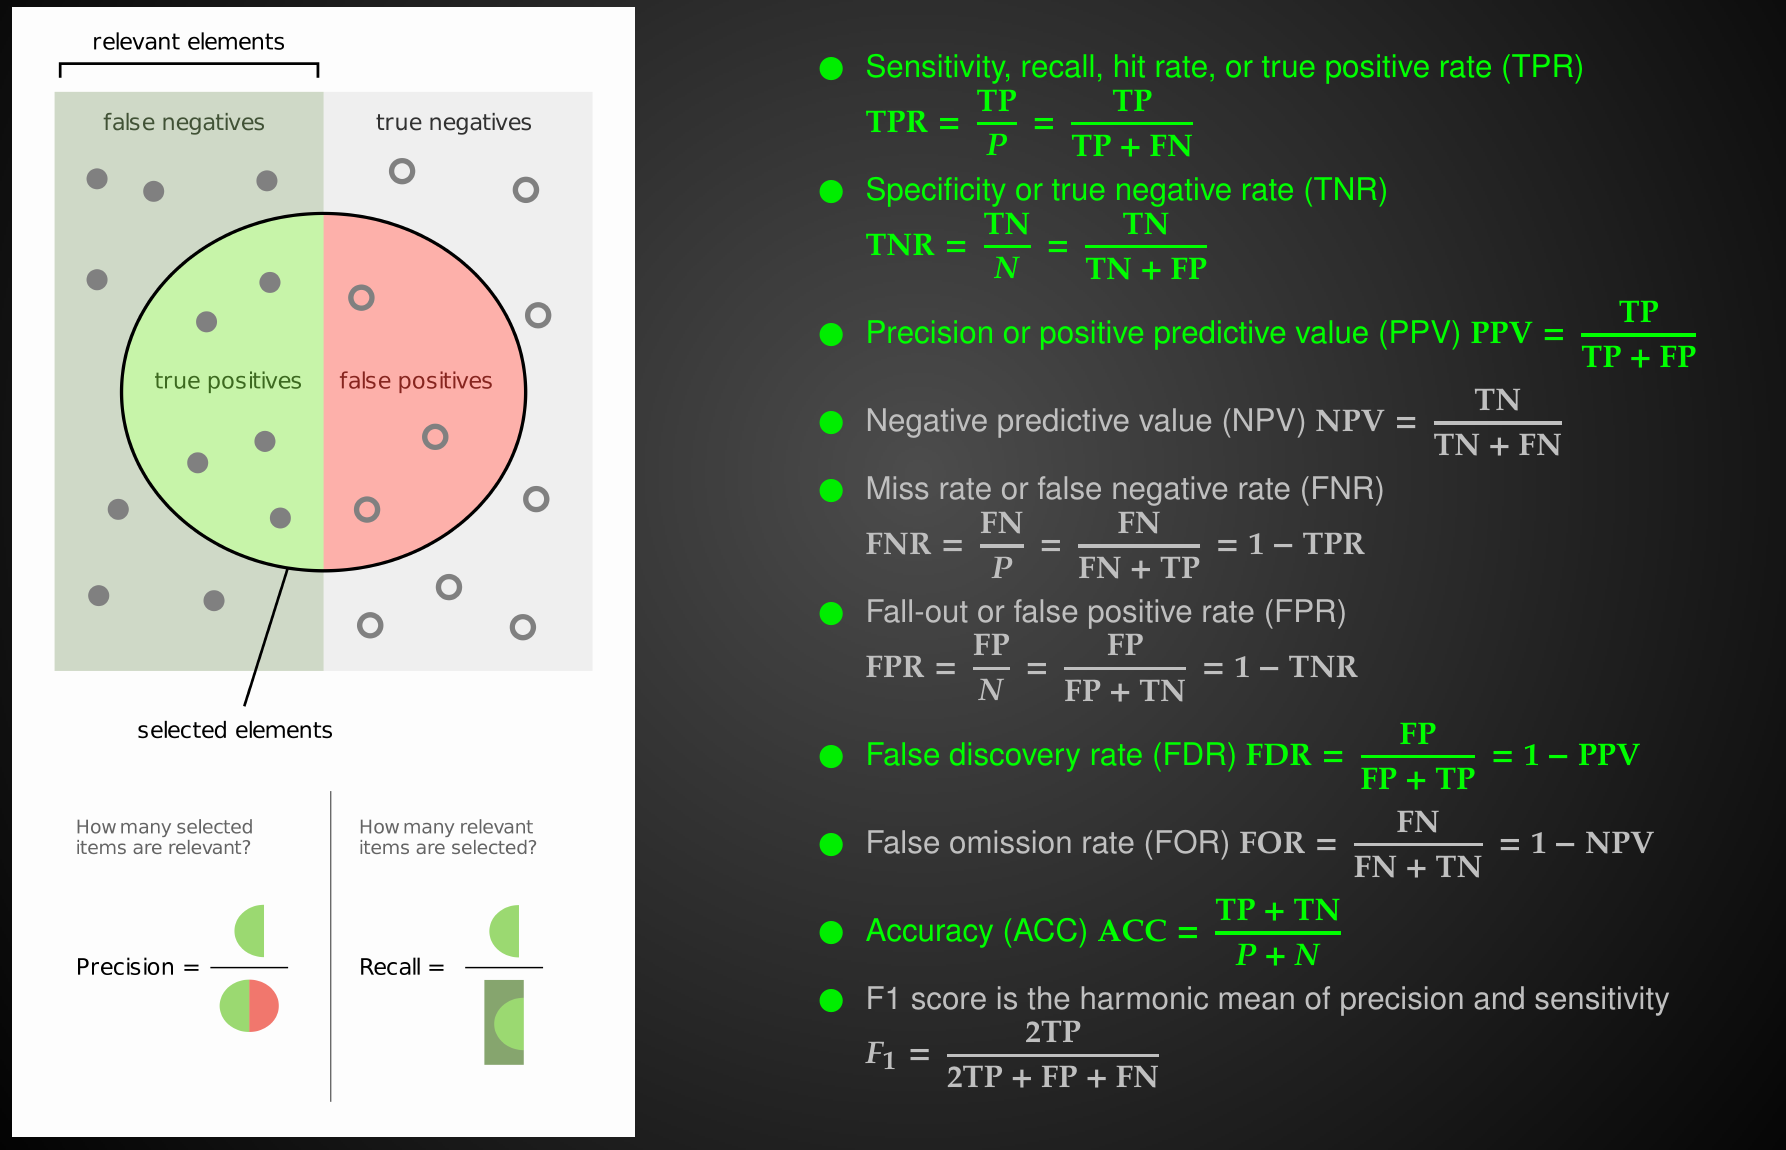
sensitivity
specificity
precision
prevalence
prevalence is intrinsic property of the disease
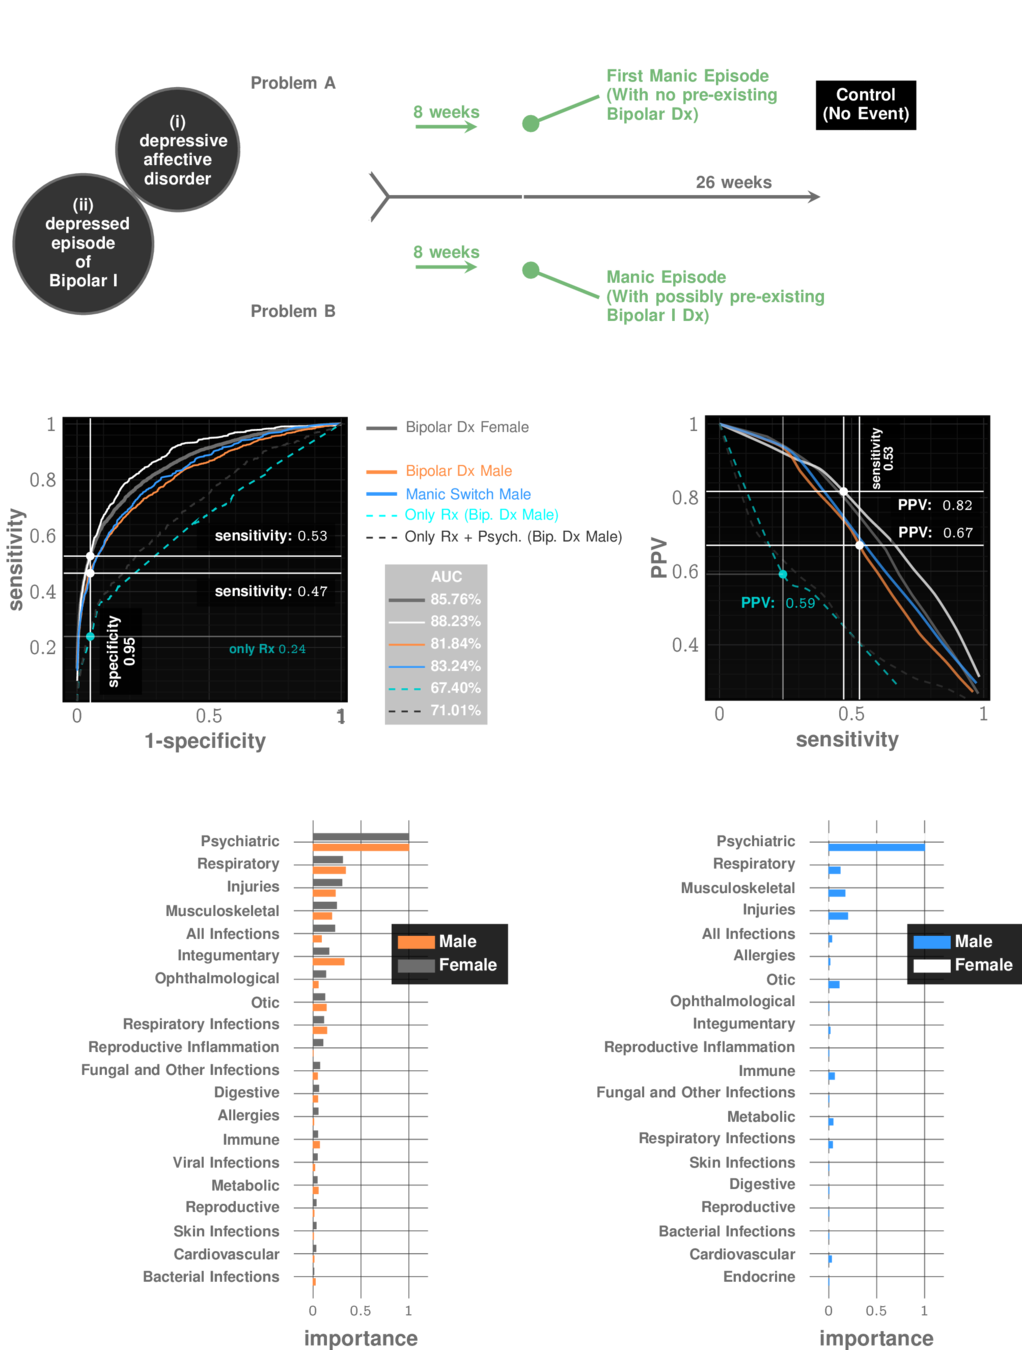
Manic Episode with no Bipolar history
prevalence: ~10%
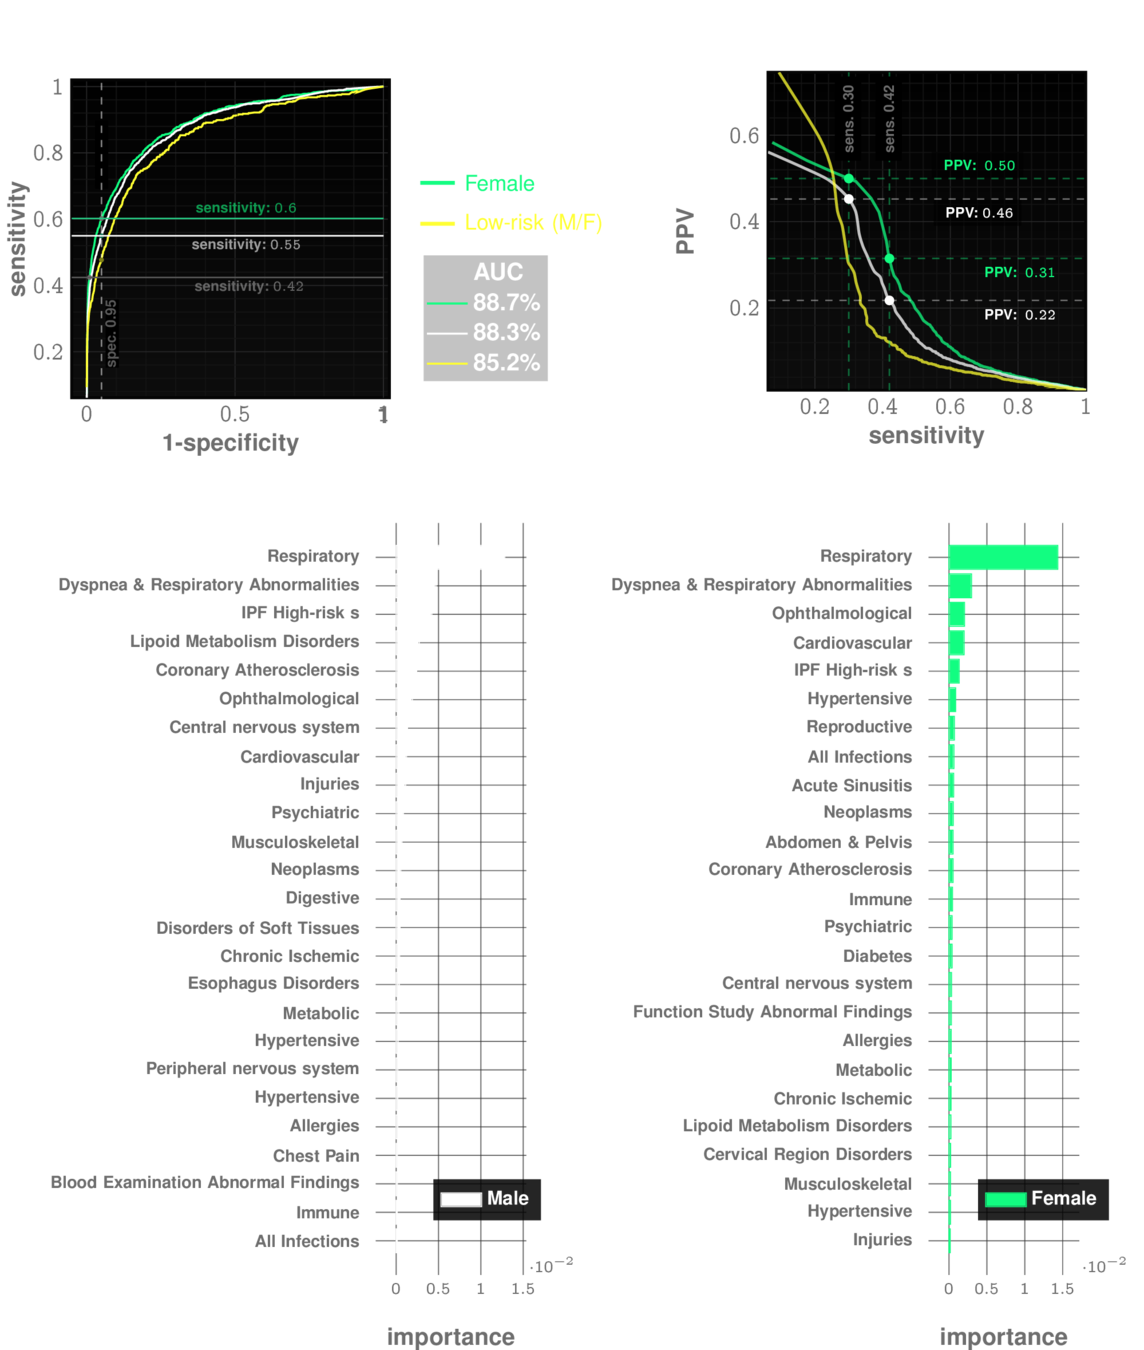
Idiopathic Pulmonary Fibrosis
prevalence: ~0.5%
The decision threshold is upto us to decide
Impacts sensitivity & specificity
Each choice of a threshold produces a different test
$$t_p/f_p$$
$$\frac{\rho}{1-\rho}$$
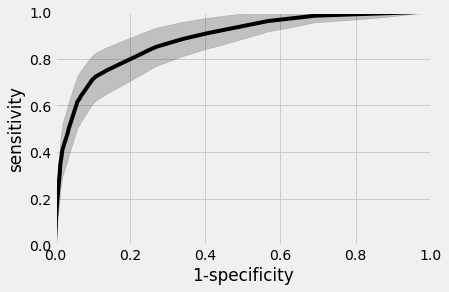
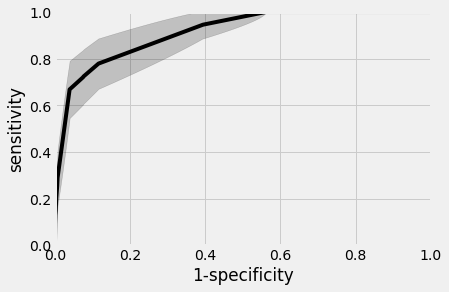
UCM Data
Blacks
Non-Hispanic Whites
AUC~90%
AUC~88%
Universal SCreening for Suicidal Ideation / Attempts
UCM Data
Universal SCreening for Suicidal Ideation / Attempts
UCM Data
Universal SCreening for Suicidal Ideation / Attempts
UCM Data
Universal SCreening for Suicidal Ideation / Attempts
$466,700
$135,700
15
Assume you have $1,000,000 to allocate to the post-screening followup service
67%
33%
25
Number of actual individuals helped
Demographic breakdown at UCM
=40
9
Assume you have $1,000,000 to allocate to the post-screening followup service
44%
66%
49
Number of actual individuals helped
Demographic breakdown at UCM
+
Differential
base
rate
=58
Race-blind followup
21
Assume you have $1,000,000 to allocate to the post-screening followup service
100%
0%
0
Number of actual individuals helped
=21
17
Assume you have $1,000,000 to allocate to the post-screening followup service
77.5%
22.5%
17
Number of actual individuals helped
Equal outcome
allocation
=34
No blood tests, no questionnaires, just diagnostic codes.
Instantaneous Universal Screening at Primary Care.
Works even for patients without history of mental disorders.
Screening
Posterior odds of SI/SA
in flagged population:
13 in 20
Prior odds of SI/SA
in general population:
1 in 20
3 out of 13 true flags have no prior history of mental disorders
The Screening Test is at its performance limit
The Ethics Question
Distribute resources race-blind
Distribute resources to make equal outcomes
Lives saved
58
34
The new frontier of predictive fairness in suicide prediction
By Ishanu Chattopadhyay
Predictive modeling of crime and rare phenomena using fractal nets


