


Ishanu Chattopadhyay PRO
ML Data Science Biomedicine Social Science Faculty
CCTS 45200
Ishanu Chattopadhyay
Assitant Professor, Medicine
07.24.2023
Study Questions
1. What is Machine Learning? What are the key application in the context of medicine?
2. What does it bring to the table in the context of Health Services and Bio-medicine? Are there new questions that we can answer?
3. Does it suffice to draw on off-the-shelf models?
4. What are the new/emerging ideas?
HW
1. What is Machine Learning? What are the key application in the context of medicine? Which of teh reading list are more "ML" and which are more "statistical'?
2. What does it bring to the table in the context of Health Services and Bio-medicine? Are there new questions that we can answer?
3. Does it always suffice to draw on off-the-shelf models? Why or why not?
4. What are some new/emerging ideas beyond image classification and "drug discovery" in AI applications in medicine?
Reading
Dmytro Onishchenko, Robert J. Marlowe, Che G. Ngufor, Louis J. Faust, Andrew H. Limper, Gary M. Hunninghake, Fernando J. Martinez, Ishanu Chattopadhyay, "Screening for idiopathic pulmonary fibrosis using comorbidity signatures in electronic health records", Nature Medicine, sep, 2022.
Dmytro Onishchenko, Daniel S. Rubin, James R. van Horne, R. Parker Ward, Ishanu Chattopadhyay 65;6602;1c, "Cardiac Comorbidity Risk Score: Zero Burden Machine Learning to Improve Prediction of Postoperative Major Adverse Cardiac Events in Hip and Knee Arthroplasty", Journal of the American Heart Association, vol. 11, no. 15, pp. e023745, 2022.
Dmytro Onishchenko, Yi Huang, James van Horne, Peter J. Smith, Michael E. Msall, Ishanu Chattopadhyay, "Reduced false positives in autism screening via digital biomarkers inferred from deep comorbidity patterns", Science Advances, vol. 7, no. 41, oct, 2021.
Robert D. Gibbons, Ishanu Chattopadhyay, Herbert Y. Meltzer, John M. Kane, Daniel Guinart, "Development of a computerized adaptive diagnostic screening tool for psychosis", Schizophrenia Research, vol. 245, pp. 116–121, jul, 2022.
zed.uchicago.edu
Department of Pediatrics
UChicago
Department of Neurology & The Memory Center
UChicago
Department of Psychiatry
UChicago
Pulmonary Critical Care, Weill Cornell
Department of Anesthesia and Critical Care
UChicago
Center for Health Statistics
UChicago
Pulmonary Critical Care, Harvard Medical School
Department of Psychiatry
UIC
Demon Network, Exeter, Alan Turing Institute, UK
Dalhousie University, Canada
Pritzker School of Molecular ENgineering
Social Science
UChicago
*CoR : * Comorbid Risk Scores
ACoR
PCoR
ZCoR
Universality
Autism
Bipolar Disorder
Idiopathic Pulmonary Fibrosis
Alzheimer's Disease
Perioperative Cardiac Event
Chronic Kidney Disease
...
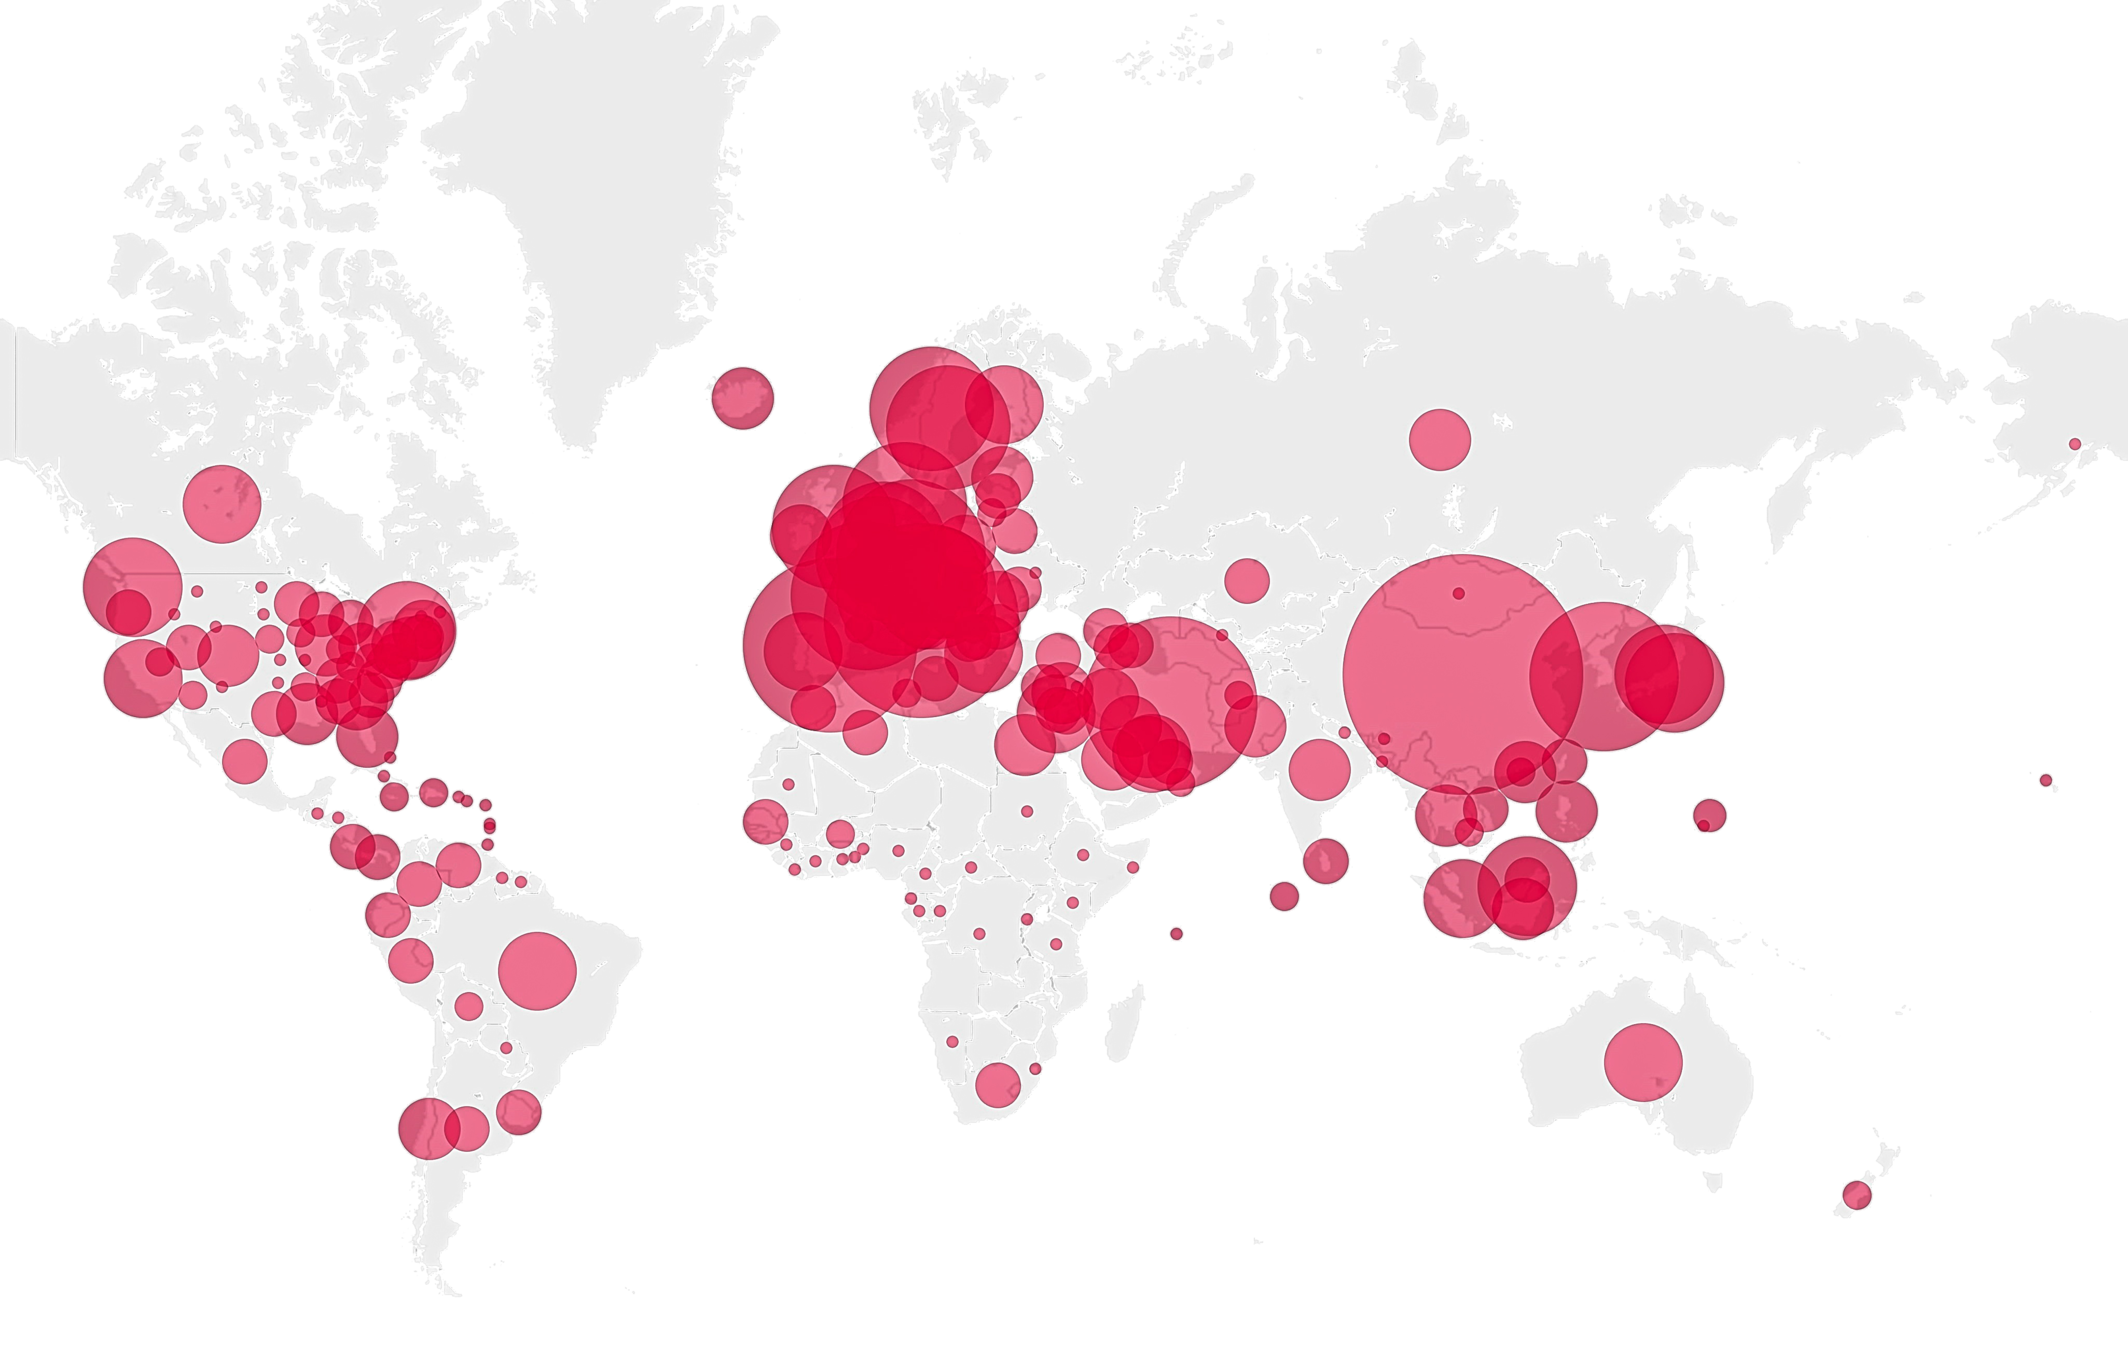
Truven MarketScan (IBM)
Commerical Claims & Encounters Database

2003-2018
87M patients visible > 1 year
>7B individual claims
>87K unique diagnostic codes
>7% Medicare data present
individual data points not so much important
Tabularia in ancient Rome – storehouses of receipts from individual purchases that gave the Romans vision into the state of commerce.
(78 B.C.)
Tyco Brahe
(1546-1601)
Johannes Keplar (1571-1630)
Newtonian theory of Universal Gravitation (1684)
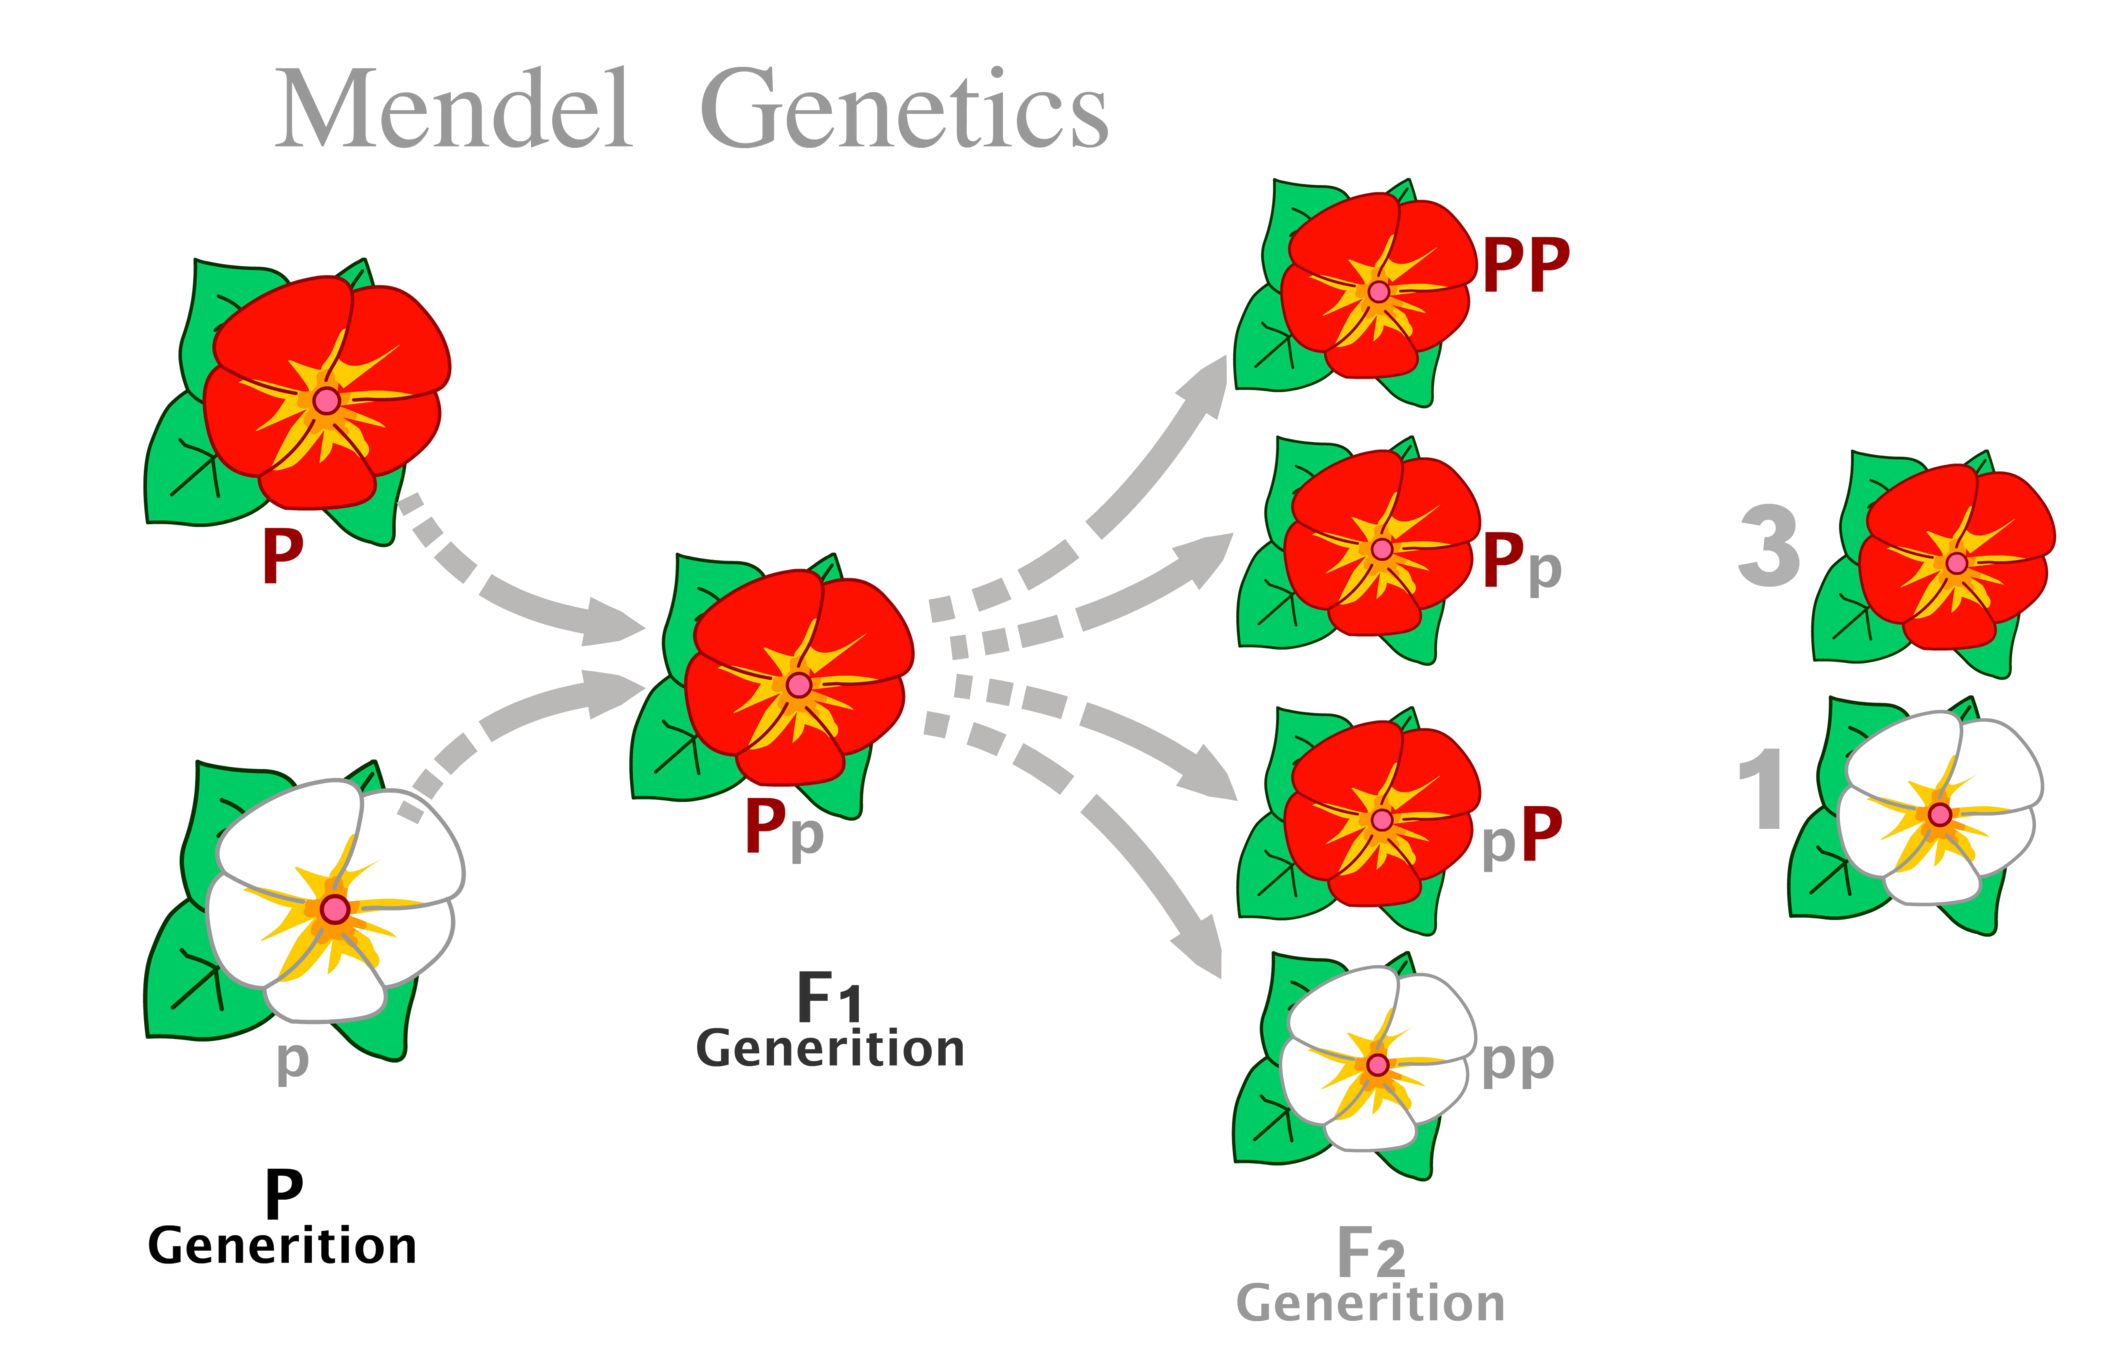
30,000 experiments
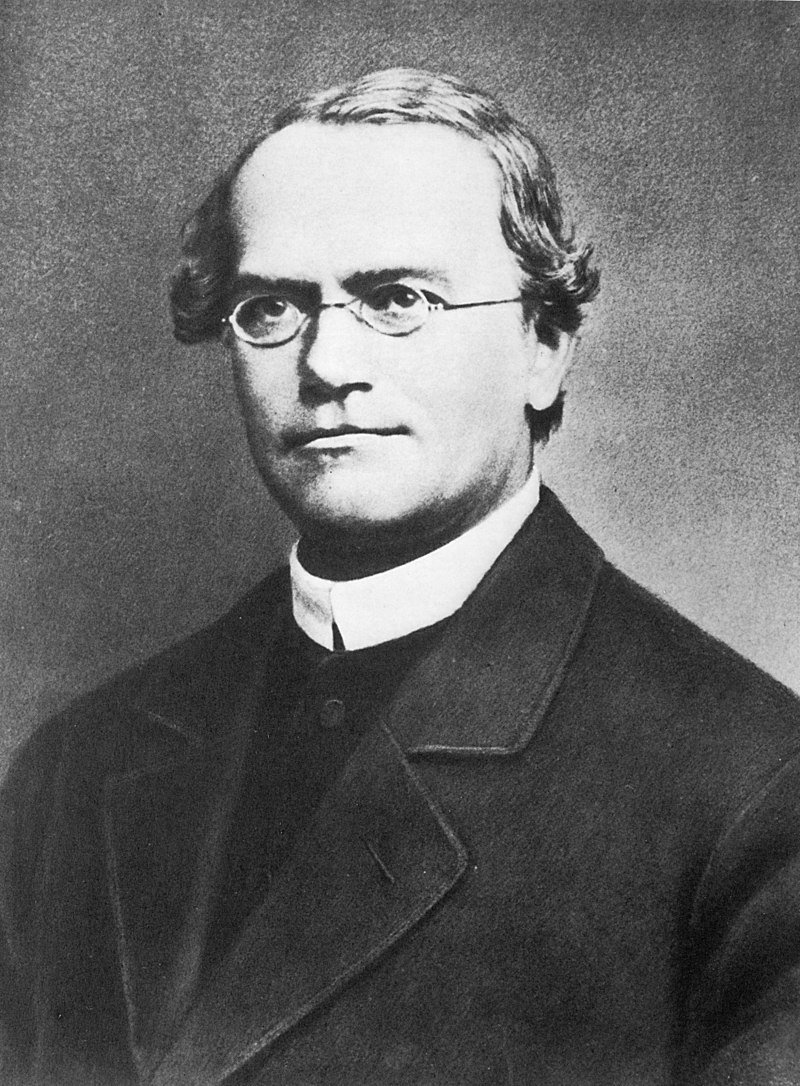
Starting point of modern genetics
Mendel's Laws of Genetics
Johann Gregor Mendel (1822–1884)
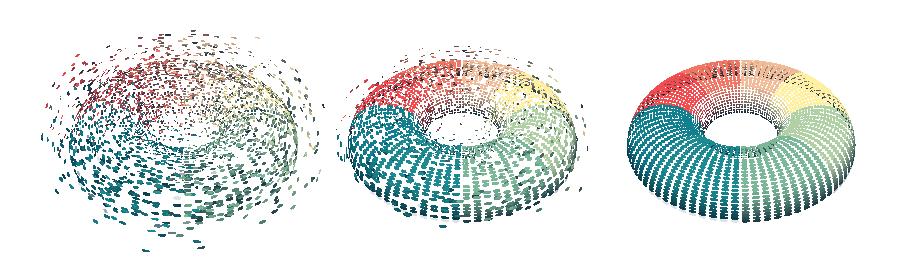
Some datasets are large, but simple: easily compressible or representable
Others, are not.
scientific theory
some black boxes
allowed!
*Almost all questions in biology and social systems
Pandemics
Emergent Pathogens
Social Dynamics
Complex Diseases
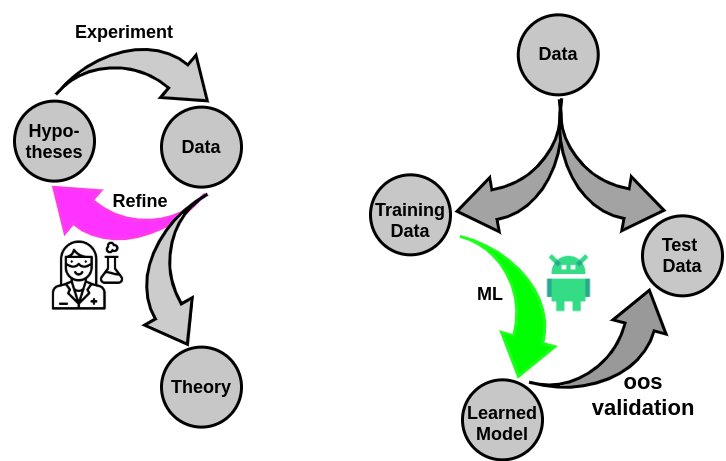
Data
Forecast case count
Predict future mutations
Predict outcomes
Diagnose/screen diseases
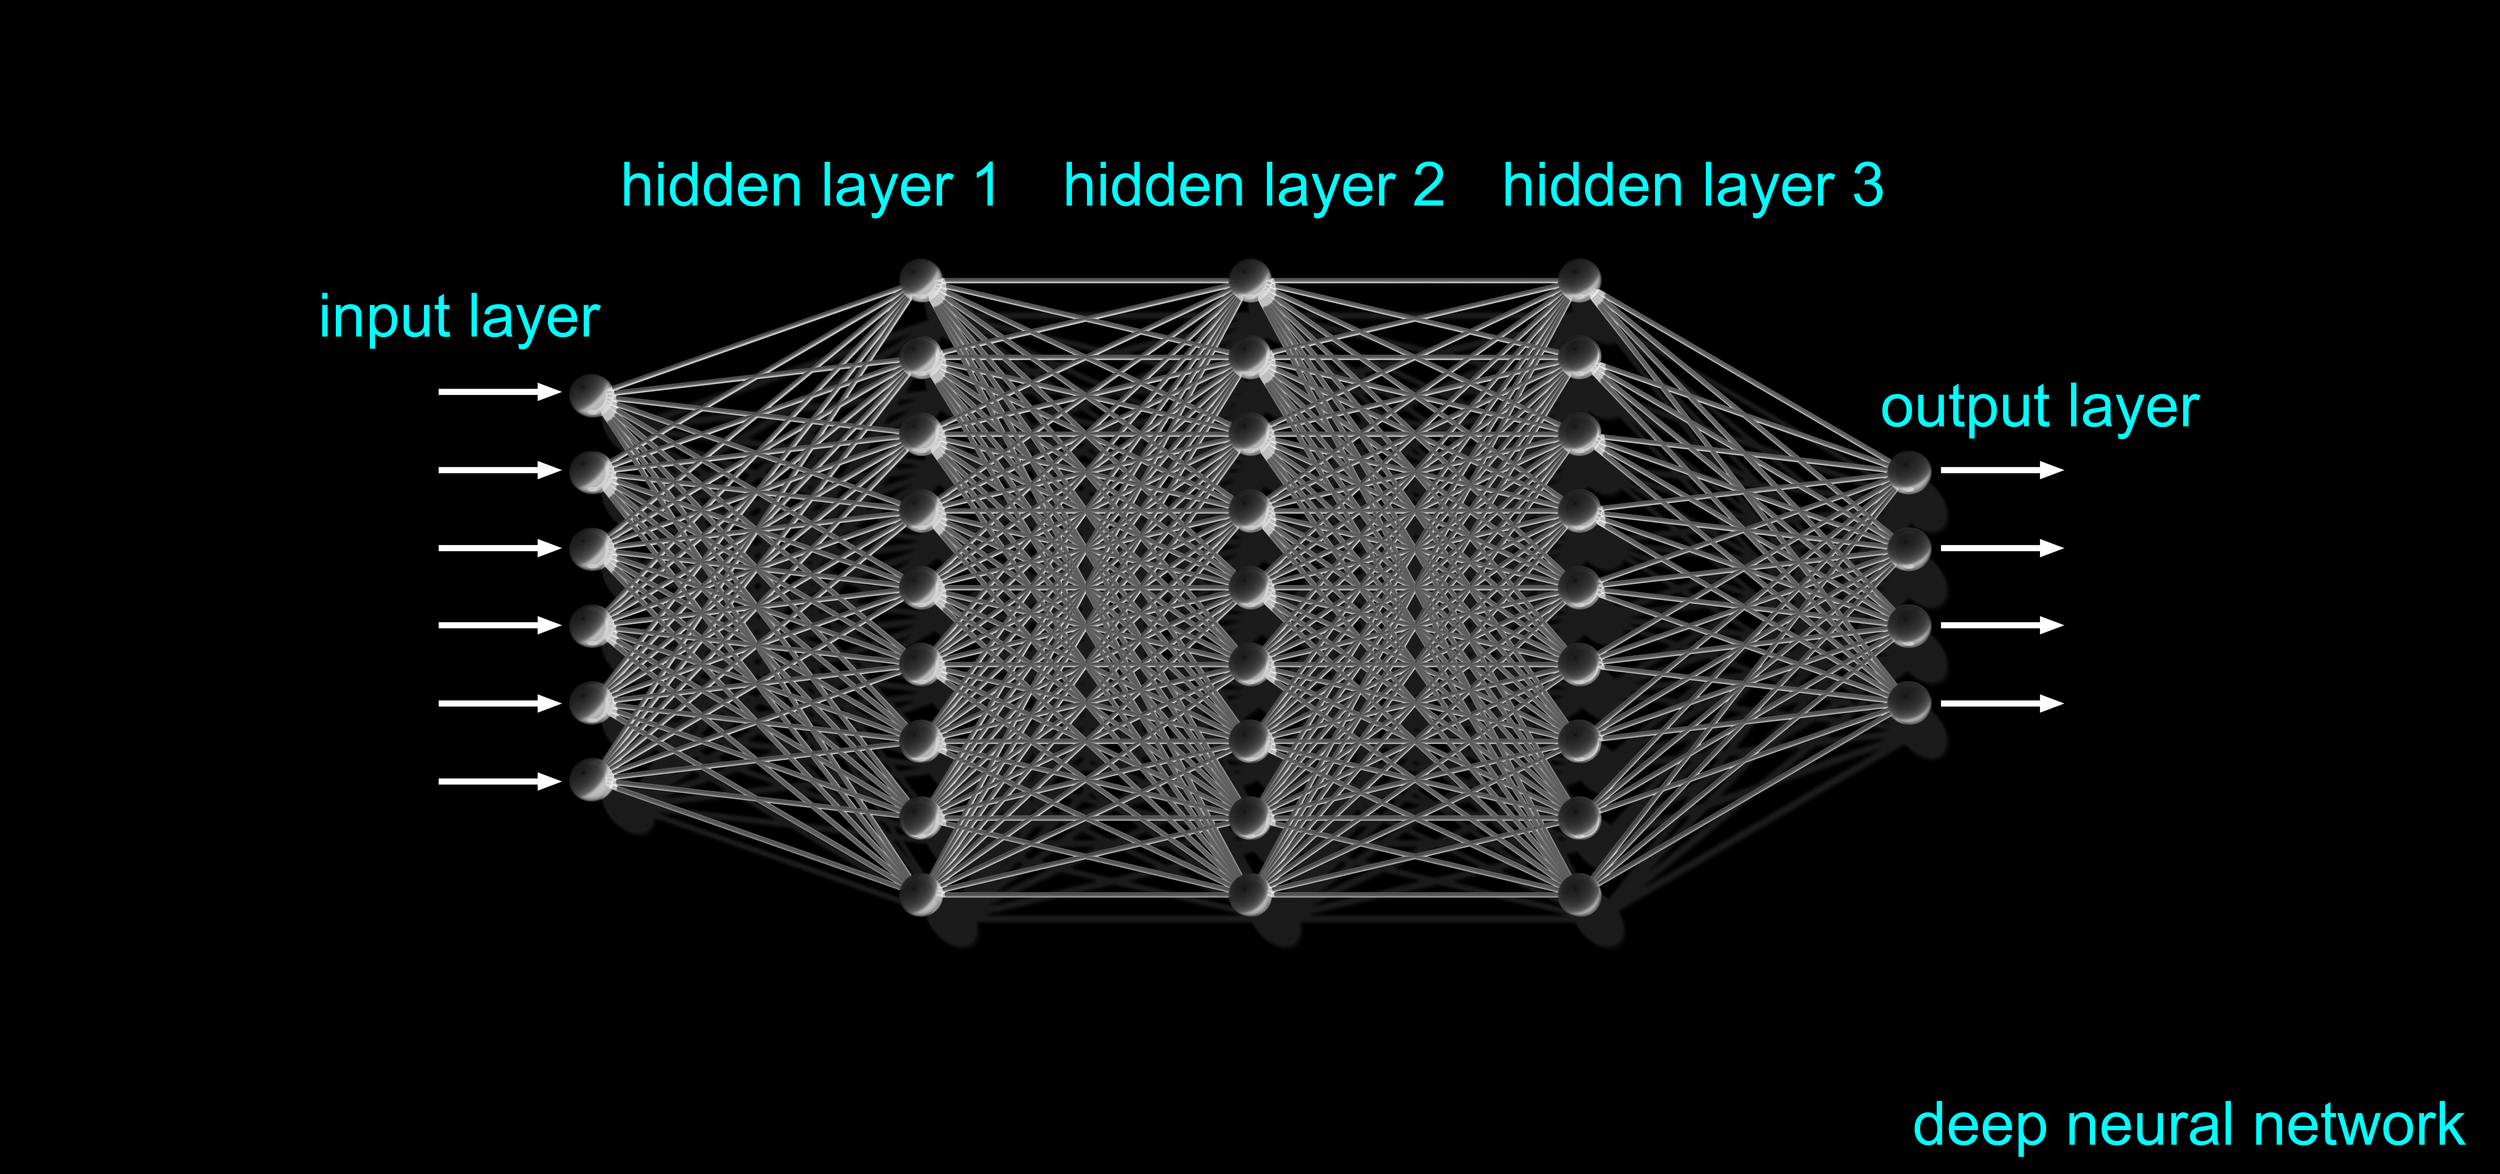
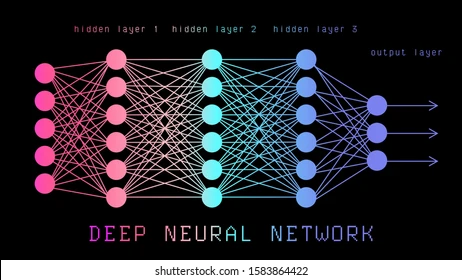
"big data" has irreducible complexity
Hence, "models" must have capacity to accommodate this complexity
& AI
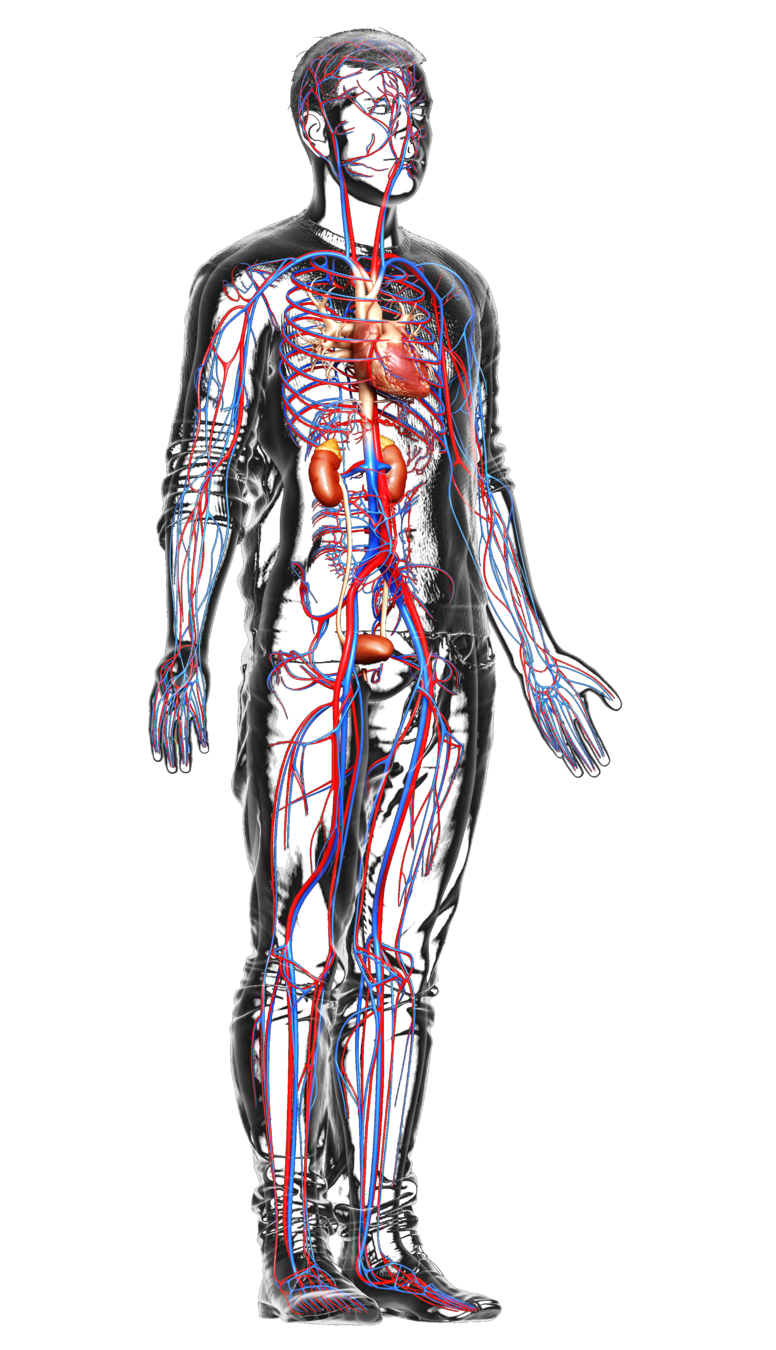
Medical history
co-morbidities
lifestyle
genetics
environment
Estimate disease risk
Estimate prognosis
Reduce missed and delayed diagnosis
Find prodromal patients for clinical trials
The Age of Data
Risk
How is this different from Random Control Trials?
Machine Learning is poised to transform clinical discovery and outcome research
Cohort size & Composition
Scope of discovery
Translation to practice
Less well understood/reliable
smaller cohorts in RCT
narrow scope in RCT
"controlled" experiments
statistical rigor
Autism Spectrum Disorder + AI
Idiopathic Pulmonary Fibrosis + AI
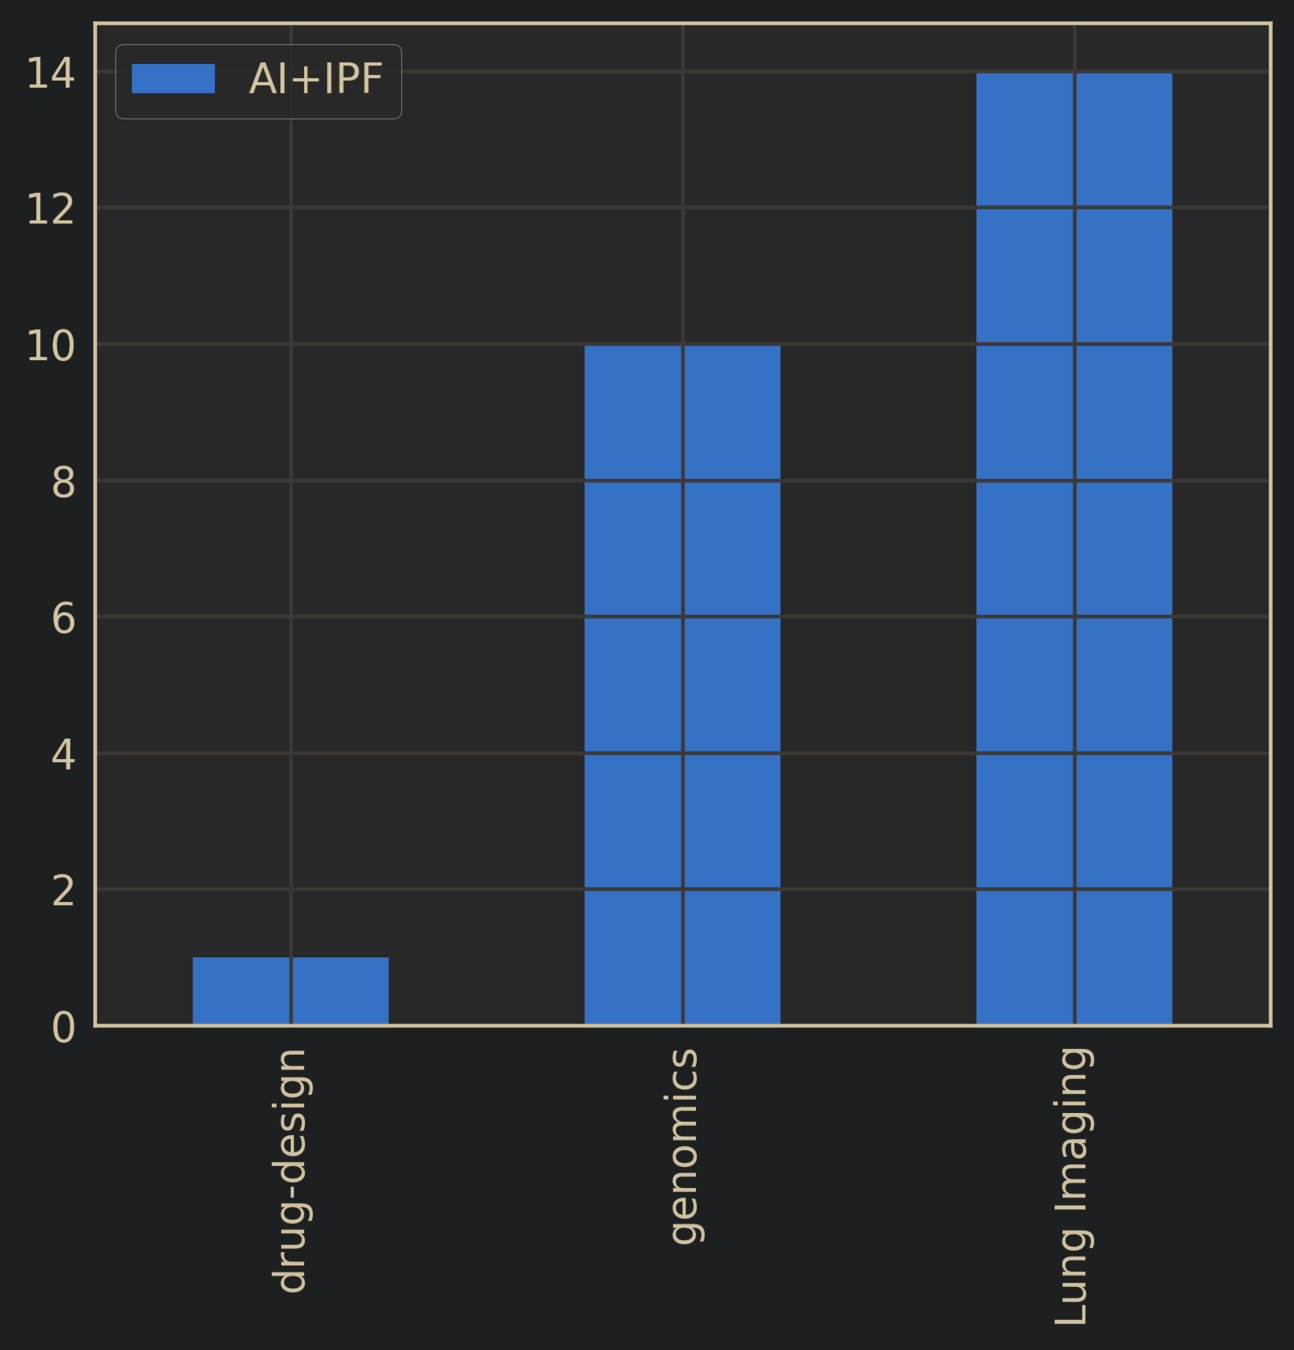
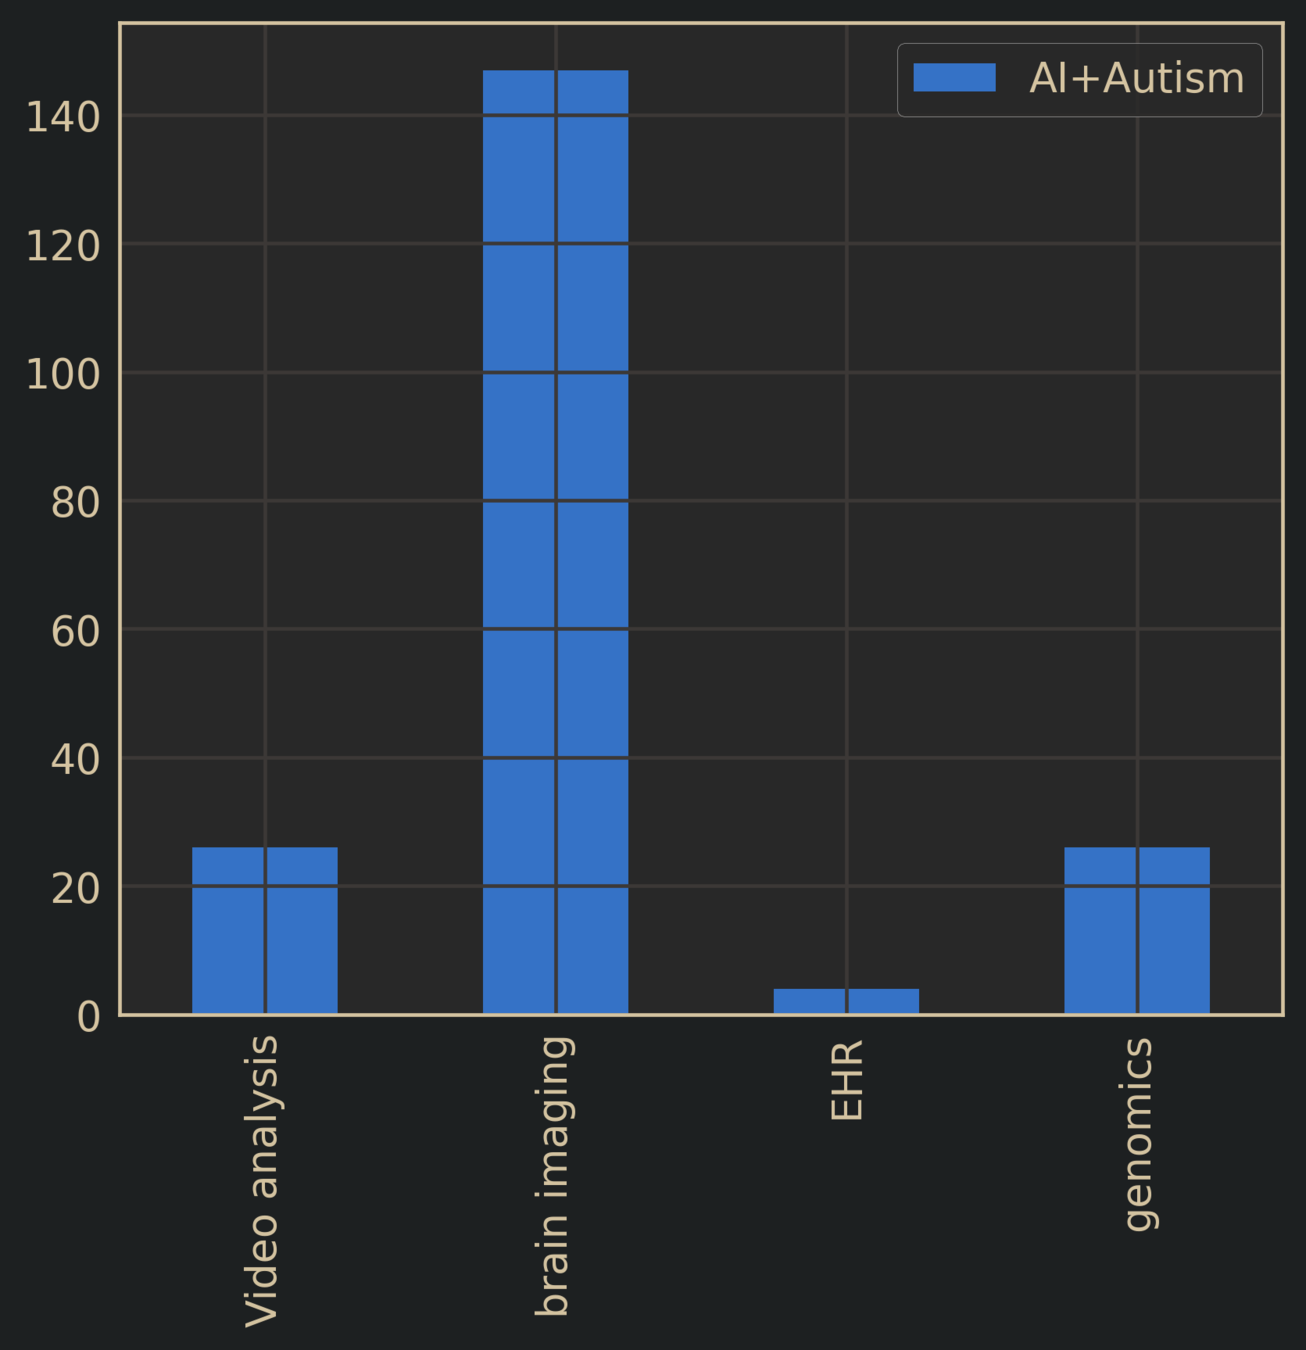
Literature Search: AI + Target Disease
Are ML predictions pertaining to clinical diagnoses adding anything of relevance?
Risk
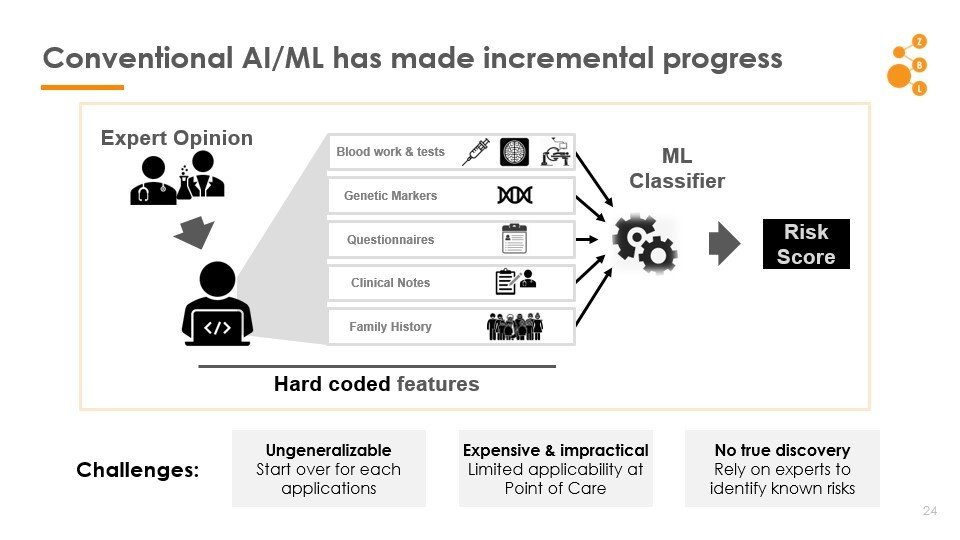
The Key Stumbling Block: Features
How to find good features?
Good features
relevant risk factors
Must do pattern discovery
Discover factors that modulate risk, beyond what is already known
Must account for the possibility of non-causal spurious associations
Lesson
The need for Universal Screening
Takes too long,
not supported by insurance,
"gut feeling" / "wait & see" common
IPF diagnosed from lung imaging using CNN
Alzheimer's diagnosed from brain scan
Autism diagnosed by "AI" after 3 years
Good for writing papers, not clinically useful
1 in 59
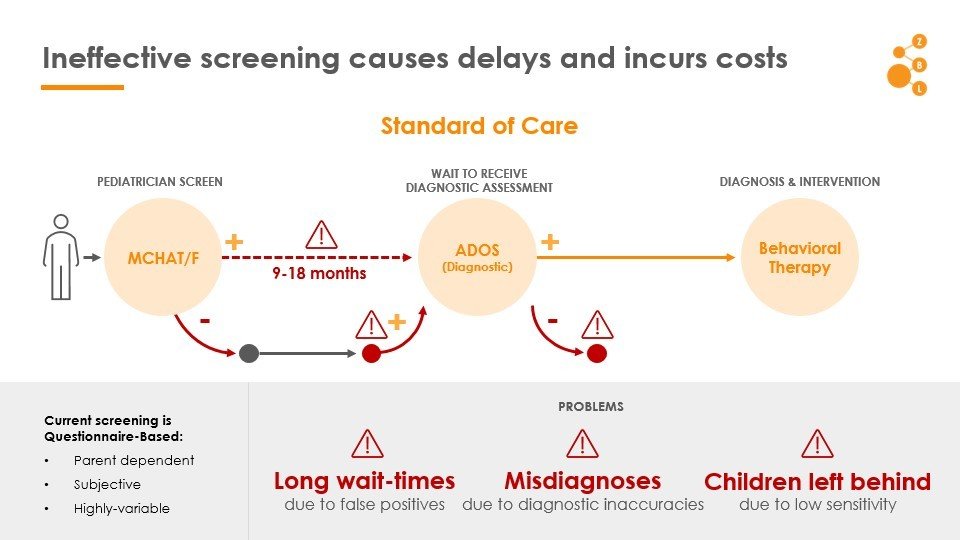
ASD: Ineffective screening causes delays and incurs costs
Autistic children experience higher co-morbidities
Can we exploit these patterns to predict diagnosis?
Common Knowledge: Comorbidties Exist
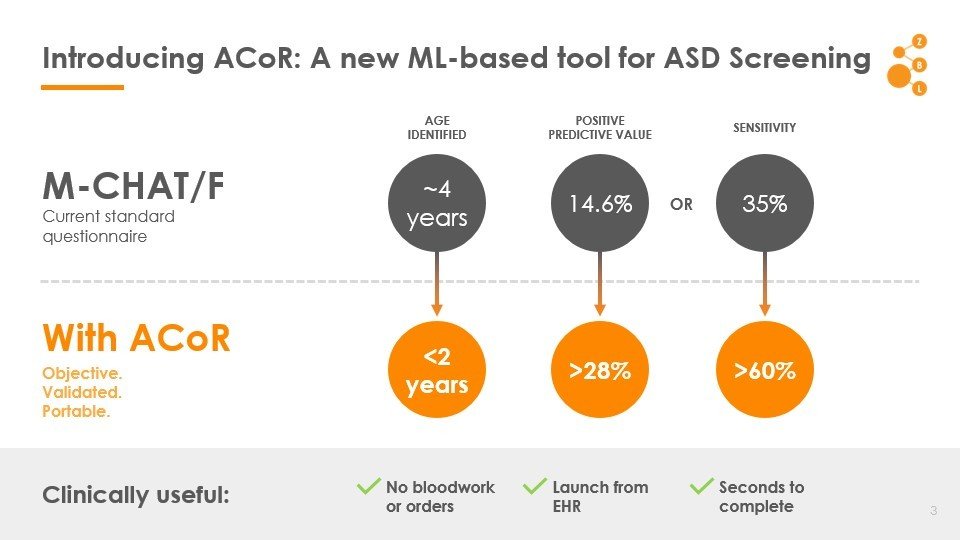
Autism Co-morbid Risk (ACoR) Score
Autism Co-morbid Risk (ACoR) Score
MCHAT/F
Head to head comparison with current practice
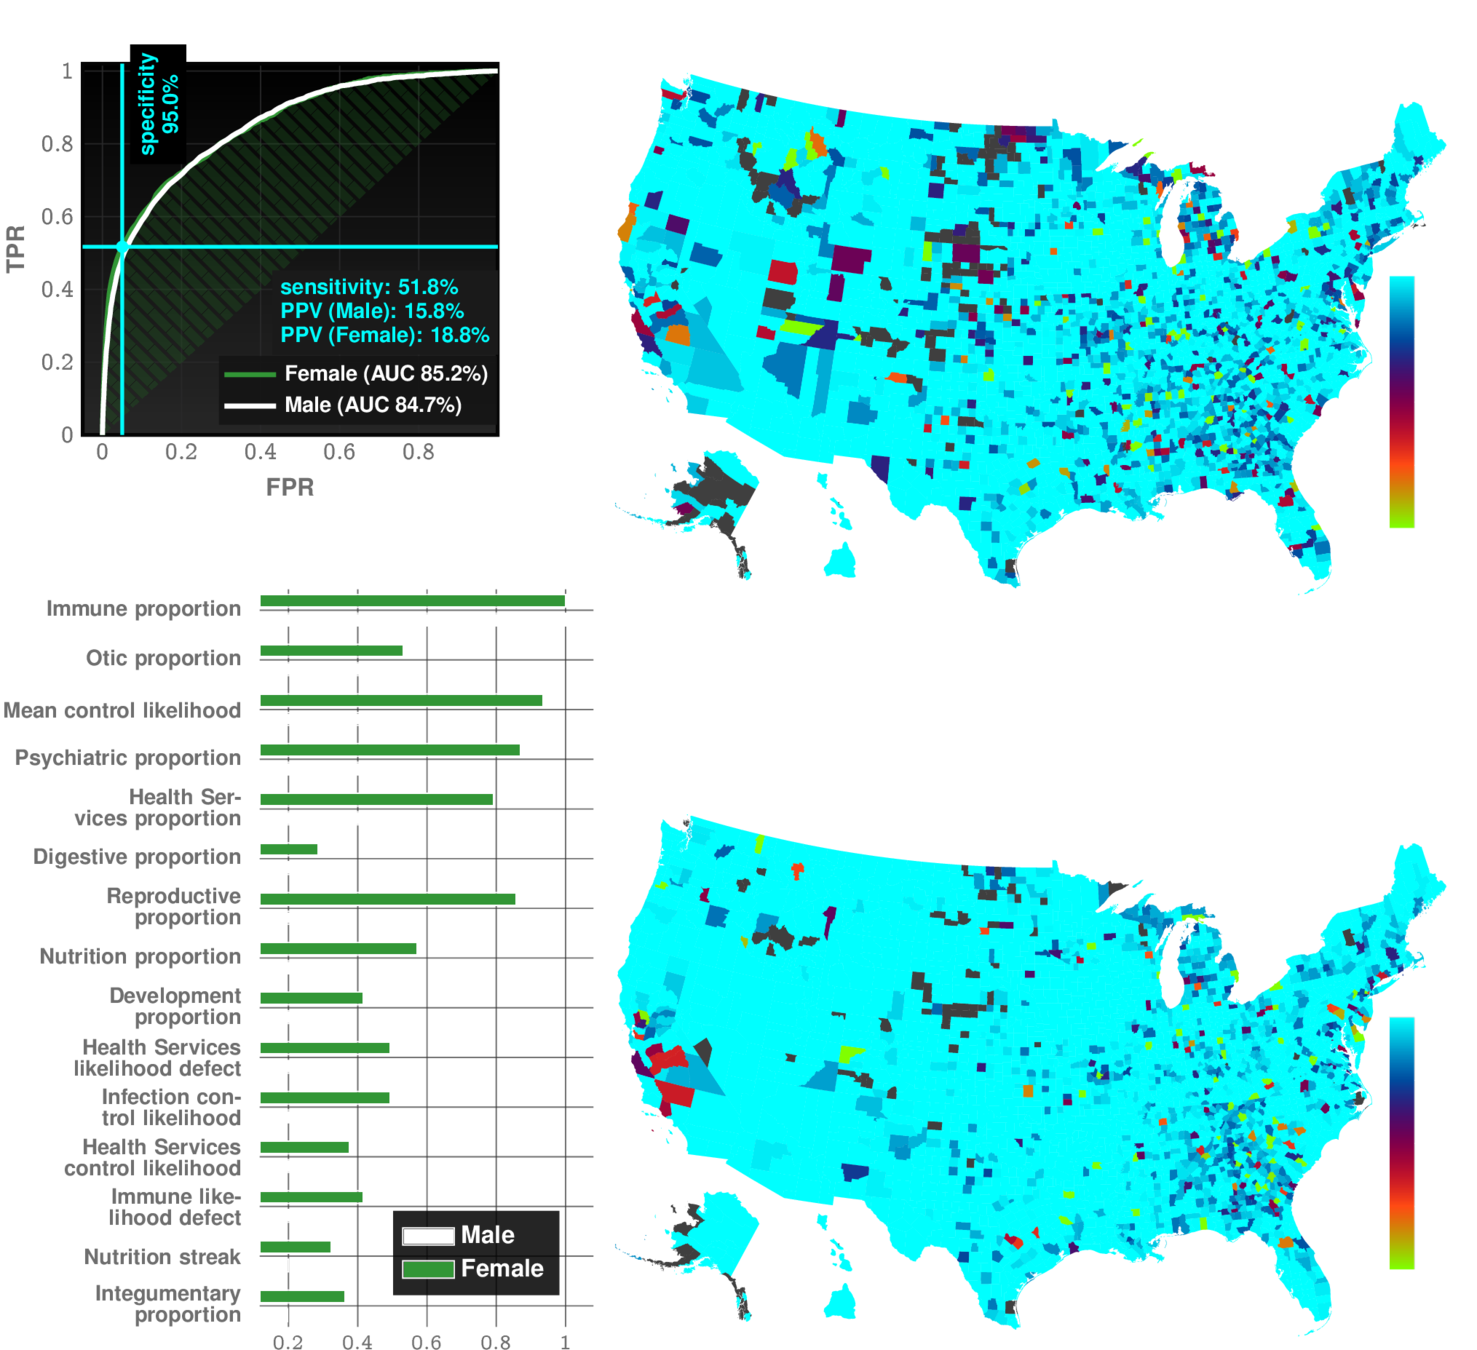
Autism Co-morbid Risk (ACoR) Score
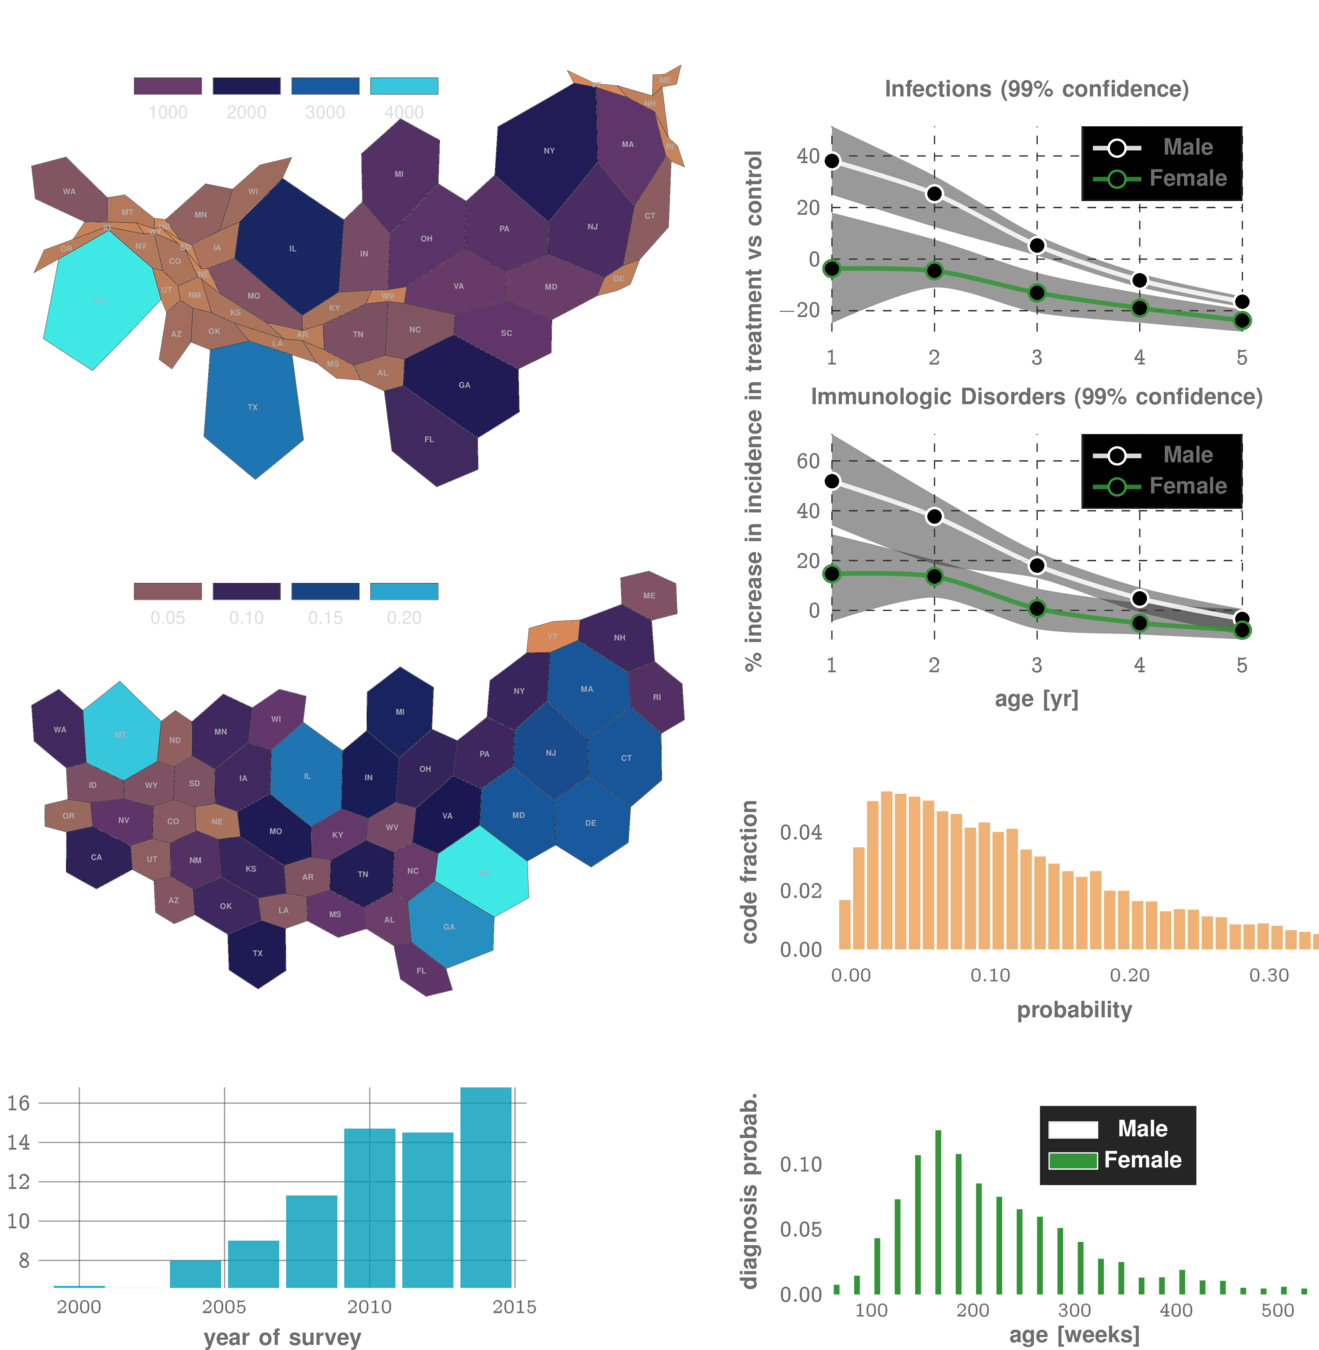
Importance of different comorbidity categories
Feature types:
17 categories chosen:
immune | infections | endocrine | ...
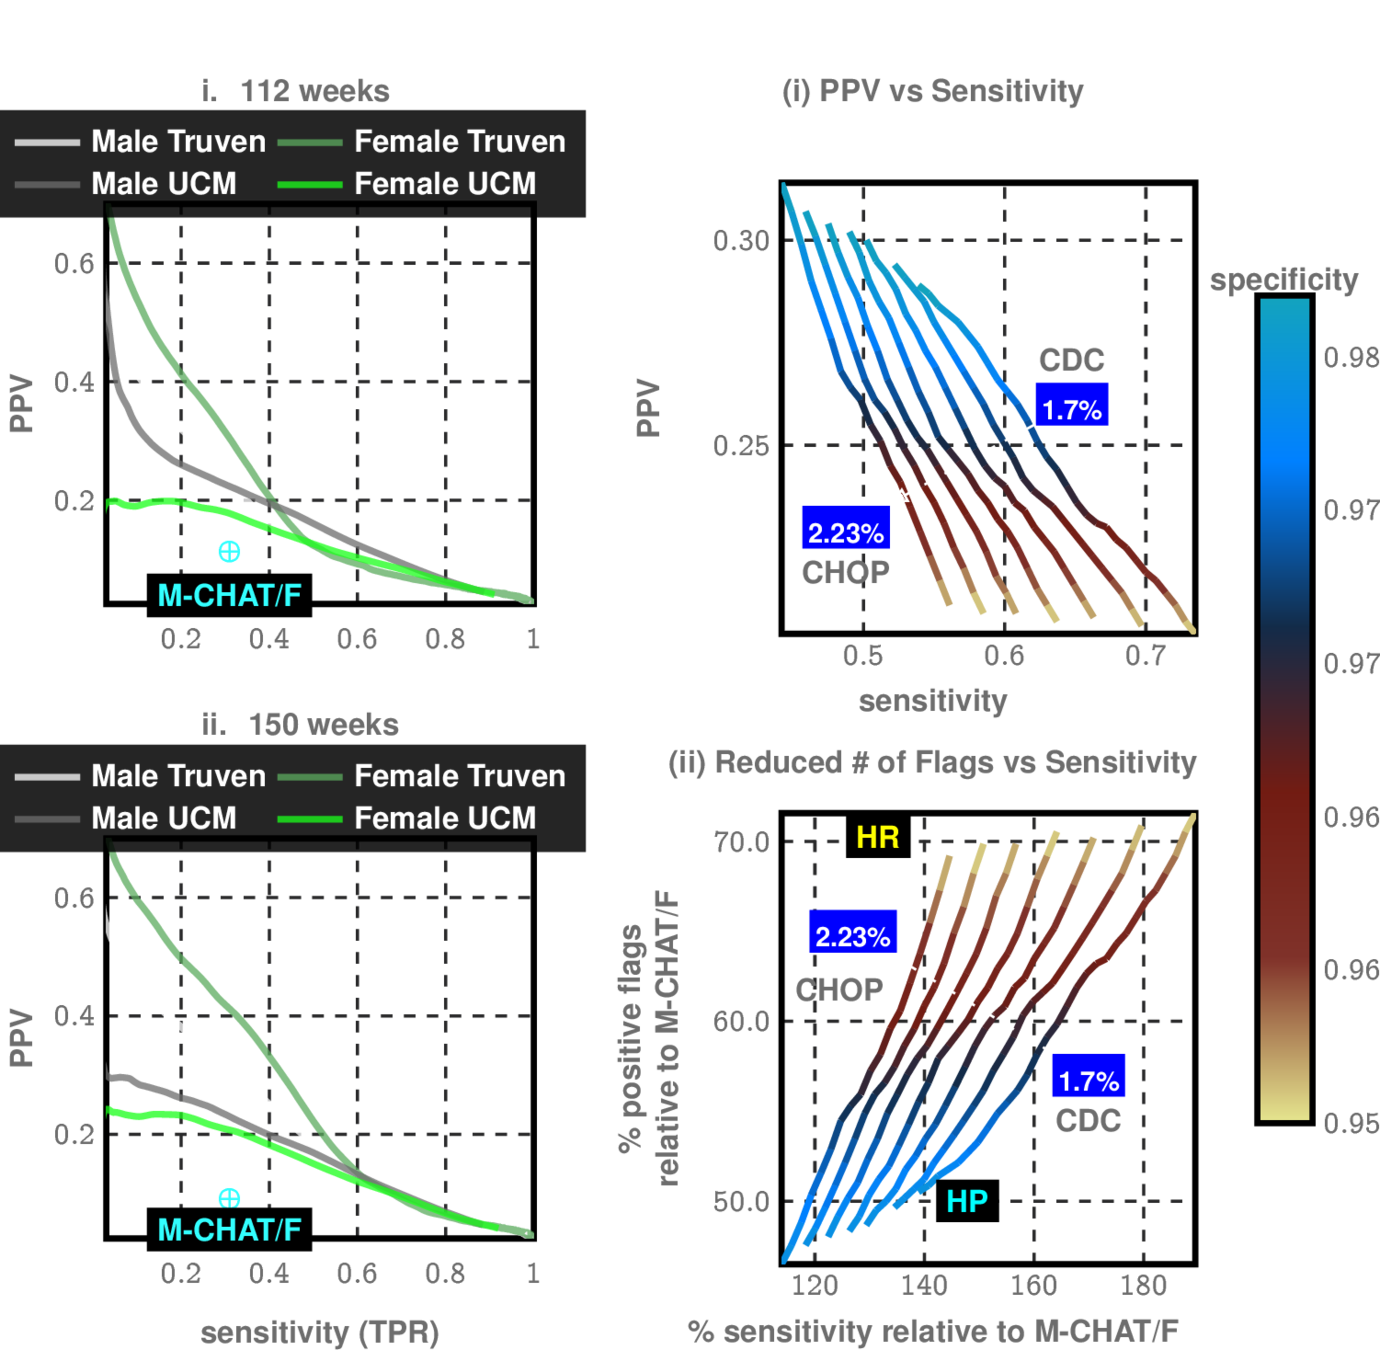
Joint Operation with MCHAT
CHOP Study allows us to see effectiveness of MCHAT in different sub-populations
Modulate sensitivity/specificity trade-offs
Ishanu Chattopadhyay
Assistant Professor of Medicine
UChicago
Dmytro Onishchenko
UChicago
Rapid Universal Point-of-care Screening for ILD/IPF Using Comorbidity Signatures in Electronic Health Records
University of Chicago Medicine
NHLBI IPF Stakeholder Summit
Nov 2022
Fernando Martinez, Weill Cornell
Gary Hunninghake
Harvard Med School
Andrew Limper Mayo Clinic
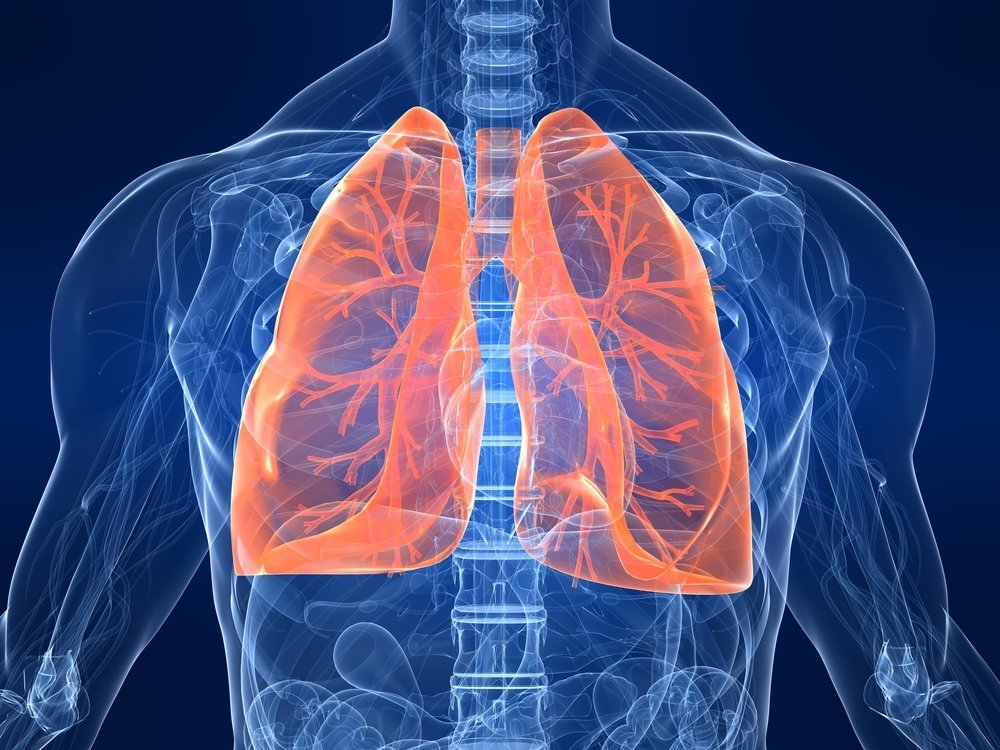
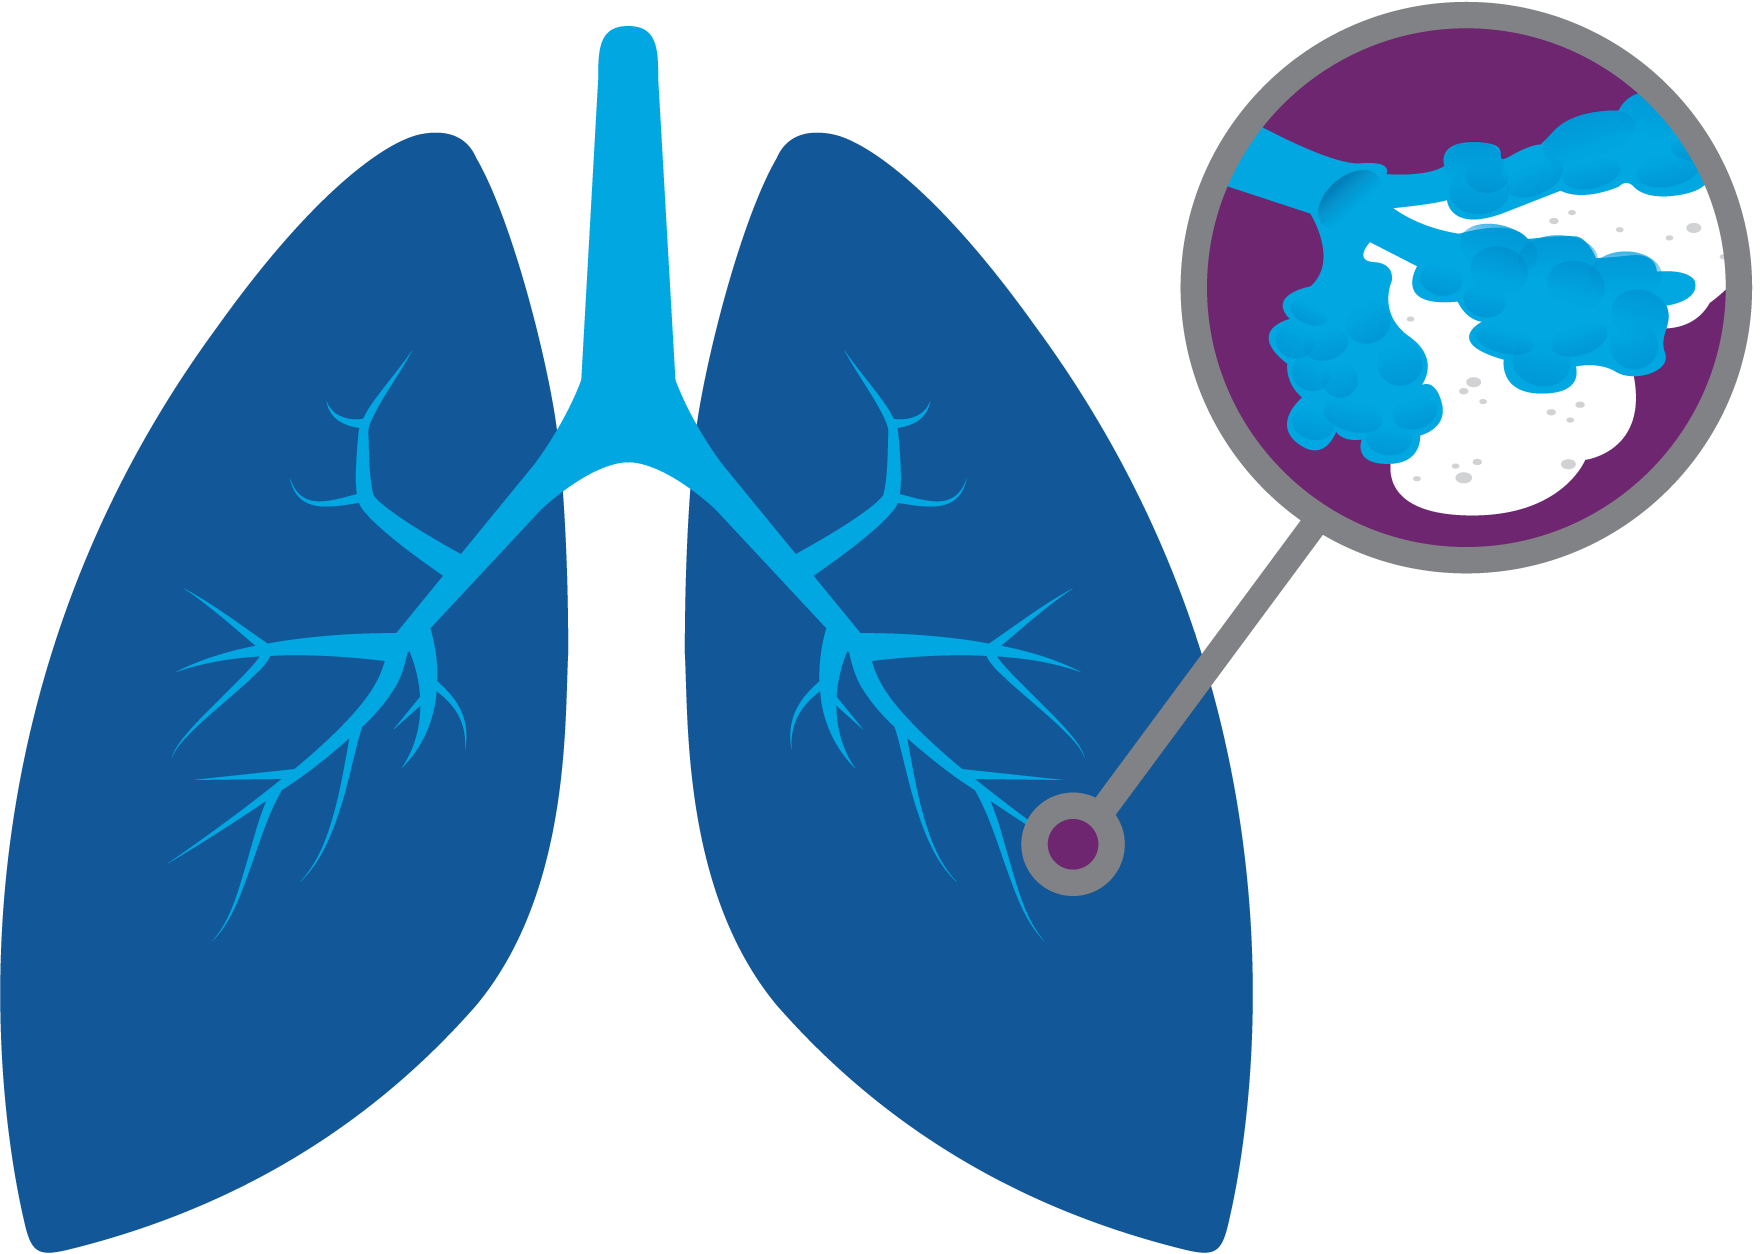
shortness of breath
dry cough
doctor can hear velcro crackles
Common Symptoms
>50 years old
more men than women
IPF
Rare disease
~5 in 10,000
Post-Dx
Survival
~4 years
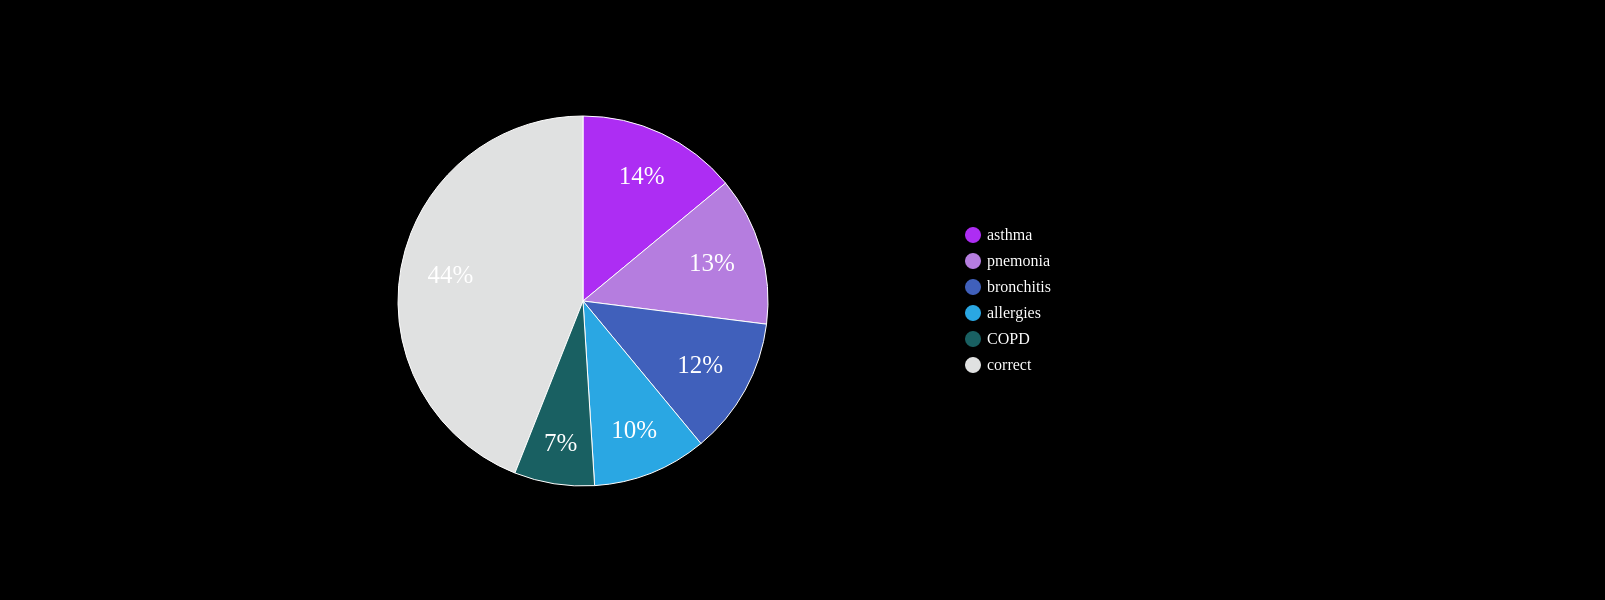
At least one misdiagnosis
~55%
Two or more misdiagnosis
38%
Initially attributed to age related symptoms:
72%
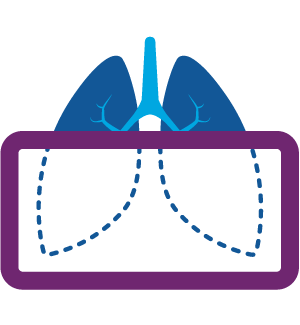
Cannot always be seen on CXR
Non-specific symptoms
PCP workflow demands
~ 4yrs
current survival ~4yrs
~ 4yrs
current clinical DX
ZCoR screening
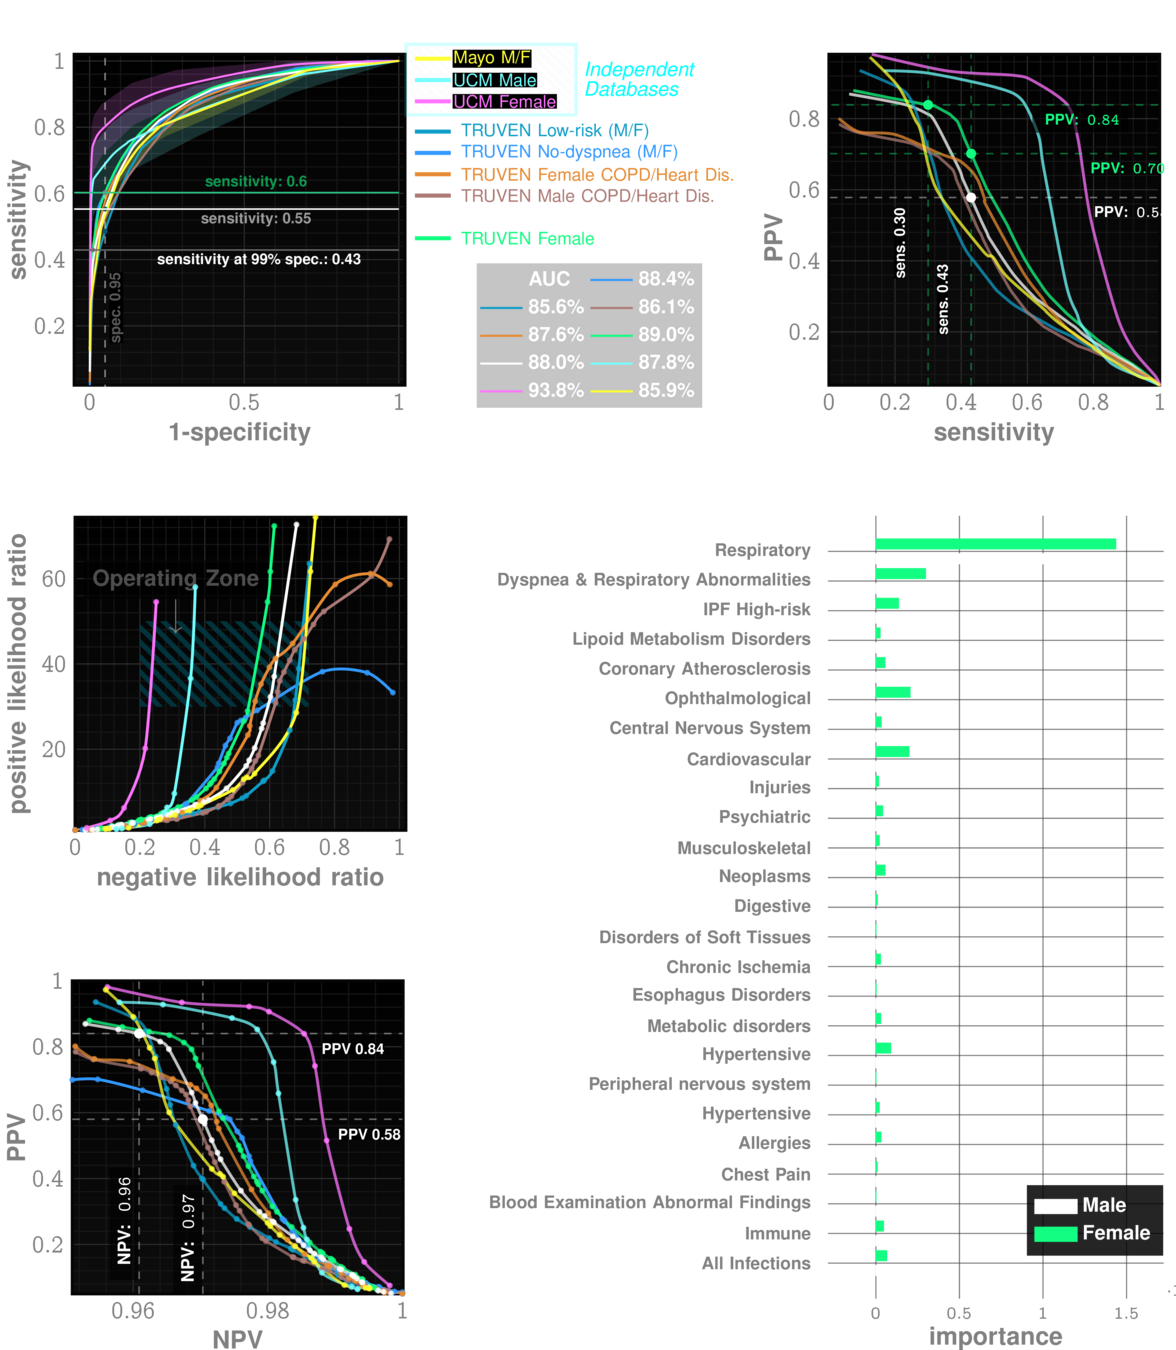
Onishchenko, D., Marlowe, R.J., Ngufor, C.G. et al. Screening for idiopathic pulmonary fibrosis using comorbidity signatures in electronic health records. Nat Med 28, 2107–2116 (2022). https://doi.org/10.1038/s41591-022-02010-y
n=~3M
AUC~90%
Likelihood ratio ~30
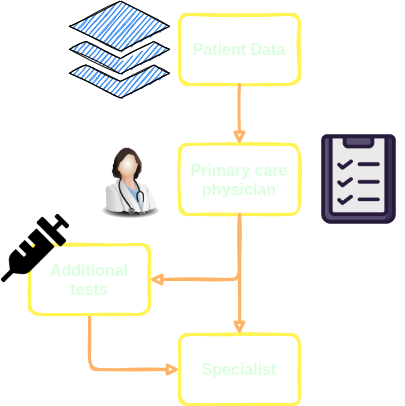
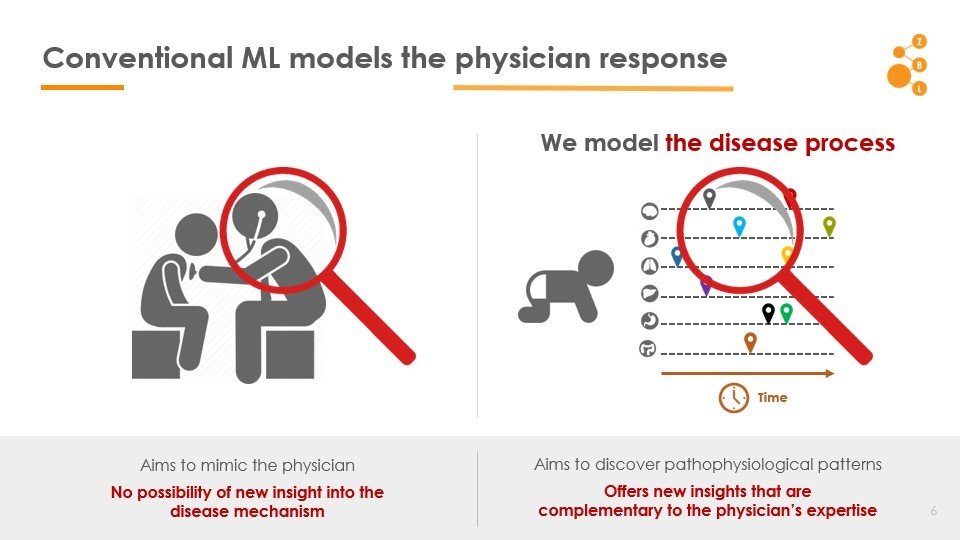
Conventional AI/ML attempts to model the physician
AI in IPF Research
Primary Care
Pulmonologist
ZCoR Flag
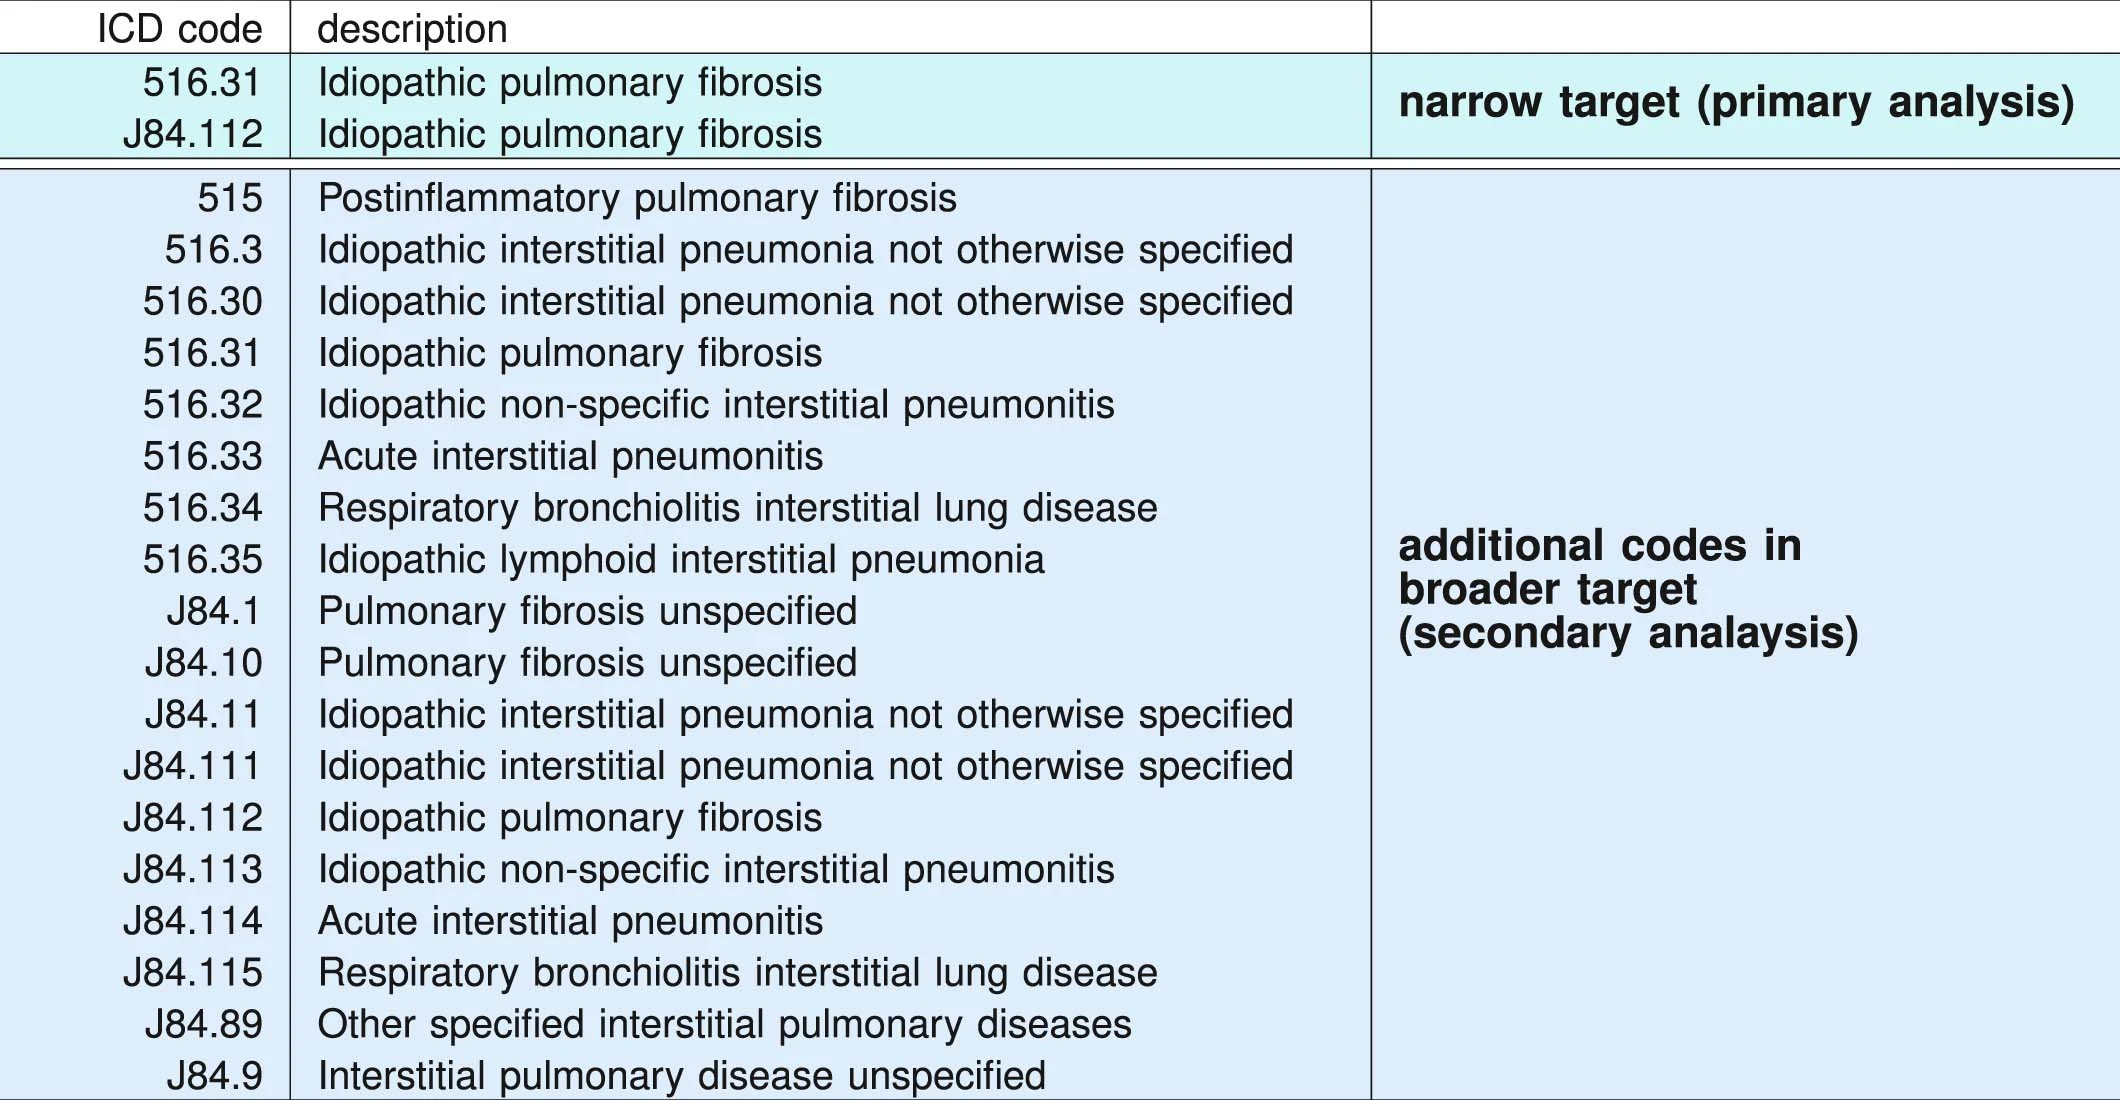
ICD administrative codes
IPF
ILD
target codes appear
Past medical history
No target codes appear
case
control
2yrs
2yrs
target codes appear
Past medical history
No target codes appear
case
control
2yrs
2yrs
IPF drugs prescribed
Signature of IPF diagnostic sequence
pirfenidone or nintedanib
Truven MarketScan (IBM)
Commerical Claims & Encounters Database
2003-2018
>100M patients visible
>7B individual claims
>87K unique diagnostic codes
>7% Medicare data present
2,053,277 patients included in study
Univesity of Chicago Medicam Center
2012-2021
68,658 patients
Random sample from Optumlabs Data Warehouse courtsey Mayo Clinic
861,280 patients
2,983,215 patients
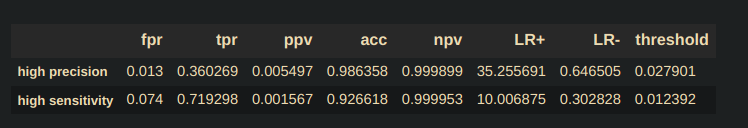
performance tables
Marketscan Out-of-sample Results
specificty~99%
NPV>99.9%
IPF
ILD
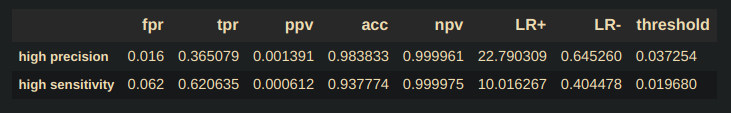
performance tables
UCM Out-of-sample Results
specificty~99%
NPV>99.9%
IPF
ILD
False Positives:
Ethics:
For every 20-30 flags,
1 is positive
minimal
acceptable?
Better outcomes
Collard, Harold R., Alex J. Ward, Stephan Lanes, D. Cortney Hayflinger, Daniel M. Rosenberg, and Elke Hunsche. "Burden of illness in idiopathic pulmonary fibrosis." Journal of medical economics 15, no. 5 (2012): 829-835.
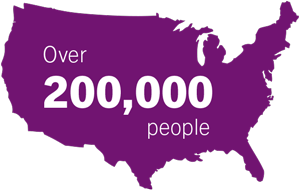
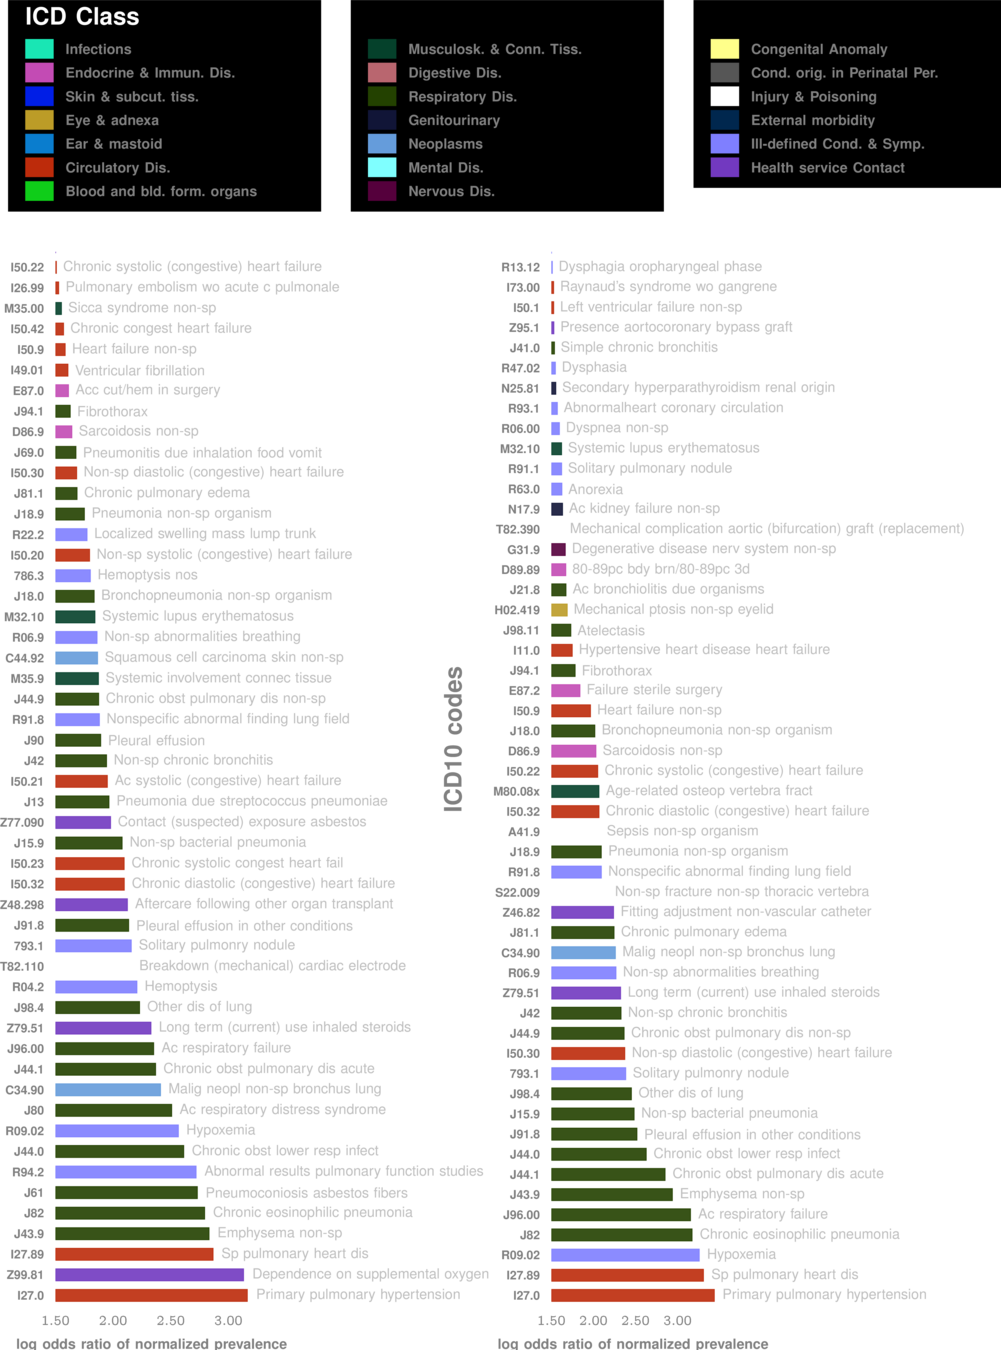
Alzheimer's Disease and Related Dementia
>5 Million in US. >13 Million in next 10 years
Alzheimer's Disease and Related Dimentia
MOCA, Blood Tests
Current Practice:
state of art with EHR:
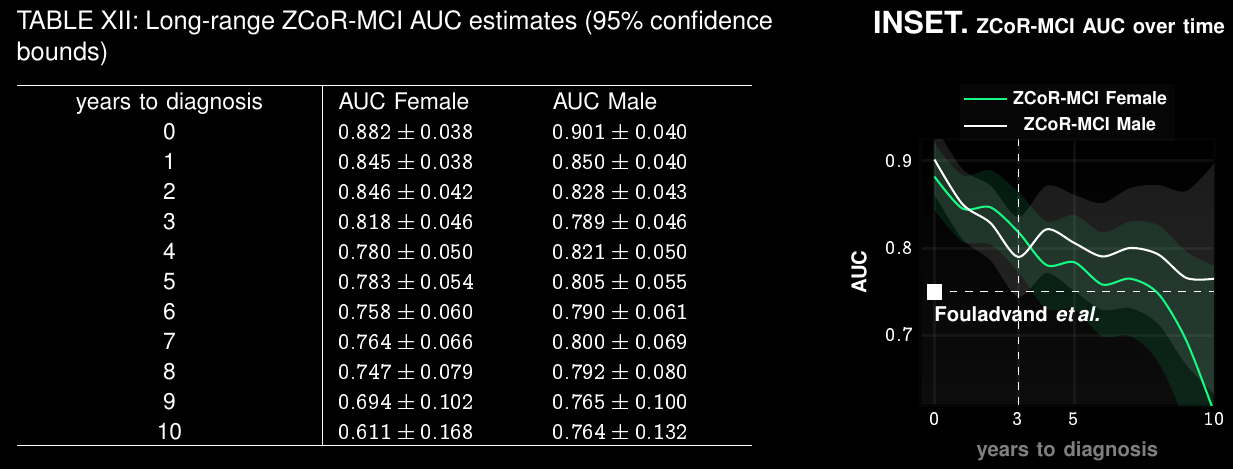
~67% AUC*
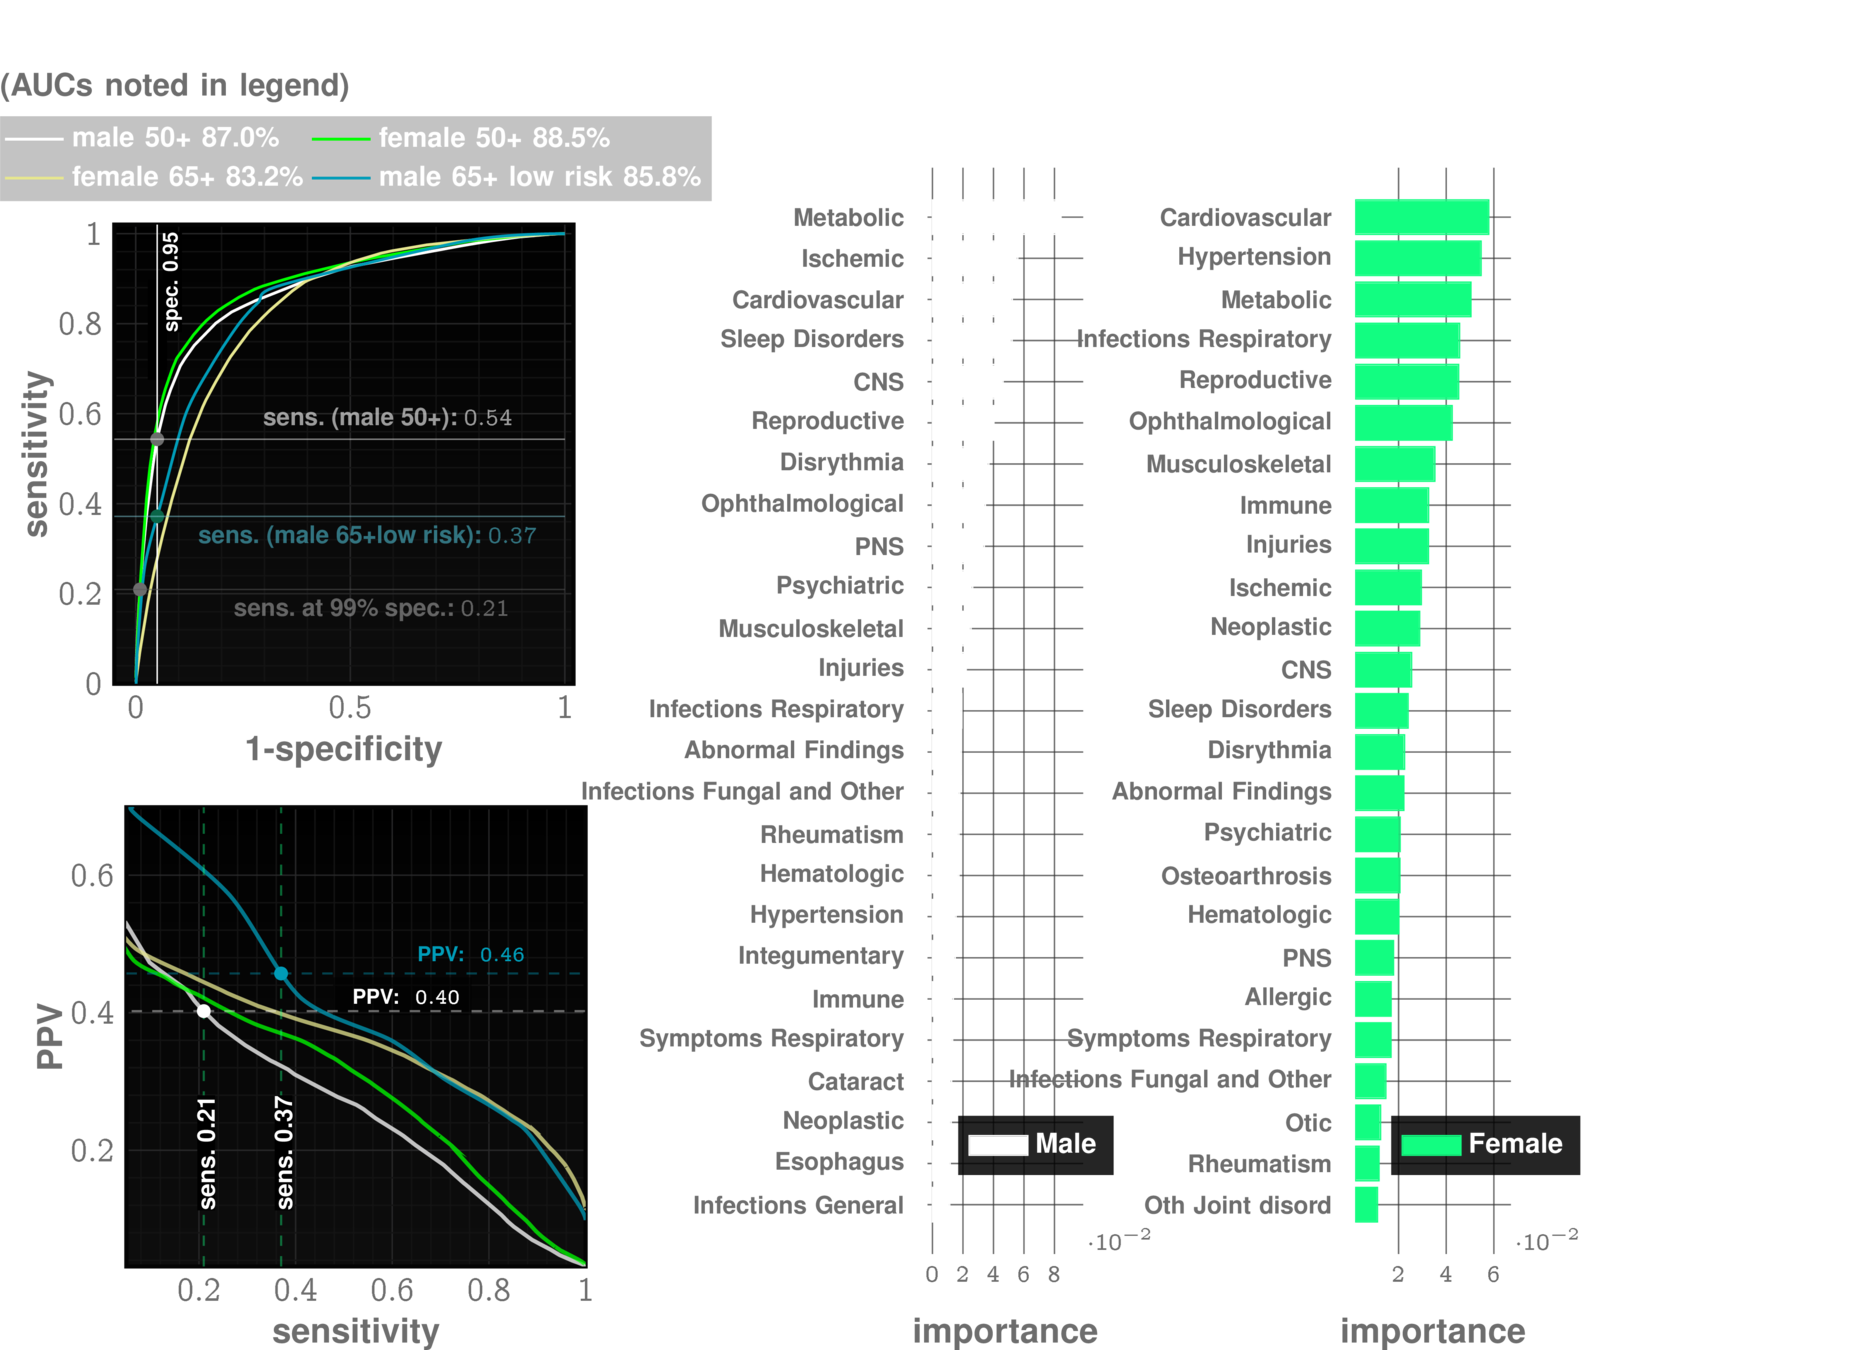
ZCoR: ~87%
Alzheimer's Disease and Related Dimentia
state of art with EHR:
~67% AUC*
ZCoR: ~87%
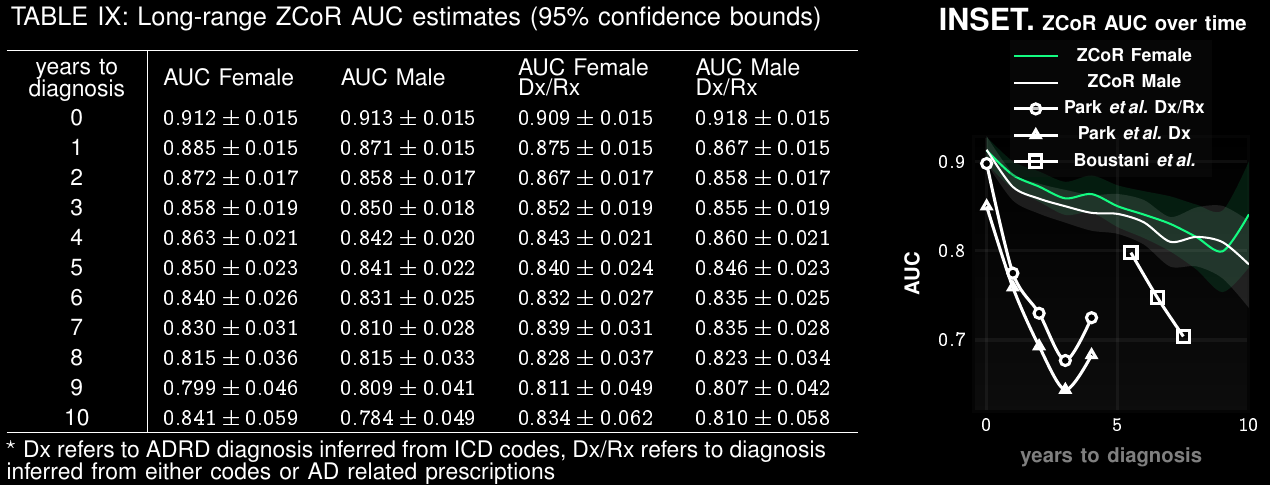
Preempting ADRD accurately upto a decade in future
Applicable To Screening for Mild Cognitive Impairment
Clinical Trial Participant Selection
Current screen-failure rate: 80-90%
Estimated rate with ZCoR:
40%
Deep Learning Without Neural Networks: Fractal-nets for Rare Event Modeling (Under Review Nature Machine Intelligence)
Yi Huang, James Evans, I. Chattopadhyay
Sequence Likelihood Divergence For Fast Time Series Comparison
Yi Huang, Victor Rotaru, I. Chattopadhyay
Under Review IEEE Transactions of Data and Knowledge Engineering
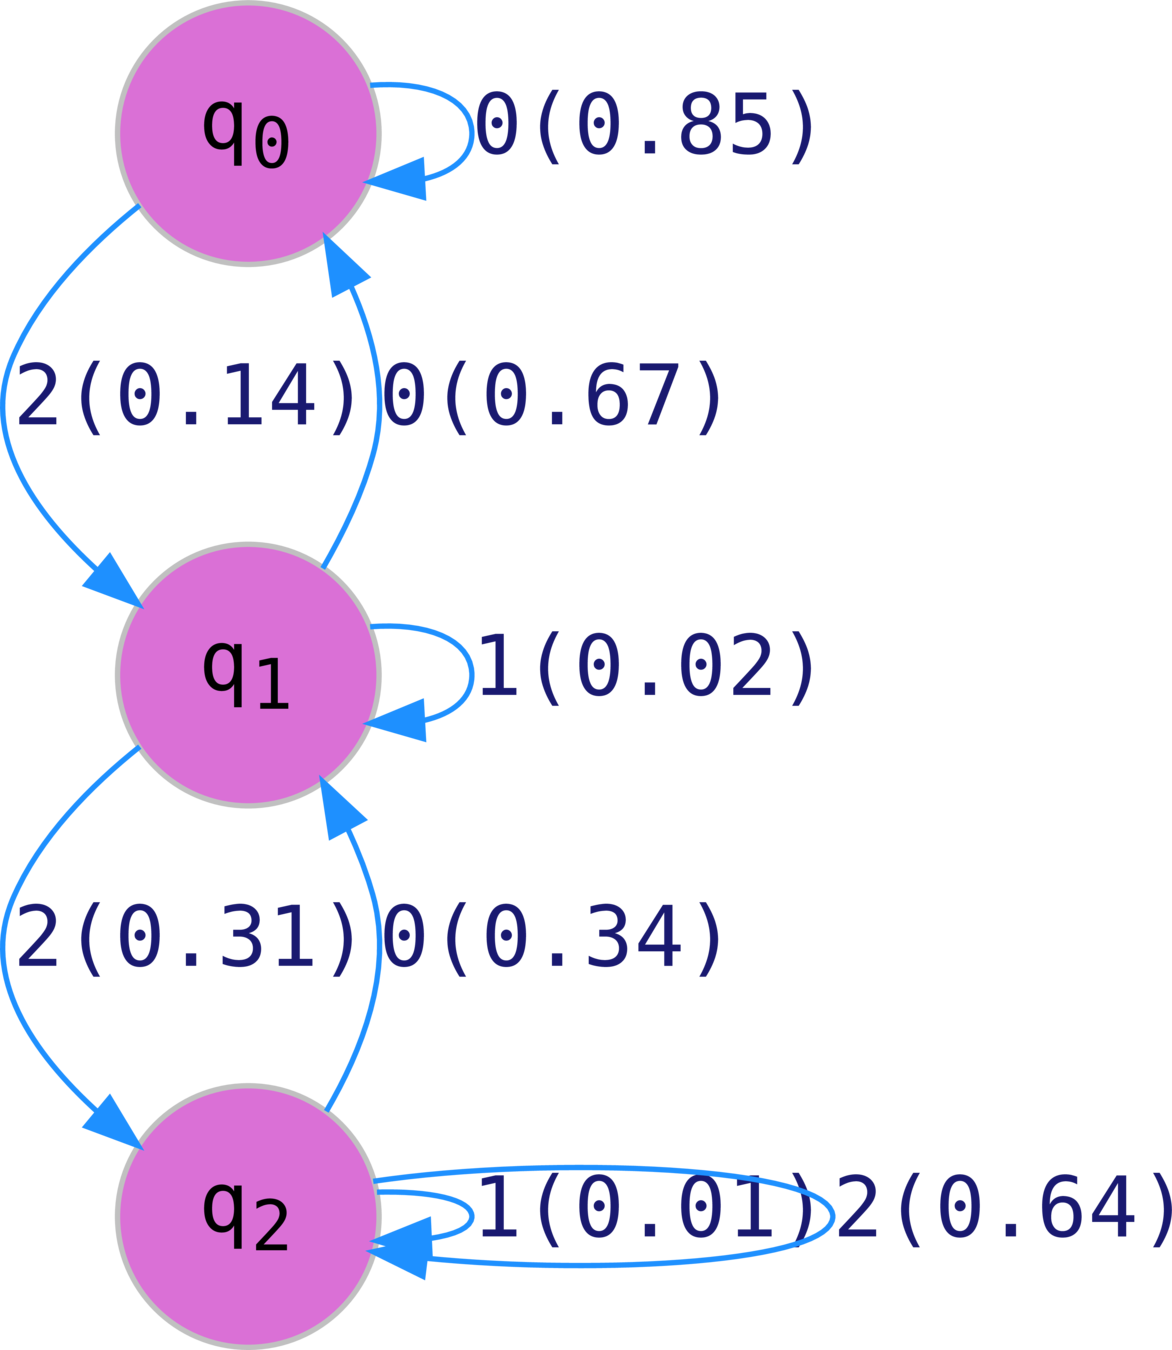
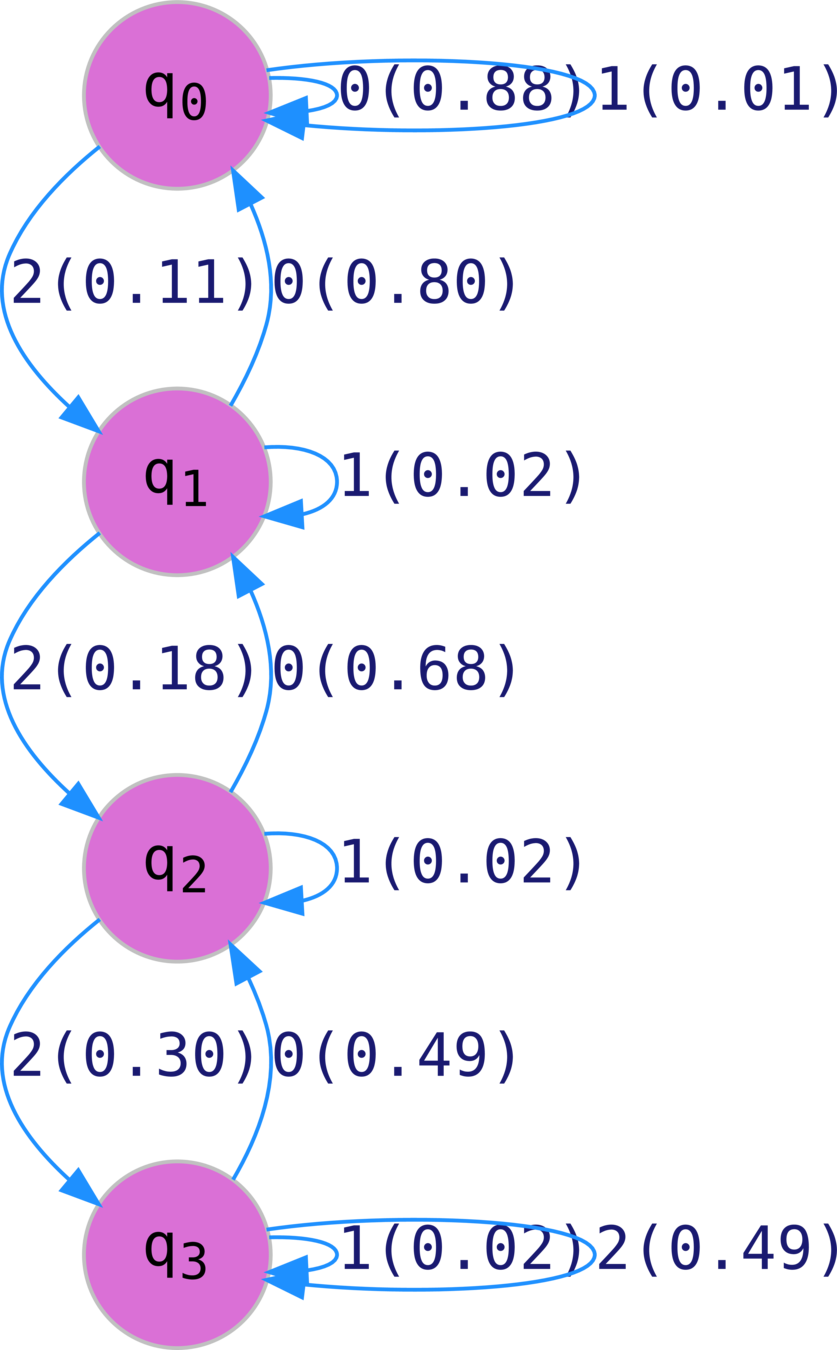
Abductive learning of quantized stochastic processes with probabilistic finite automata
Ishanu Chattopadhyay and Hod Lipson
2013 Phil. Trans. R. Soc. A.3712011054320110543
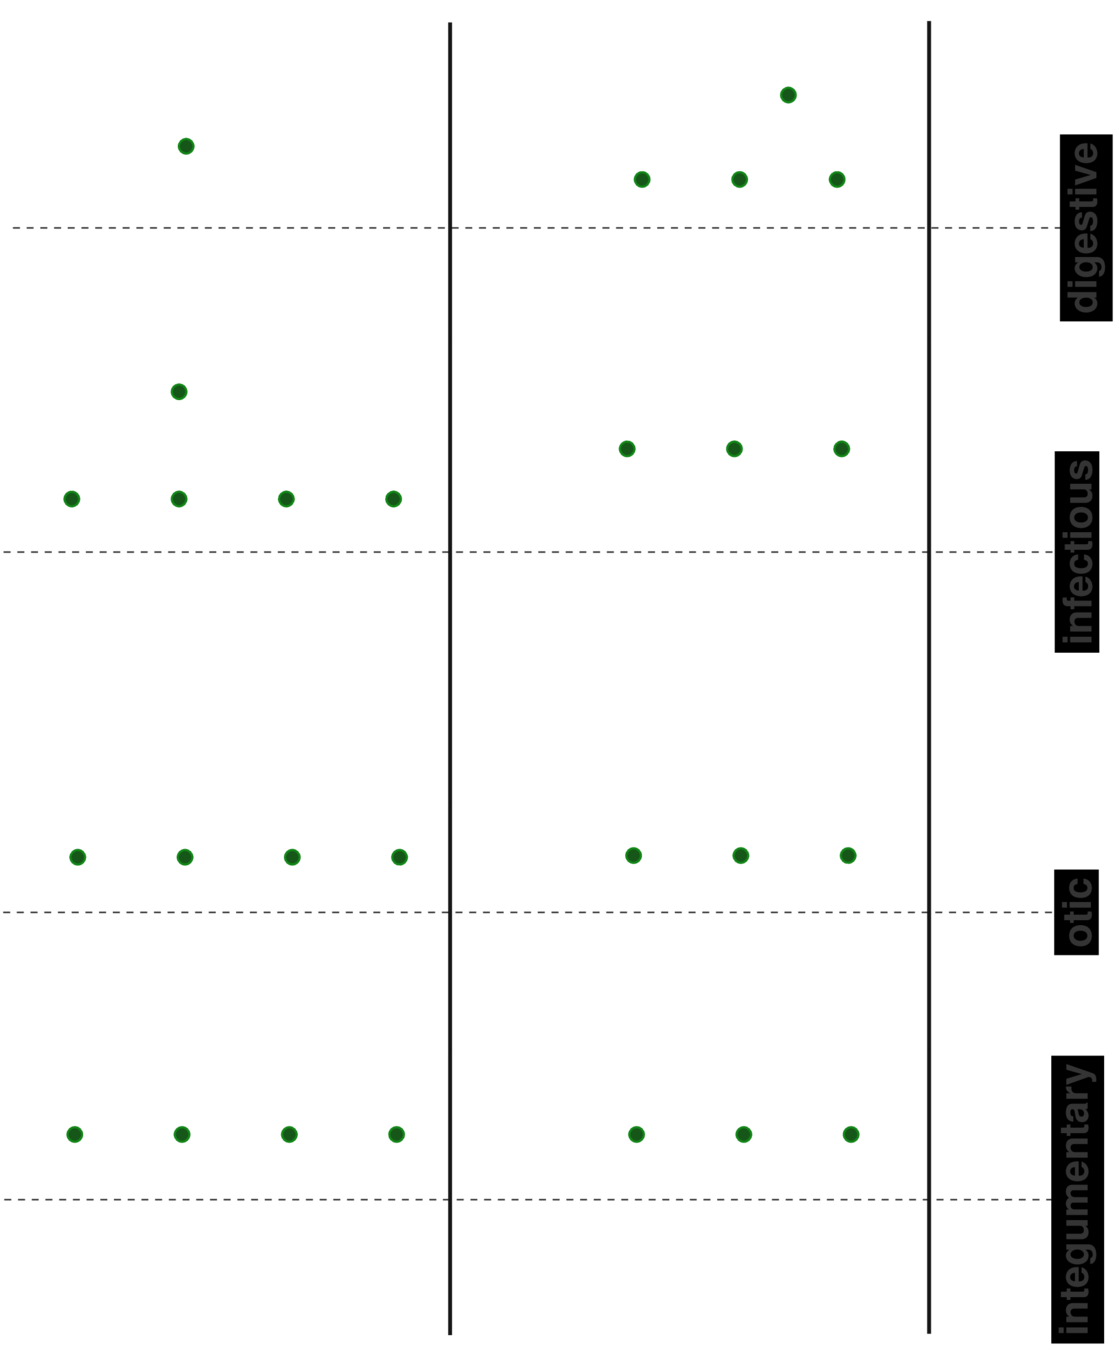
Immune female control
Immune female case
Endocrine female control
Endocrine female case
Cardiovascular female control
Cardiovascular female case
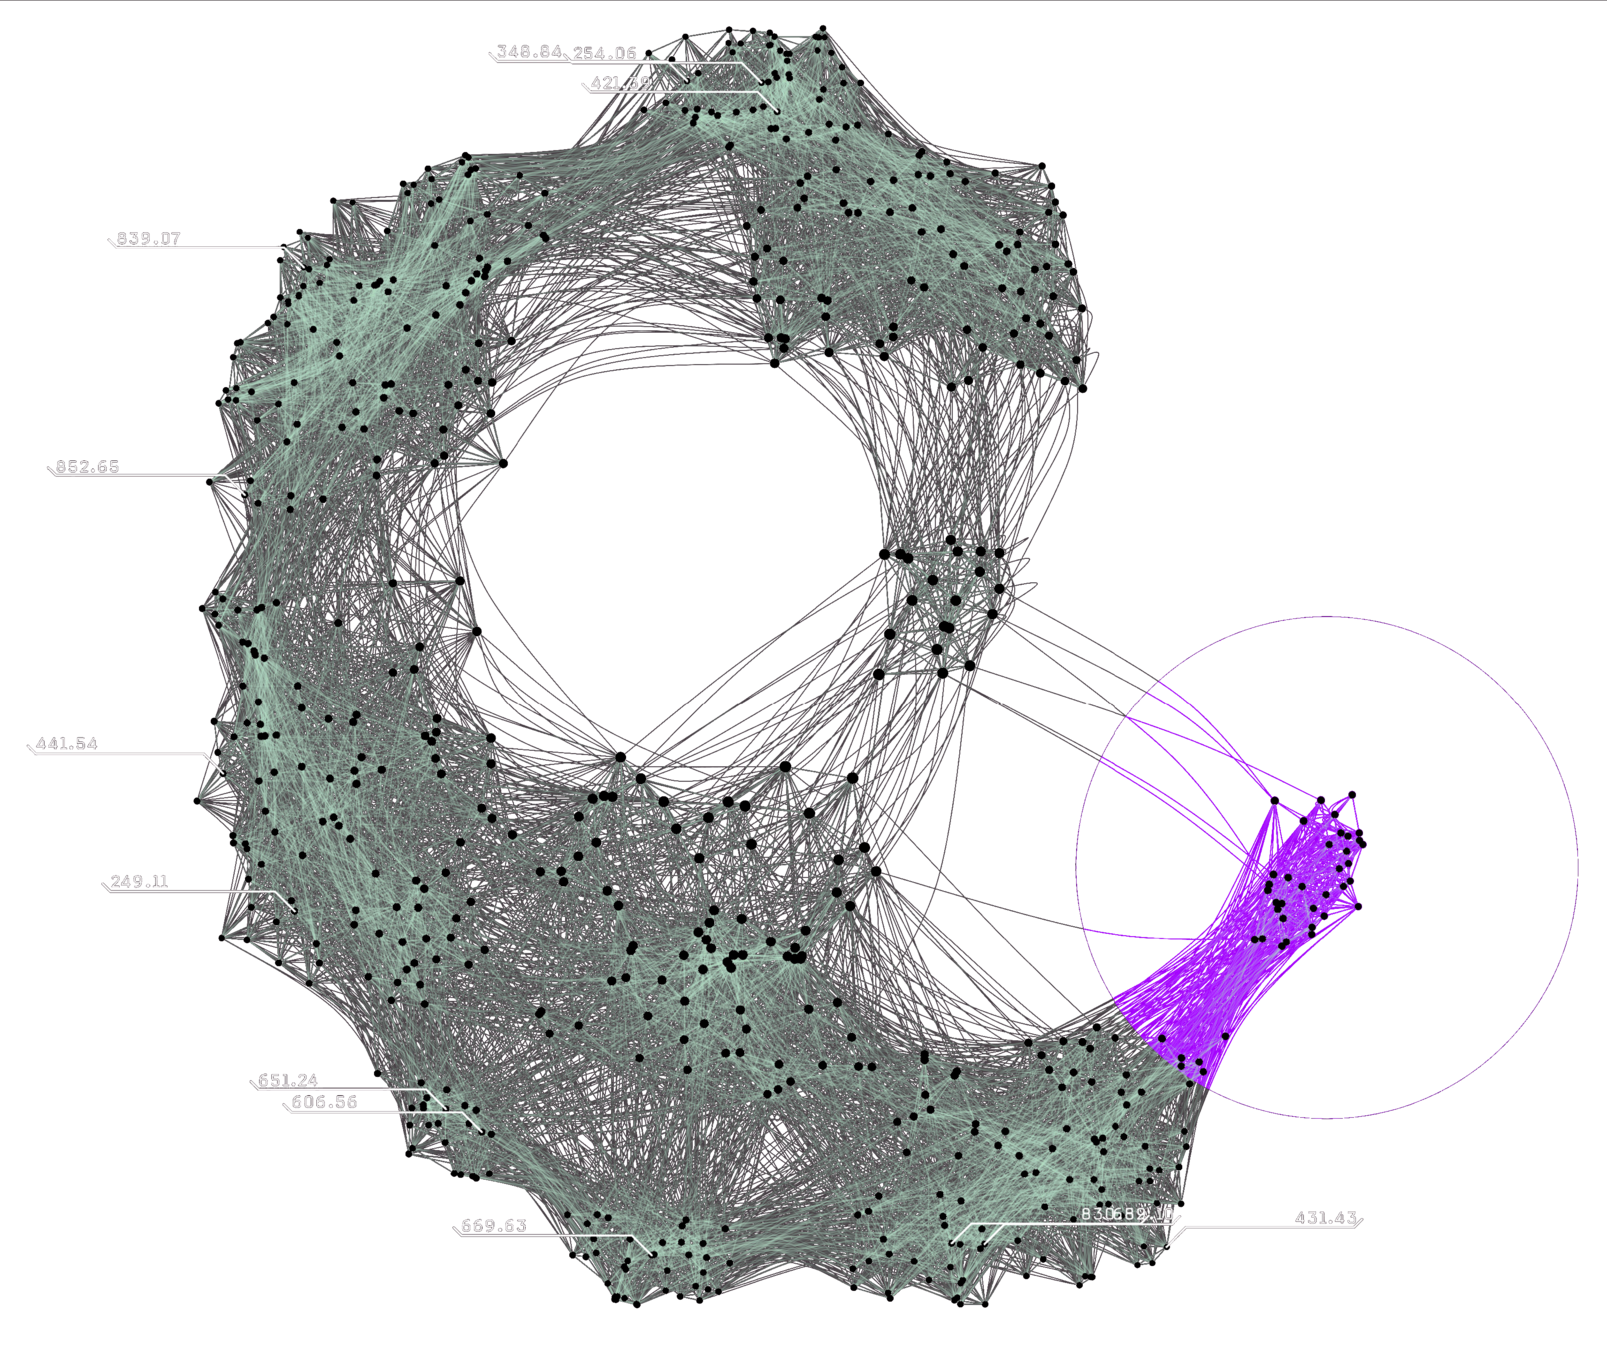
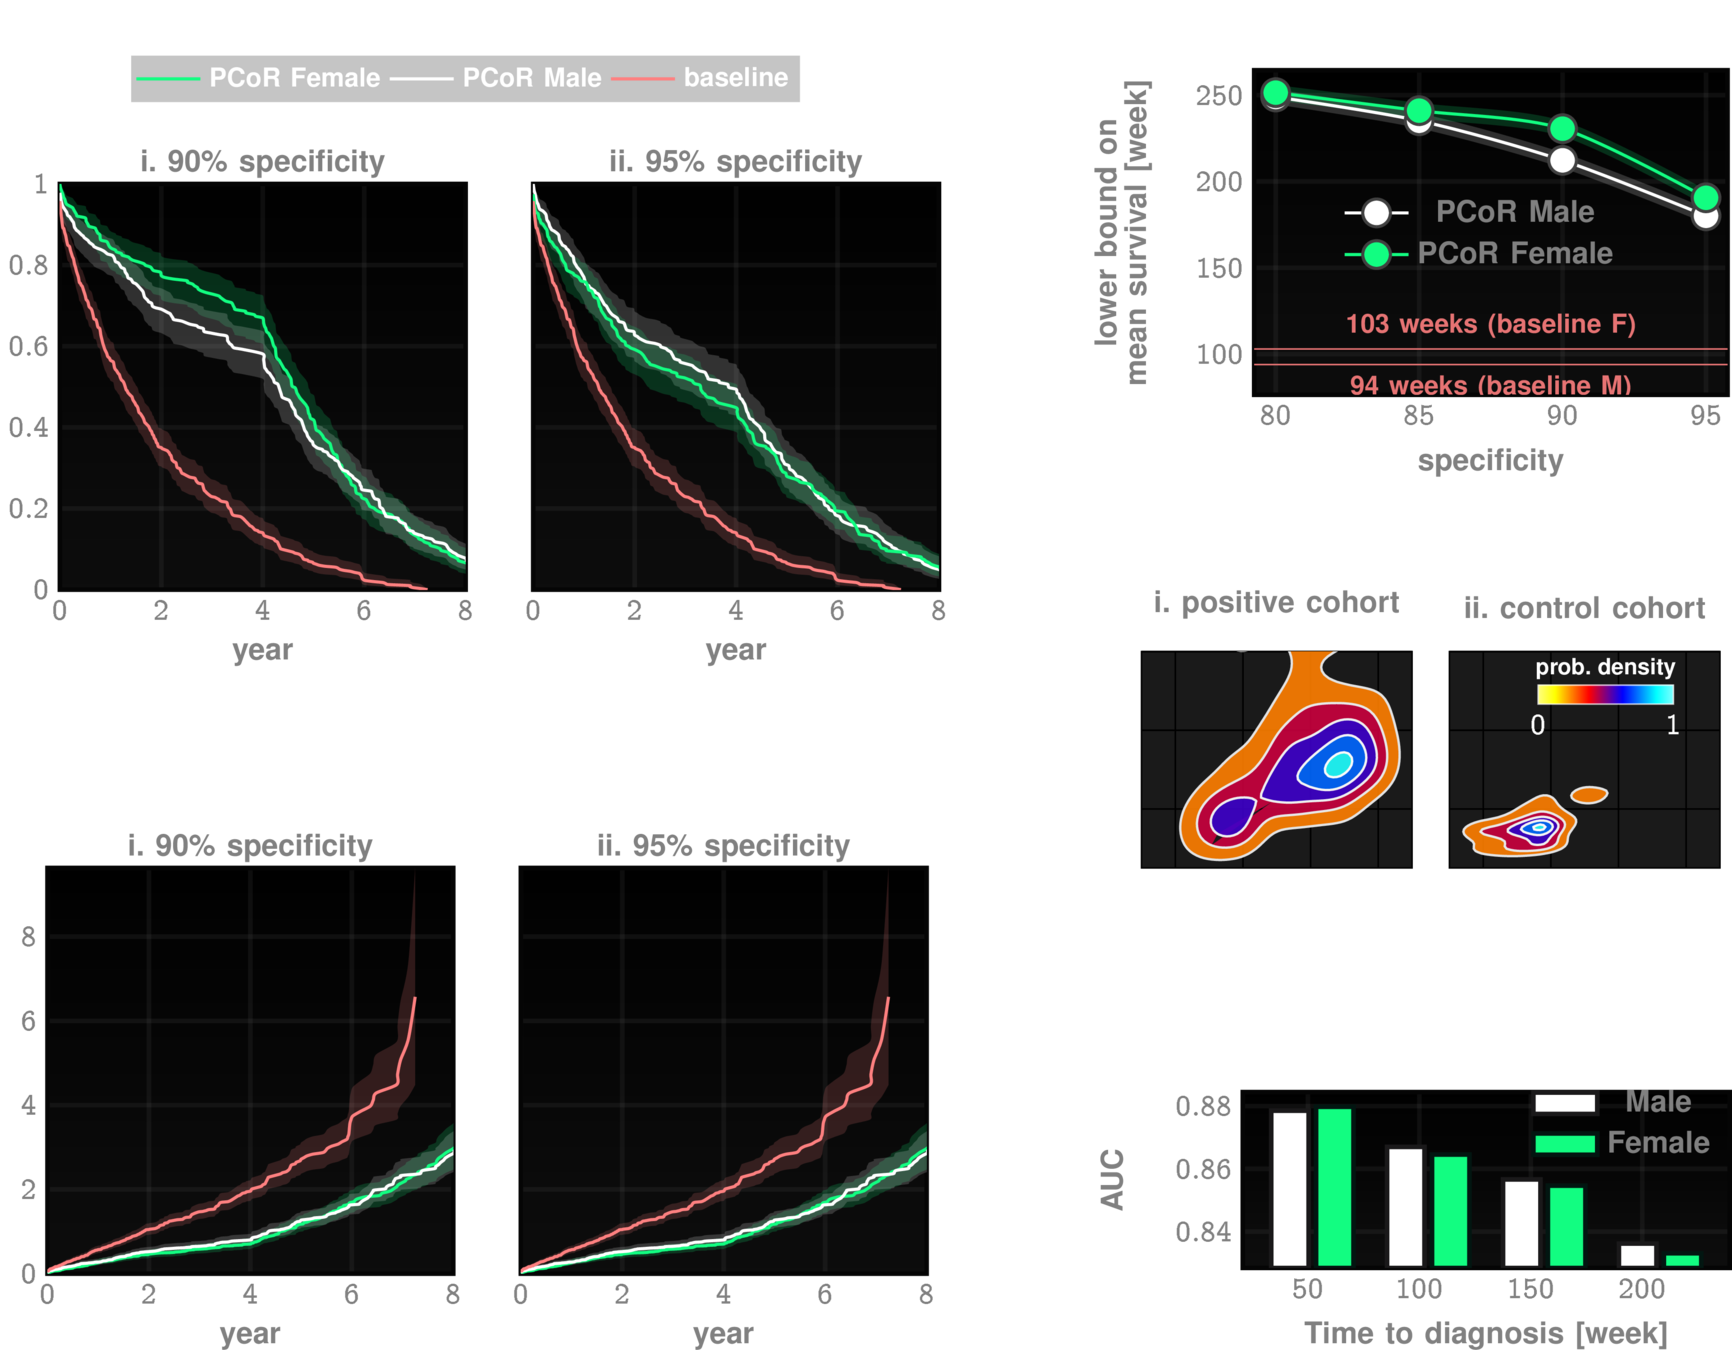
Secret Sauce: Leverging Temporal Patterns
Specialized HMM models from code sequences
Model control and case cohorts seprately
given a new test case, compute likelihood of sample arising from case models vs control models
sequence likelihood defect
AI
Equity
&
Fairness
If we have time:
Ian Cero, Peter A. Wyman, I. Chattopadhyay, Robert D. Gibbons, Predictive equity in suicide risk screening, Journal of the Academy of Consultation-Liaison Psychiatry, 2023. https://doi.org/10.1016/j.jaclp.2023.03.005
AI
Equity
&
Fairness
Ian Cero
Peter Wyman
Robert Gibbons
Suicide is a major public health concern
1 death by suicide every 40 seconds
As per the data from the CDC, in 2019, there were over 47,500 suicide deaths in the U.S., with an age-adjusted rate of 13.9 per 100,000 individuals.
10th leading cause of death in the United States
Screening Tests are Increasingly common
Columbia-Suicide Severity Rating Scale (C-SSRS)
Patient Health Questionnaire-9 (PHQ-9)
Ask Suicide-Screening Questions (ASQ)
These screening tools are not meant to be diagnostic but rather to help identify individuals who may need further evaluation or intervention to prevent suicide.
Primary Care
Emergency Dept
School & Community
Screening Tests are Increasingly common
Columbia-Suicide Severity Rating Scale (C-SSRS)
Patient Health Questionnaire-9 (PHQ-9)
Ask Suicide-Screening Questions (ASQ)
Primary Care
Emergency Dept
School & Community
The increasing standardization of suicide risk screening suggests predictive models balance not only accuracy, but also fairness for the different groups of people whose futures are being predicted
Accuracy
Fairness
Group A
Group B
Ask Suicide-Screening Questions (ASQ) has high and equivalent sensitivity and specificity for suicide ideation across black and white youth in the emergency department.
Black
Sensitivity
Specificity
Non-Hispanic White
Equal across groups
ASQ
Different Base rates (prevalence)
6.11 per 100,000*
15.68 per 100,000*
Non-Hispanic White
Black
*CDC 2019 Data
Uneven base rates
Mathematically unavoidable trade-off between model accuracy and fairness
Another Example: criminal recidivism
ProPublica recently analyzed over 10,000 of the actual predictions from a popular recidivism prediction model (COMPAS)
Black defendants were twice as likely as white defendants to receive a false positive classification
Creators of COMPAS presented equally compelling findings
model’s overall classification accuracy (about 64%) was in fact equal for both black and white defendants
UNLIKELY due to "biased data", or model
Predictive disparity is likely caused by uneven base rates on the outcome being predicted*
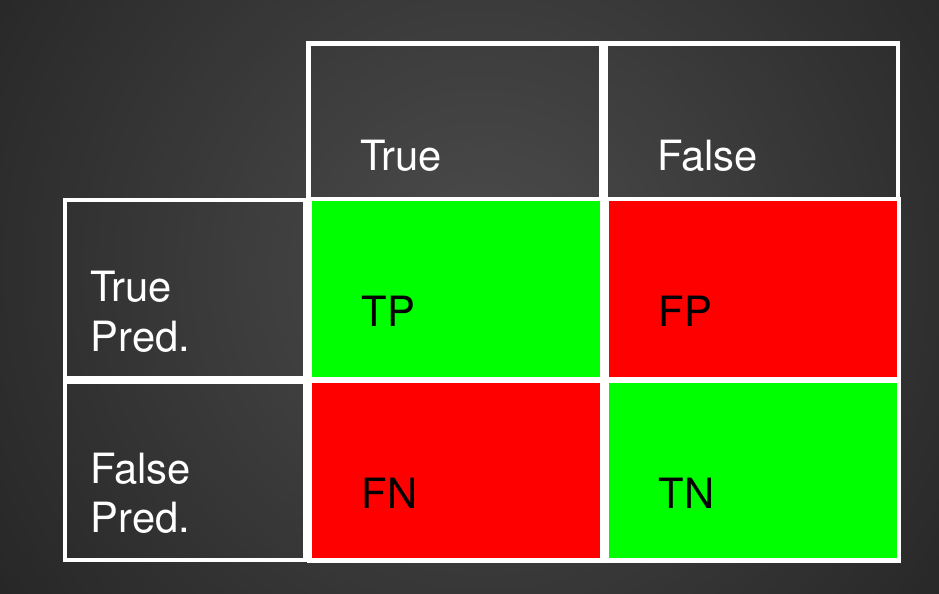
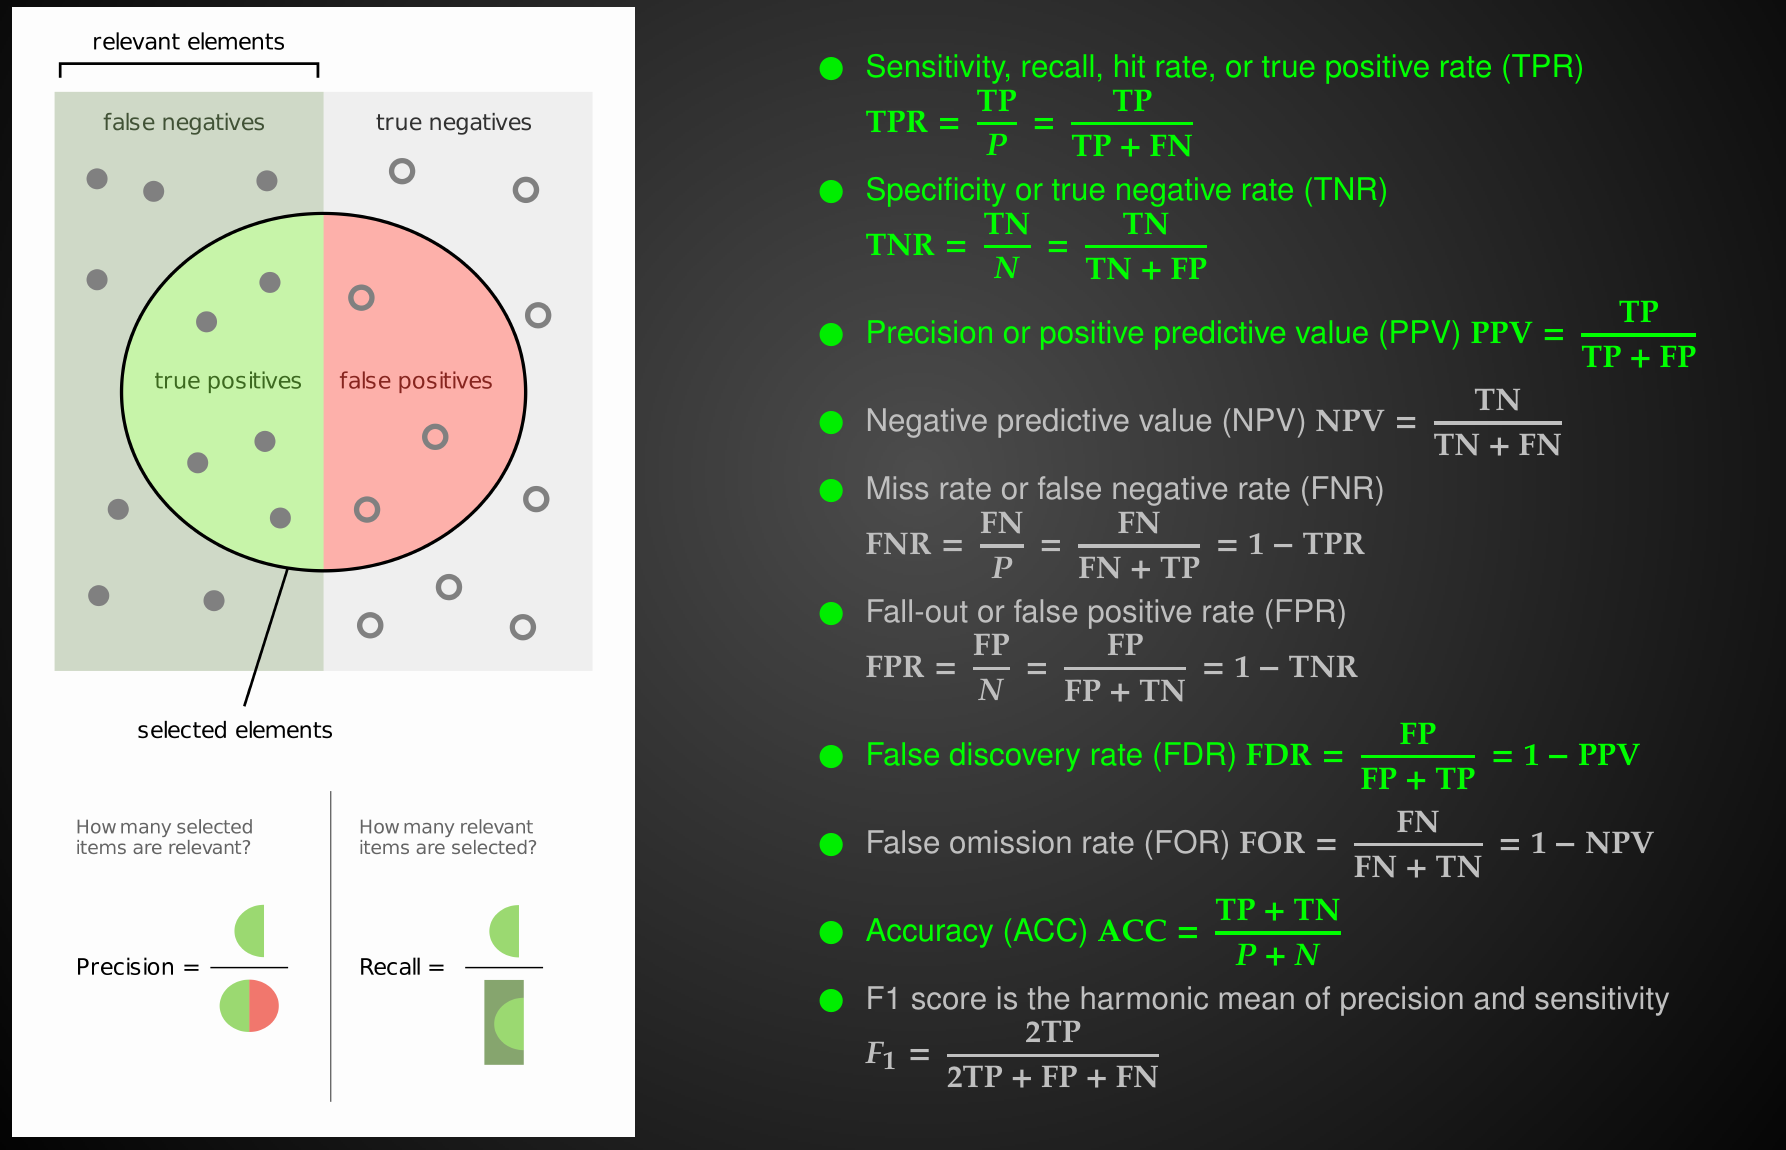
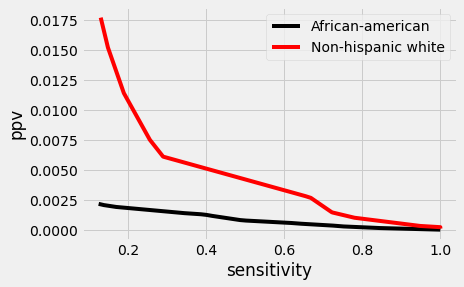
sensitivity
specificity
precision
prevalence
prevalence is intrinsic property of the disease
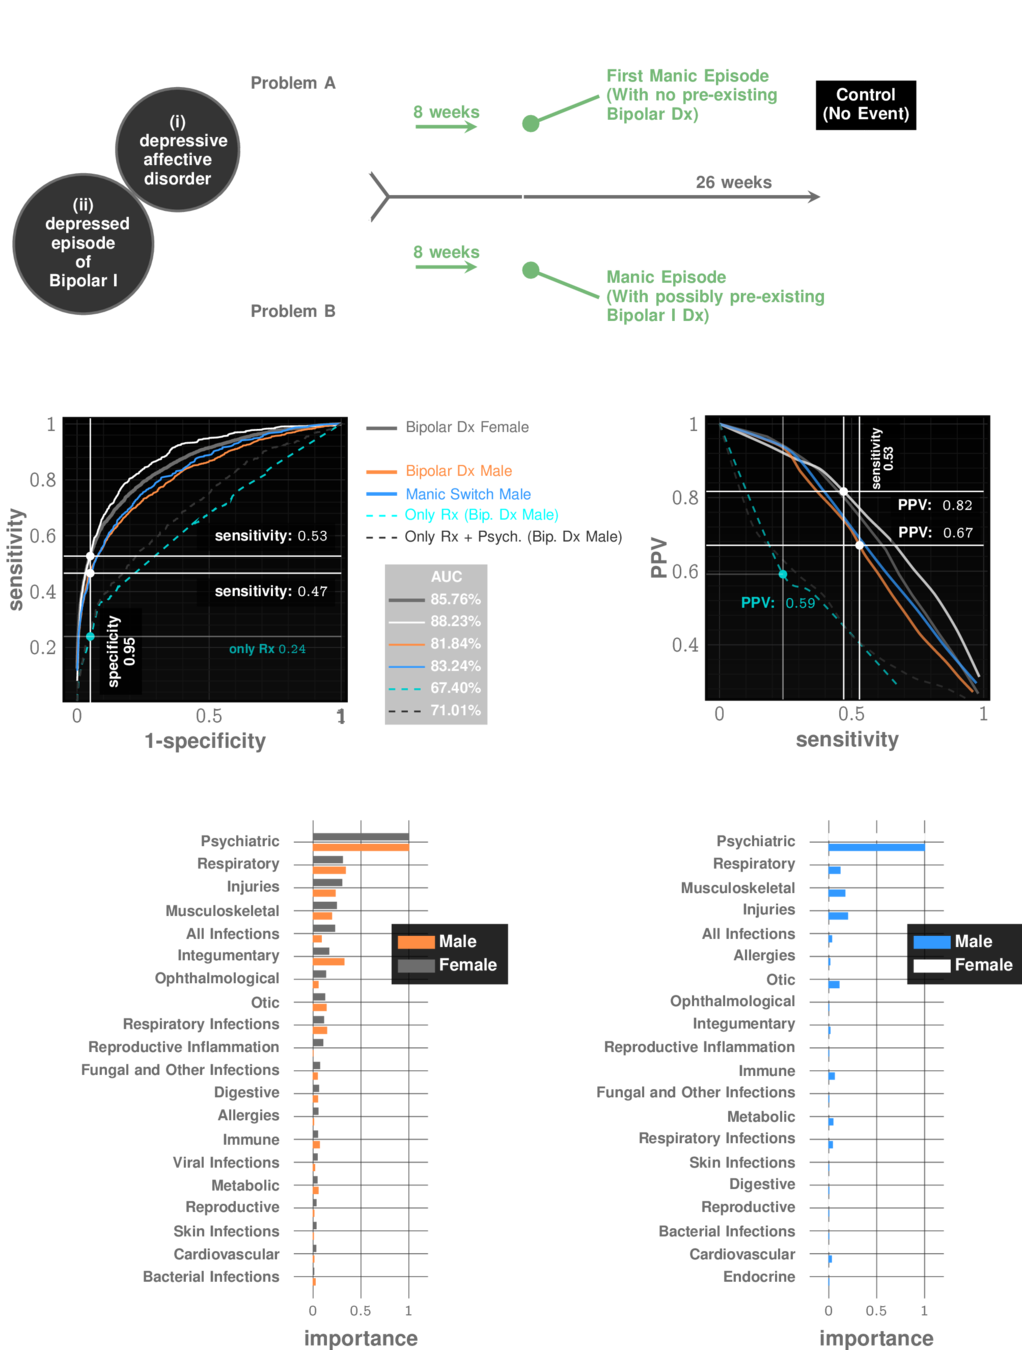
Manic Episode with no Bipolar history
prevalence: ~10%
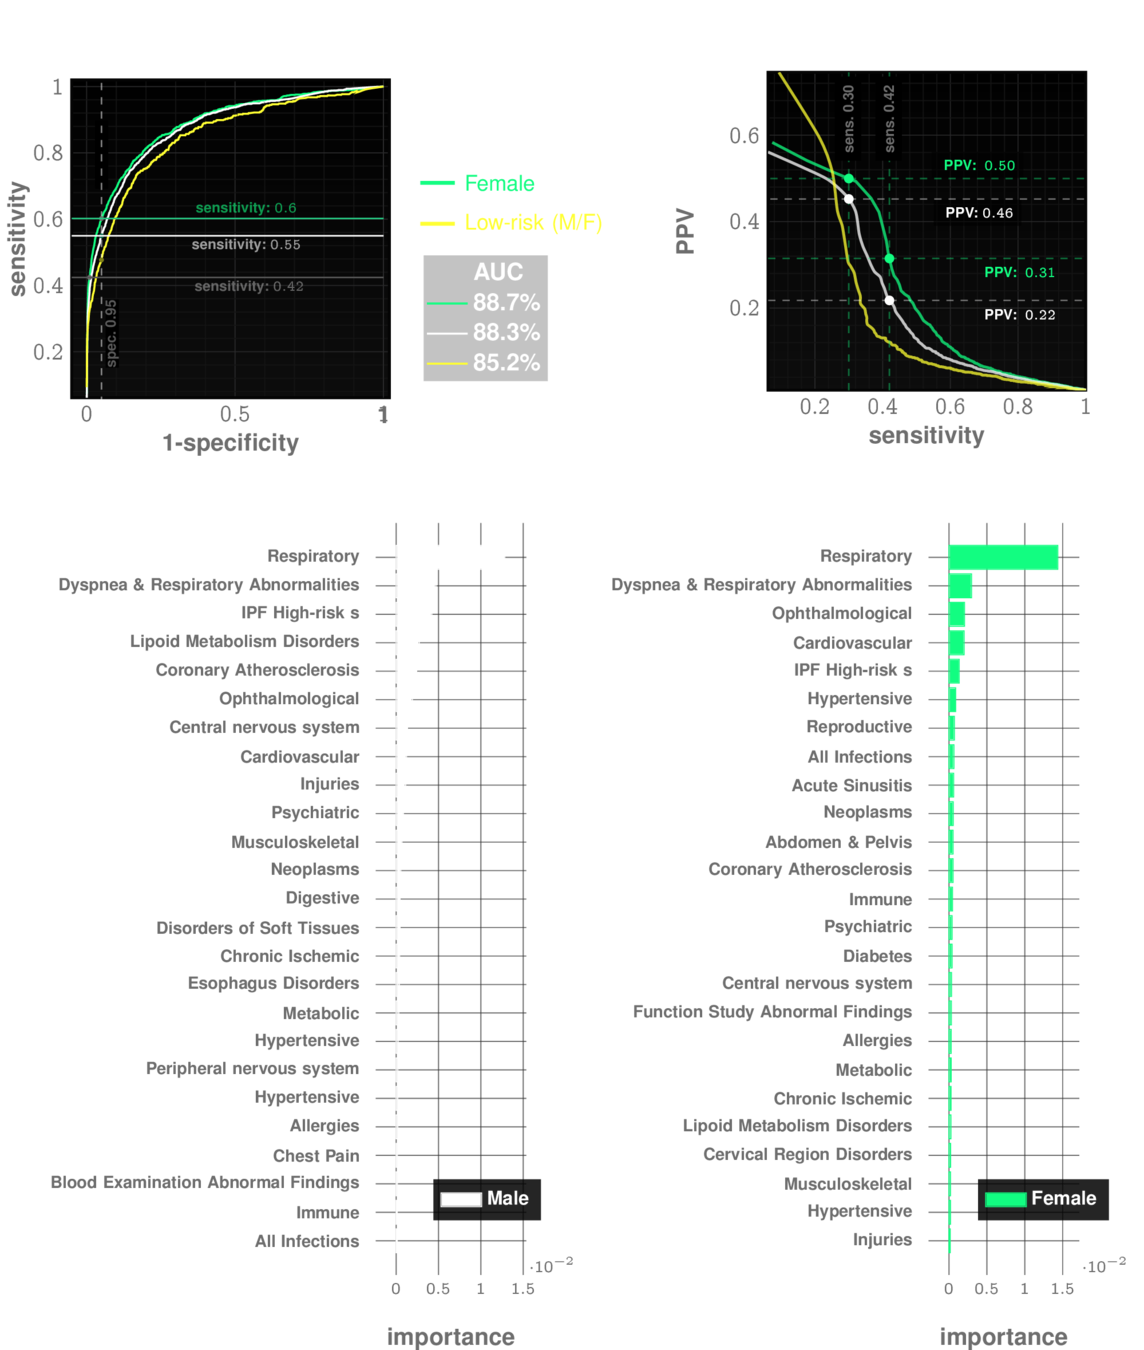
Idiopathic Pulmonary Fibrosis
prevalence: ~0.5%
The decision threshold is upto us to decide
Impacts sensitivity & specificity
Each choice of a threshold produces a different test
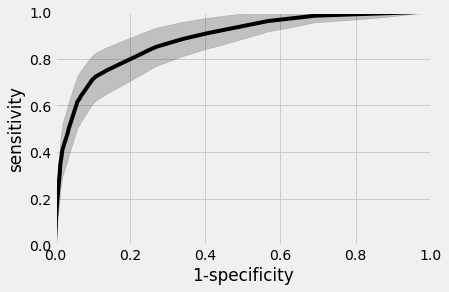
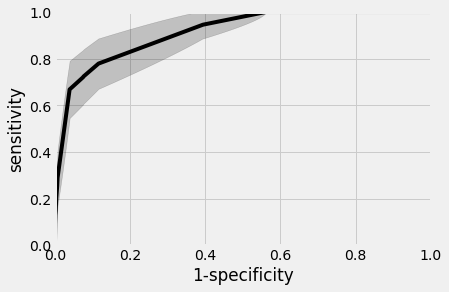
UCM Data
Blacks
Non-Hispanic Whites
AUC~90%
AUC~88%
Universal SCreening for Suicidal Ideation / Attempts
UCM Data
Universal SCreening for Suicidal Ideation / Attempts
UCM Data
Universal SCreening for Suicidal Ideation / Attempts
UCM Data
Universal SCreening for Suicidal Ideation / Attempts
$466,700
$135,700
15
Assume you have $1,000,000 to allocate to the post-screening followup service
67%
33%
25
Number of actual individuals helped
Demographic breakdown at UCM
=40
9
Assume you have $1,000,000 to allocate to the post-screening followup service
44%
66%
49
Number of actual individuals helped
Demographic breakdown at UCM
+
Differential
base
rate
=58
Race-blind followup
21
Assume you have $1,000,000 to allocate to the post-screening followup service
100%
0%
0
Number of actual individuals helped
=21
17
Assume you have $1,000,000 to allocate to the post-screening followup service
77.5%
22.5%
17
Number of actual individuals helped
Equal outcome
allocation
=34
No blood tests, no questionnaires, just diagnostic codes.
Instantaneous Universal Screening at Primary Care.
Works even for patients without history of mental disorders.
Screening
Posterior odds of SI/SA
in flagged population:
13 in 20
Prior odds of SI/SA
in general population:
1 in 20
3 out of 13 true flags have no prior history of mental disorders
The Screening Test is at its performance limit
The Ethics Question
Distribute resources race-blind
Distribute resources to make equal outcomes
Lives saved
58
34
The new frontier of predictive fairness in suicide prediction
By Ishanu Chattopadhyay
Predictive modeling of crime and rare phenomena using fractal nets


