


Alexis Jacomy
I am a data-visualization engineer from Nantes, France. I frequently speak in conferences and meetups about data visualization, web technologies, and networks mapping.
DH2025, July 14-18 2025, Lisbon, Portugal
v0.6
v0.8
v0.9
v0.10
v0.7
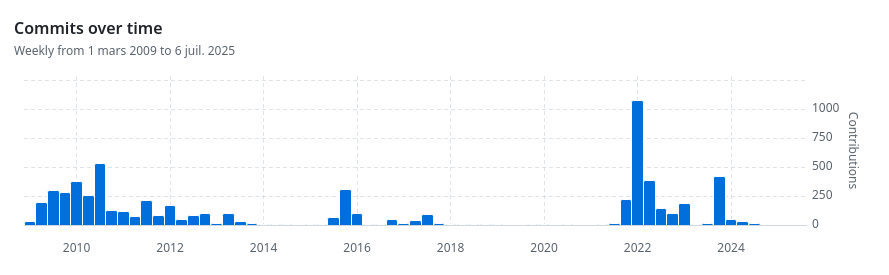
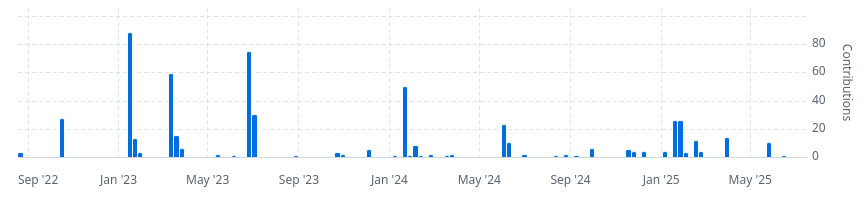
commits histogram from GitHub
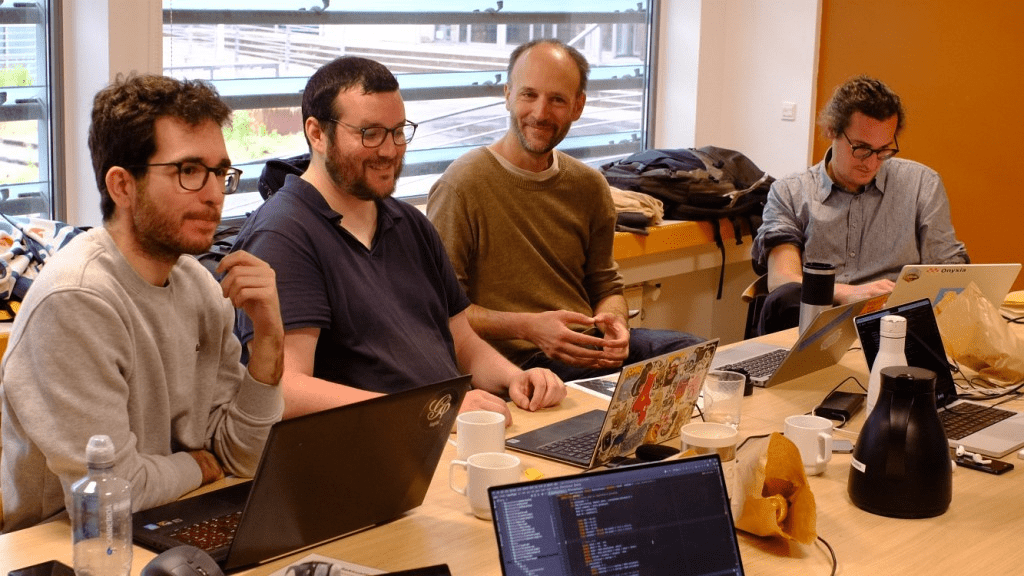
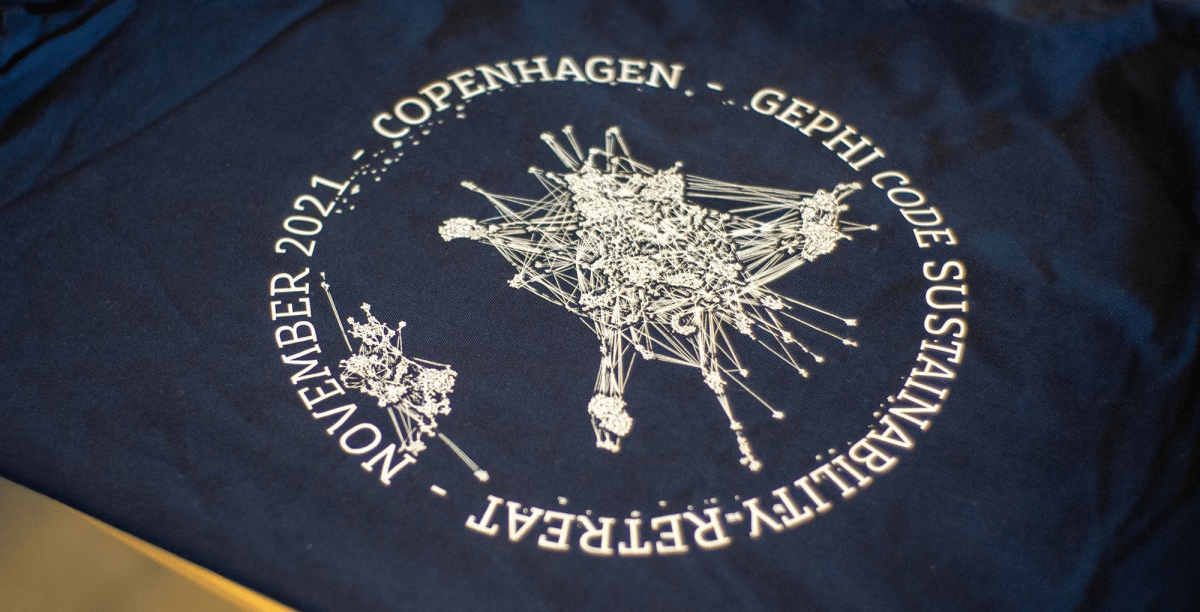
photos taken from the Gephi blog
Martin Grandjean, Mathieu Jacomy. Translating Networks: Assessing Correspondence Between Network Visualisation and Analytics.
Digital Humanities, 2019, Utrecht, Netherlands. halshs-02179024
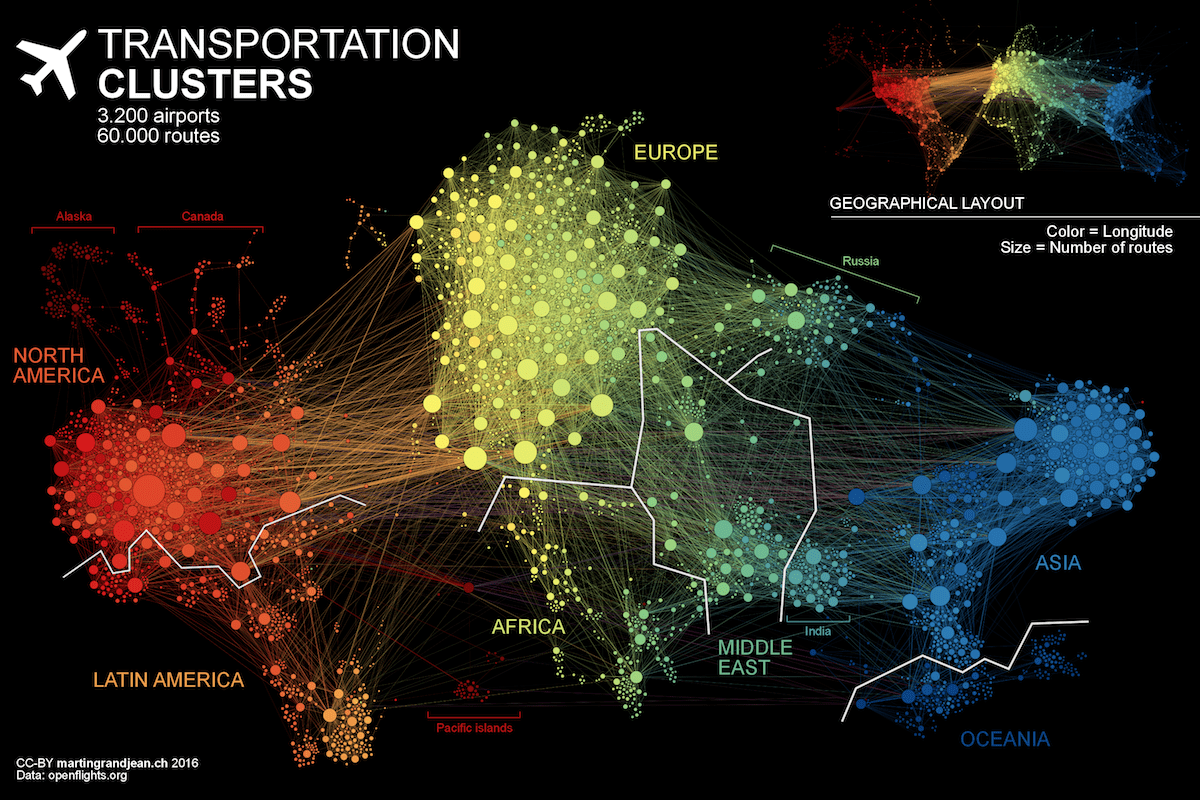
Martin Grandjean. Connected World: Untangling the Air Traffic Network
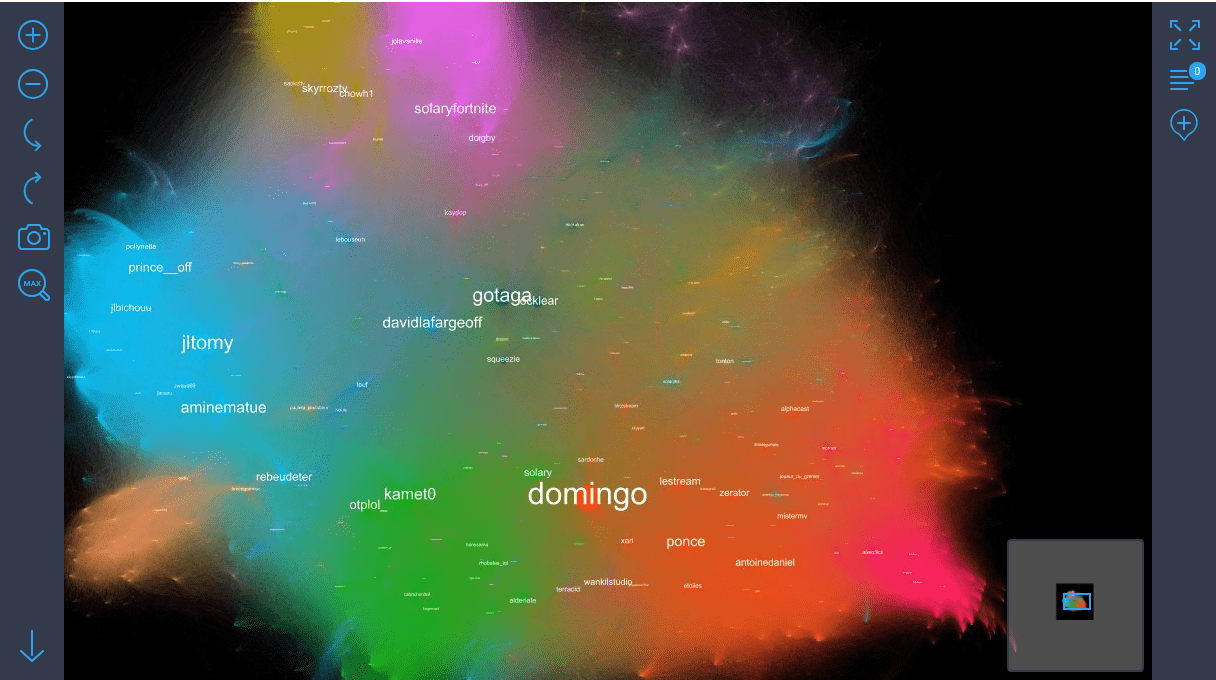
Nicolas Bouchaïb. Cartographie Twitch FR complète
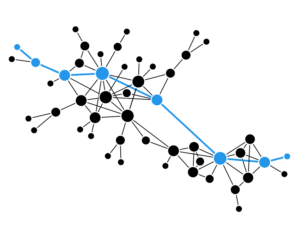
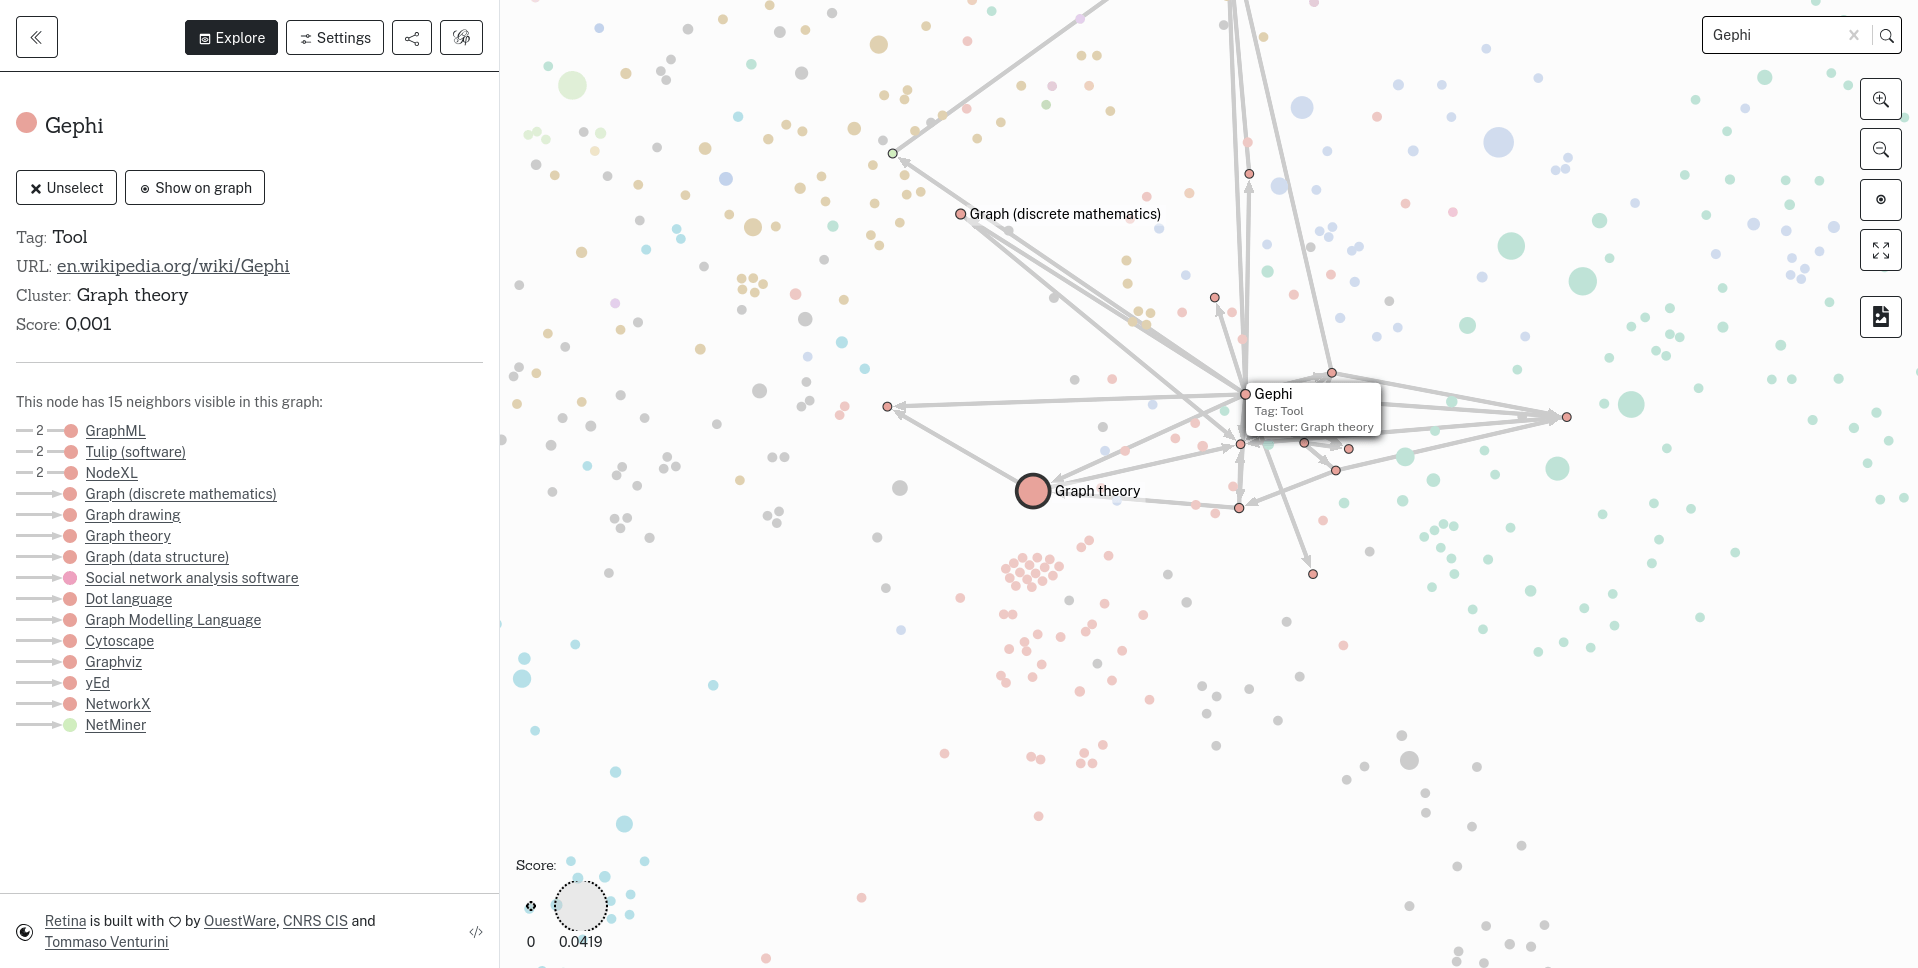
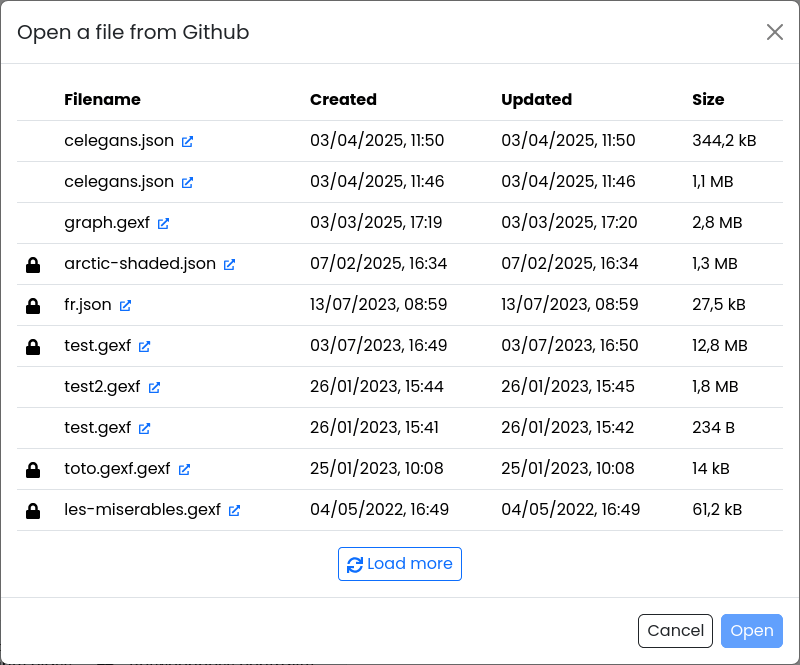
OuestWare, Retina demo graph
as simply as we embed geo maps in web pages
the "Minority Report reference", yipp.nl
v0.1
commits histogram from GitHub
...
v0.2
v0.3
v0.4
v0.6
v0.5
FOSDEM 2019
FOSDEM 2024
User interviews
Full redesign
New version coming soon!
import { GephiLiteDriver } from "@gephi/gephi-lite-broadcast";
import Graph from "graphology";

async function openGraphInGephiLite(graph: Graph) {
  const driver = new GephiLiteDriver();

  await new Promise<void>((resolve) => {
    // Wait for new instance to be fully working:
    driver.on("newInstance", () => {
      resolve();
    });
    driver.openGephiLite();
  });

  await driver.importGraph(graph.toJSON());

  driver.destroy();
}one graph per tab
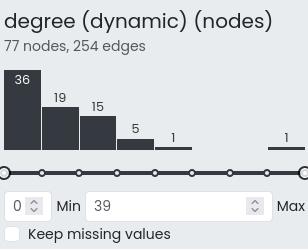
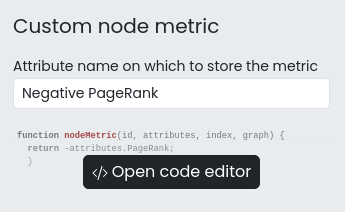
integrated JavaScript data and filters scripting
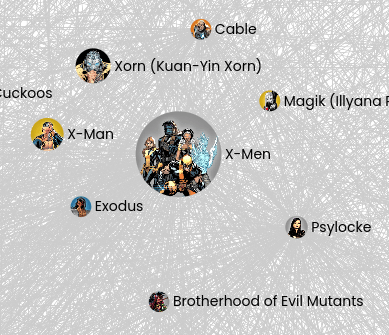
node images
By Alexis Jacomy
A 10 minutes presentation about Gephi Lite, at DH2025, Lisbon


