JavaScript Debugging

General Practice

  • Often I use console.logs to tell a story in the console and I can spot the mistake from there
  • If you get something where the program 'fails silently', then it may be possible to do process of elimination by commenting out parts of the code until it fails
  • That can take time though, and sometimes it gets a little more complex
  • At this point we have to use developer tools

Developer Tools

Panels

  • Whilst there are many panels, there are only a few we'll look at here
    • console
    • network
    • sources
    • profile
    • performance
    • memory
    • application

Console Tab

Console

  • Console is a REPL (read, evaluate, print loop)
  • It is a JavaScript-like environment
    • So don't rely on 100%
  • You type in things and they are executed on the spot
  • The line that is printed after you do that is what the operation returns 
  • Has 'type-ahead', press tab/→ to auto-complete
  • Clear is top left circle with line, or type clear and hit return
  • Place to look for errors
  • Press up/down arrow to cycle your command history
console.info("This is some info");
console.debug("This is a debug message");
console.warn(
  "This is a warning about something happening in your code. It has a stack trace to assist with debugging"
);
console.error(
  "This is an error. It has a stack trace to assist with debugging. It is not the same as throwing an error because it does not stop the code."
);
console.log("After the 'error'");

/* getting a stack trace */

function a(f) {
  f();
}

function b() {
  console.trace();
}

a(b);

/* console.assert - for testing */
let number = 2;
const errorMsg = "The number is not even";
console.assert(number % 2 === 0, { number: number, errorMsg: errorMsg });
number += 1;
console.assert(number % 2 === 0, { number: number, errorMsg: errorMsg });

/* console.table - for display */
const obj = {
  subobject: {
    property: "value",
    other: "value"
  },
  property: "value"
};

console.table(obj, ["subobject"]);

const people = [
  { firstName: "James", lastName: "Sherry" },
  { firstName: "Robert", lastName: "Sherry" },
  { firstName: "Katie", lastName: "Smith" }
];

console.table(people);
console.table(people, ["firstName"]); // restrict columns

/* Counters */
console.count();
console.count();
console.count();

console.countReset(); // reset
console.count();

// Giving it a name creates a new counter
console.count("James");

/* TIMERS */
// Create/start one (with a label/name) (You can have <10k timers)
console.time('some process');

setTimeout(() => {
	// get it's current time
	console.timeLog('some process');
}, 1000);

setTimeout(() => {
// stop/destroy
console.timeEnd('some process');
}, 2000);

/* GROUPS */
console.log("This is the outer level");
console.group();
console.log("Level 2");
console.group();
console.log("Level 3");
console.warn("More of level 3");
console.groupEnd();
console.log("Back to level 2");
console.groupEnd();
console.log("Back to the outer level");

/* groupCollapsed starts the groups off closed */
console.log("This is the outer level");
console.groupCollapsed();
console.log("Level 2");
console.groupCollapsed();
console.log("Level 3");
console.warn("More of level 3");
console.groupEnd();
console.log("Back to level 2");
console.groupEnd();
console.log("Back to the outer level");

/*****
 * CSS IN YOUR LOGS!!
 *****/

/*
THere is an old syntax from C called 'string substitution'. It works by you putting typed placeholders into your string and then passing the string to console and then further arguments to be inserted, so:

console.log('My name is %s', 'James');

// The types you can insert are:

%o or %O
Outputs a JavaScript object. Clicking the object name opens more information about it in the inspector.

%d or %i
Outputs an integer. Number formatting is supported, for example console.log("Foo %.2d", 1.1) will output the number as two significant figures with a leading 0: Foo 01

%s
Outputs a string.

%f
Outputs a floating-point value. Formatting is supported, for example console.log("Foo %.2f", 1.1) will output the number to 2 decimal places: Foo 1.10

%c is a directive that allows CSS to be used on the message. You can use:

background and its longhand equivalents.
border and its longhand equivalents
border-radius
box-decoration-break
box-shadow
clear and float
color
cursor
display
font and its longhand equivalents
line-height
margin
outline and its longhand equivalents
padding
text-* properties such as text-transform
white-space
word-spacing and word-break
writing-mode

*/

console.log(
  "Multiple styles: %cred %corange",
  "color: red",
  "color: orange",
  "Additional unformatted message"
);

console.log(
  "This is %cMy stylish message",
  "color: yellow; font-style: italic; background-color: blue;padding: 2px"
);

Pen

Network Tab

Network

  • Shows request made for resources
    • You can filter by type

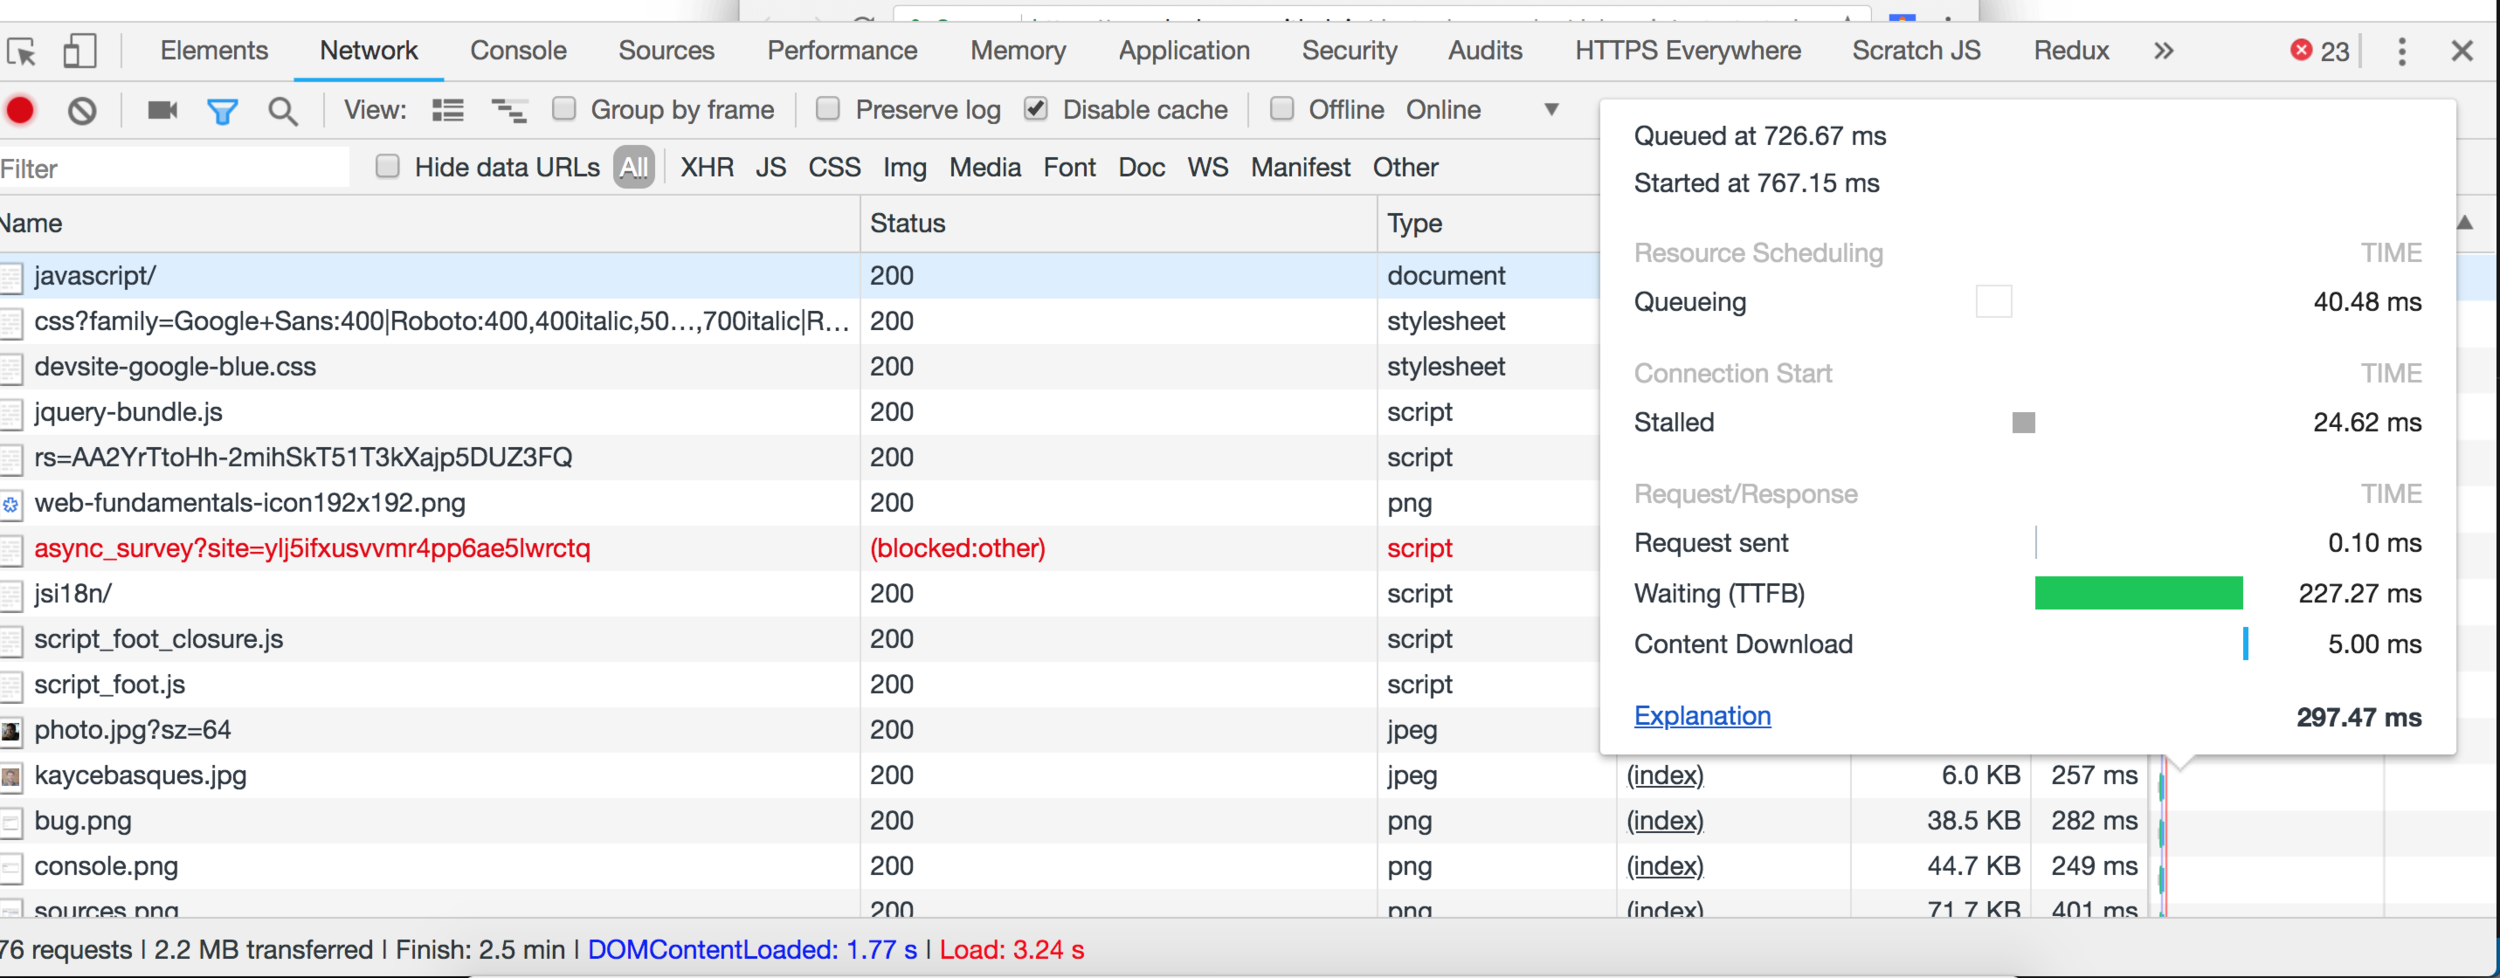
Note the 'waterfall' on the right:
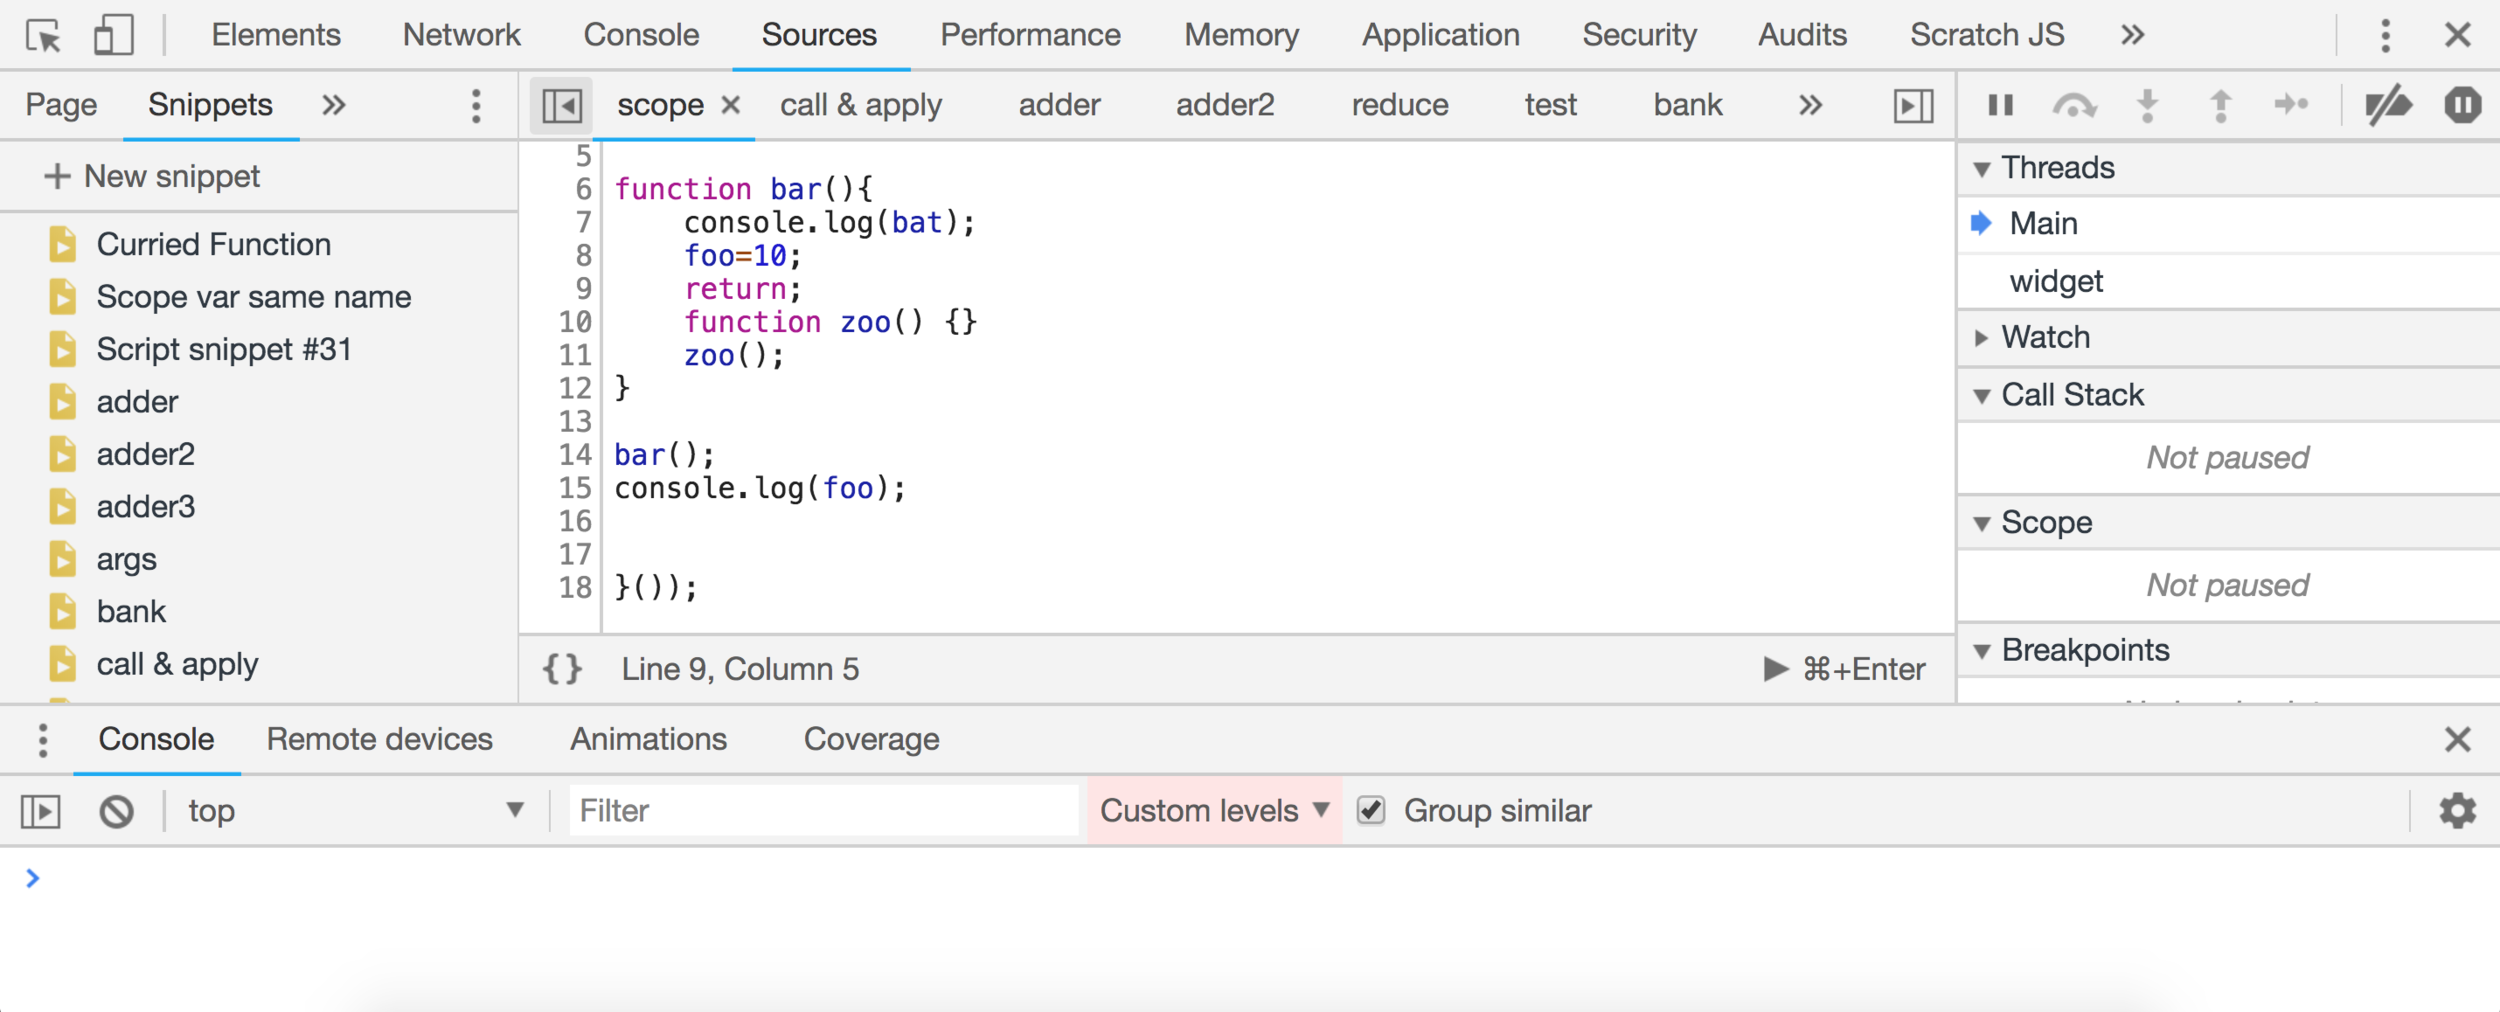
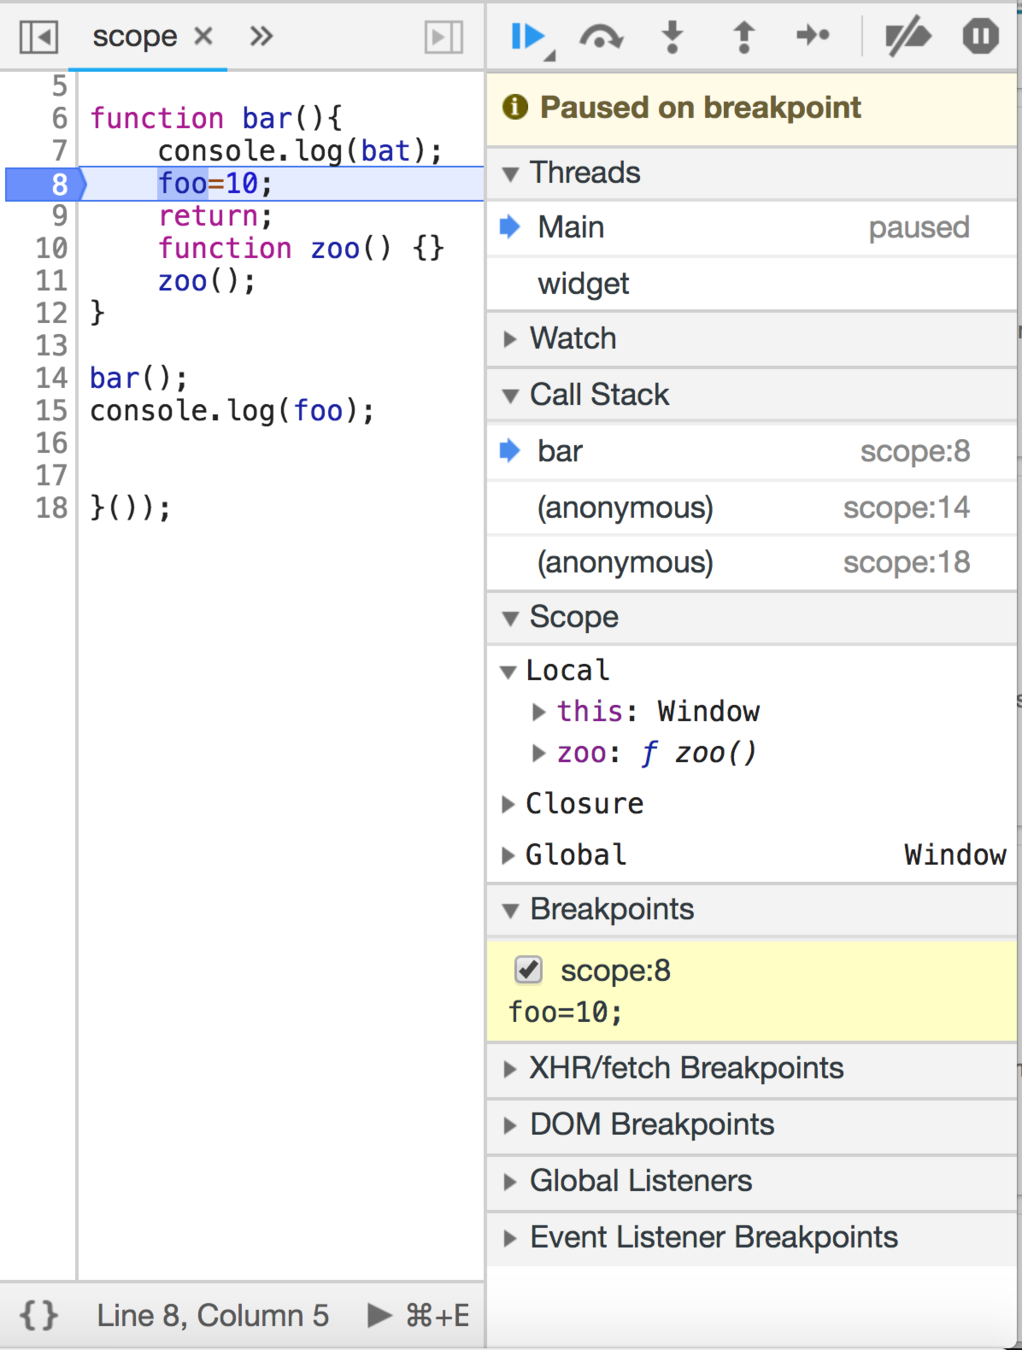
  • The blue line is when the document becomes interactive
  • The red is when everything sync has finished loading

Network cont...

  • Shows details of the request

Network cont...

  • Shows details of the response

Network cont...

  • Shows details of the response

Sources Tab

Sources Tab

  • Shows all files loaded in page
    • Good place to find if you've forgot to include something
  • Has a snippets section for you to do little code tests
  • Has debugger window

Sources Tab: Assets Panel

  • Shows the assets in the equation, Including:
    • loaded js files
    • Snippets you can make yourself to test things

Debugging Code

Pausing the code in real-time

  • You can stop the code at any point with Breakpoints (docs)
  • If you right click then you can disable/deactivate/remove this/all breakpoints.
    • Breakpoint marker goes more transparent, as does the BP entry you just clicked on
    • You can set breakpoints for
      • DOM mutation
      • Event listeners, etc.
      • I've barely used them...
    • You can write debugger; in your code to auto BP

Sources Tab: Watch Panel

  • When you pause on a breakpoint, you can see the:
    • Watch allows you to type in the name of an entity and watch its value as you step through
    • Call stack 
      • Clicking on each one puts you back into that fn with its environment intact
    • Scope shows you what is in scope locally, in closure and globally

Sources Tab: Watch Panel cont...

The play controls:

  • The blue arrow is when you're stuck on a BP.
    • Clicking it allows the script to run to the next BP/end.
    • When you are on a BP, you can then advance line-by-line
  • The next one is 'step over'. This means you don't get involved in the next line's execution. You're not interested in it, so you go to the line after that
  • Next is 'Step into'. You go onto that line, then get involved in it's execution processes.
    • if a sub function is called, then you'll move into that sub function
      • You can move back by selecting the parent in the call stack

Sources Tab: Watch Panel cont...

The play controls:

  • After that is 'step out'. When you don't want to go any further into this functions execution and you want to go back to the parent, then you step out.
  • The next one is 'step'. You just step forward one line.
  • Next is disable all breakpoints (or passthrough): Useful if you want to do a quick end to end test without removing your BPs
  • Finally, there's pause on exceptions
    • if you click it and there's an error it will stop at the point of error (does not work in esm scripts in nested functions!)
    • if your error is handled (try/catch) and you still want to see, then there's a pause on caught exceptions checkbox available when you click pause on exceptions

Sources Tab: Debug Panel

  • You can open scripts or snippets and see them as you would in atom (tabs at the top, content below)
  • The {} symbol prettifies minified code
  • The line numbers down the side allow you to place breakpoints, which are places where you can pause the code mid-run. (To toggle them, just click on the line number)

Application Tab

Application

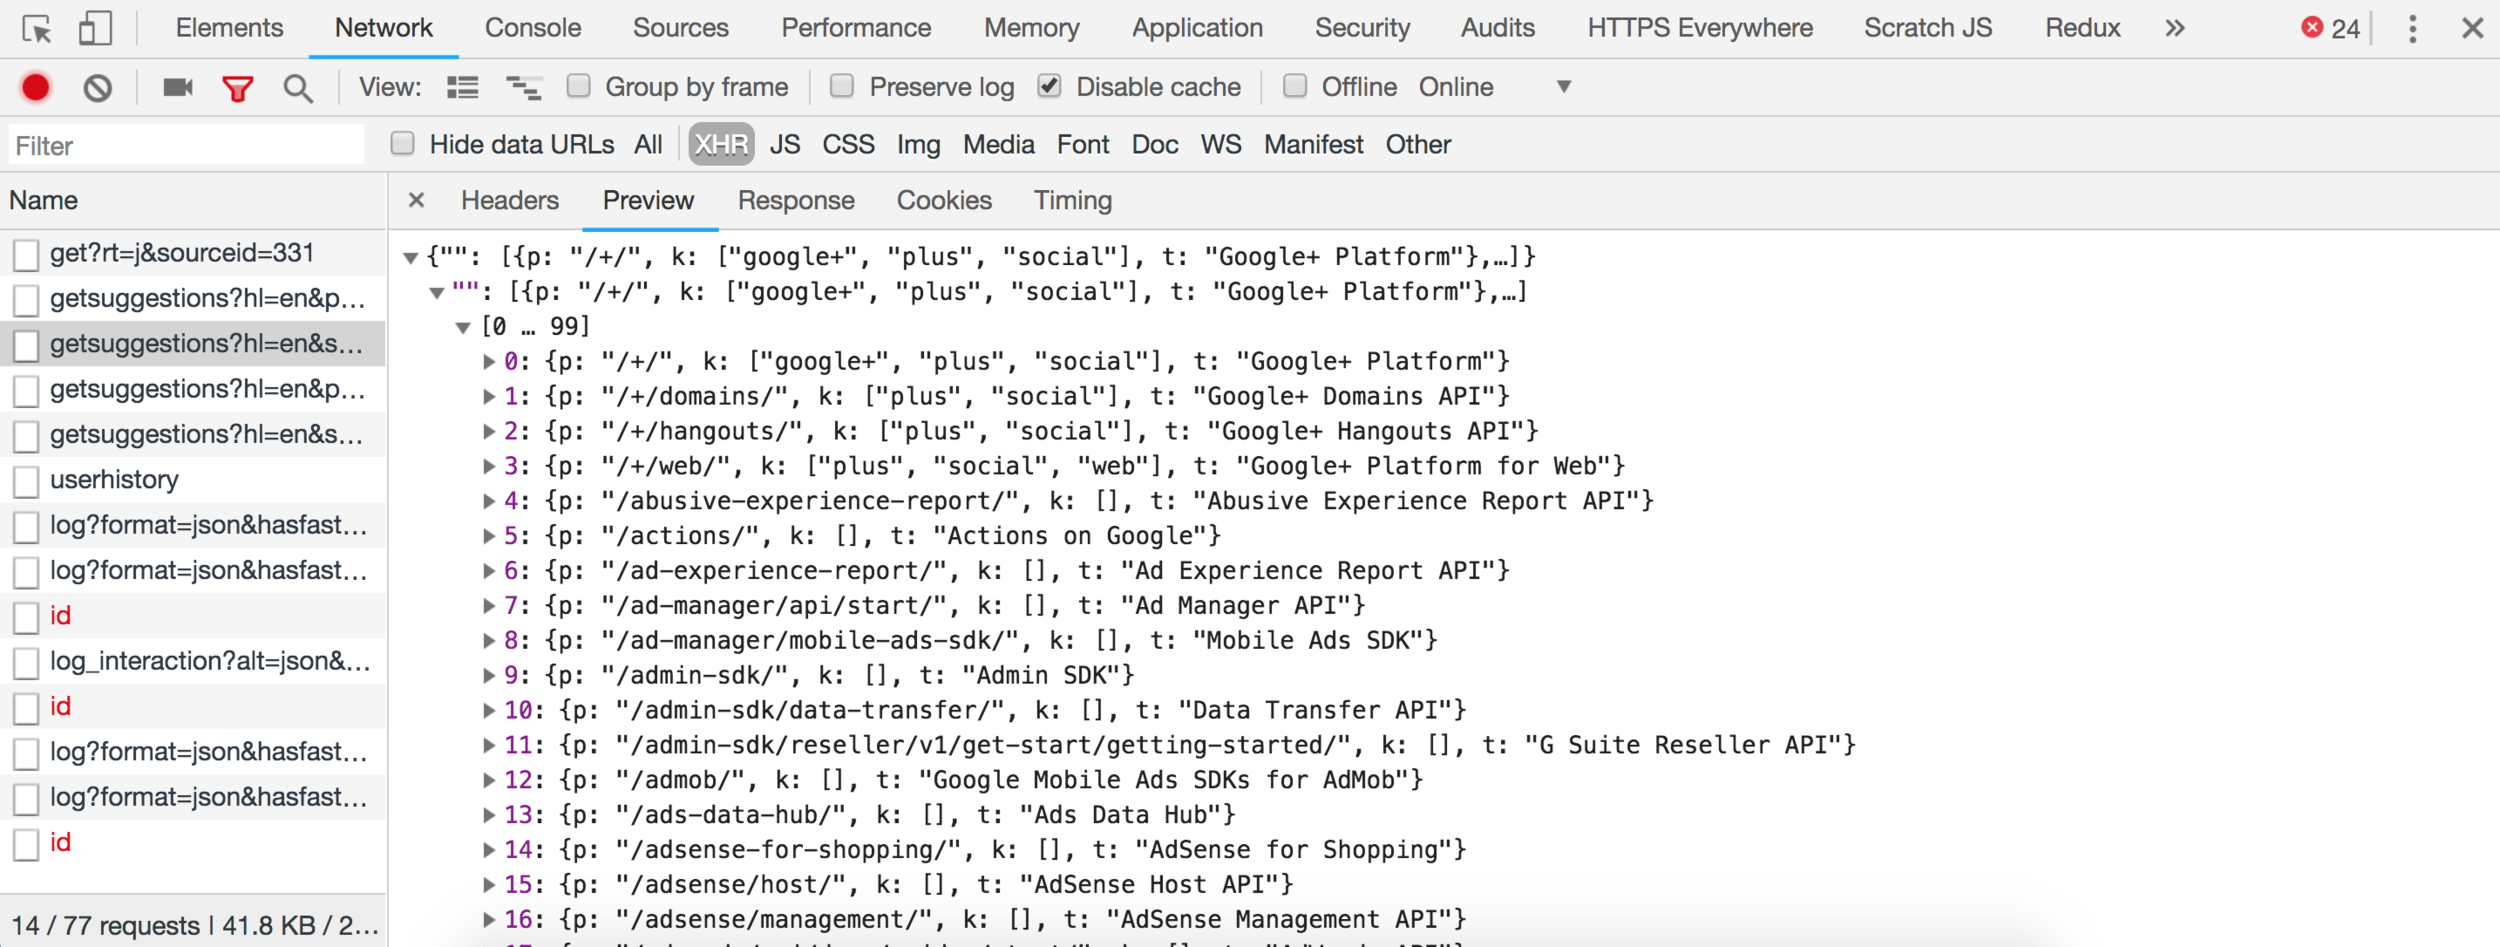
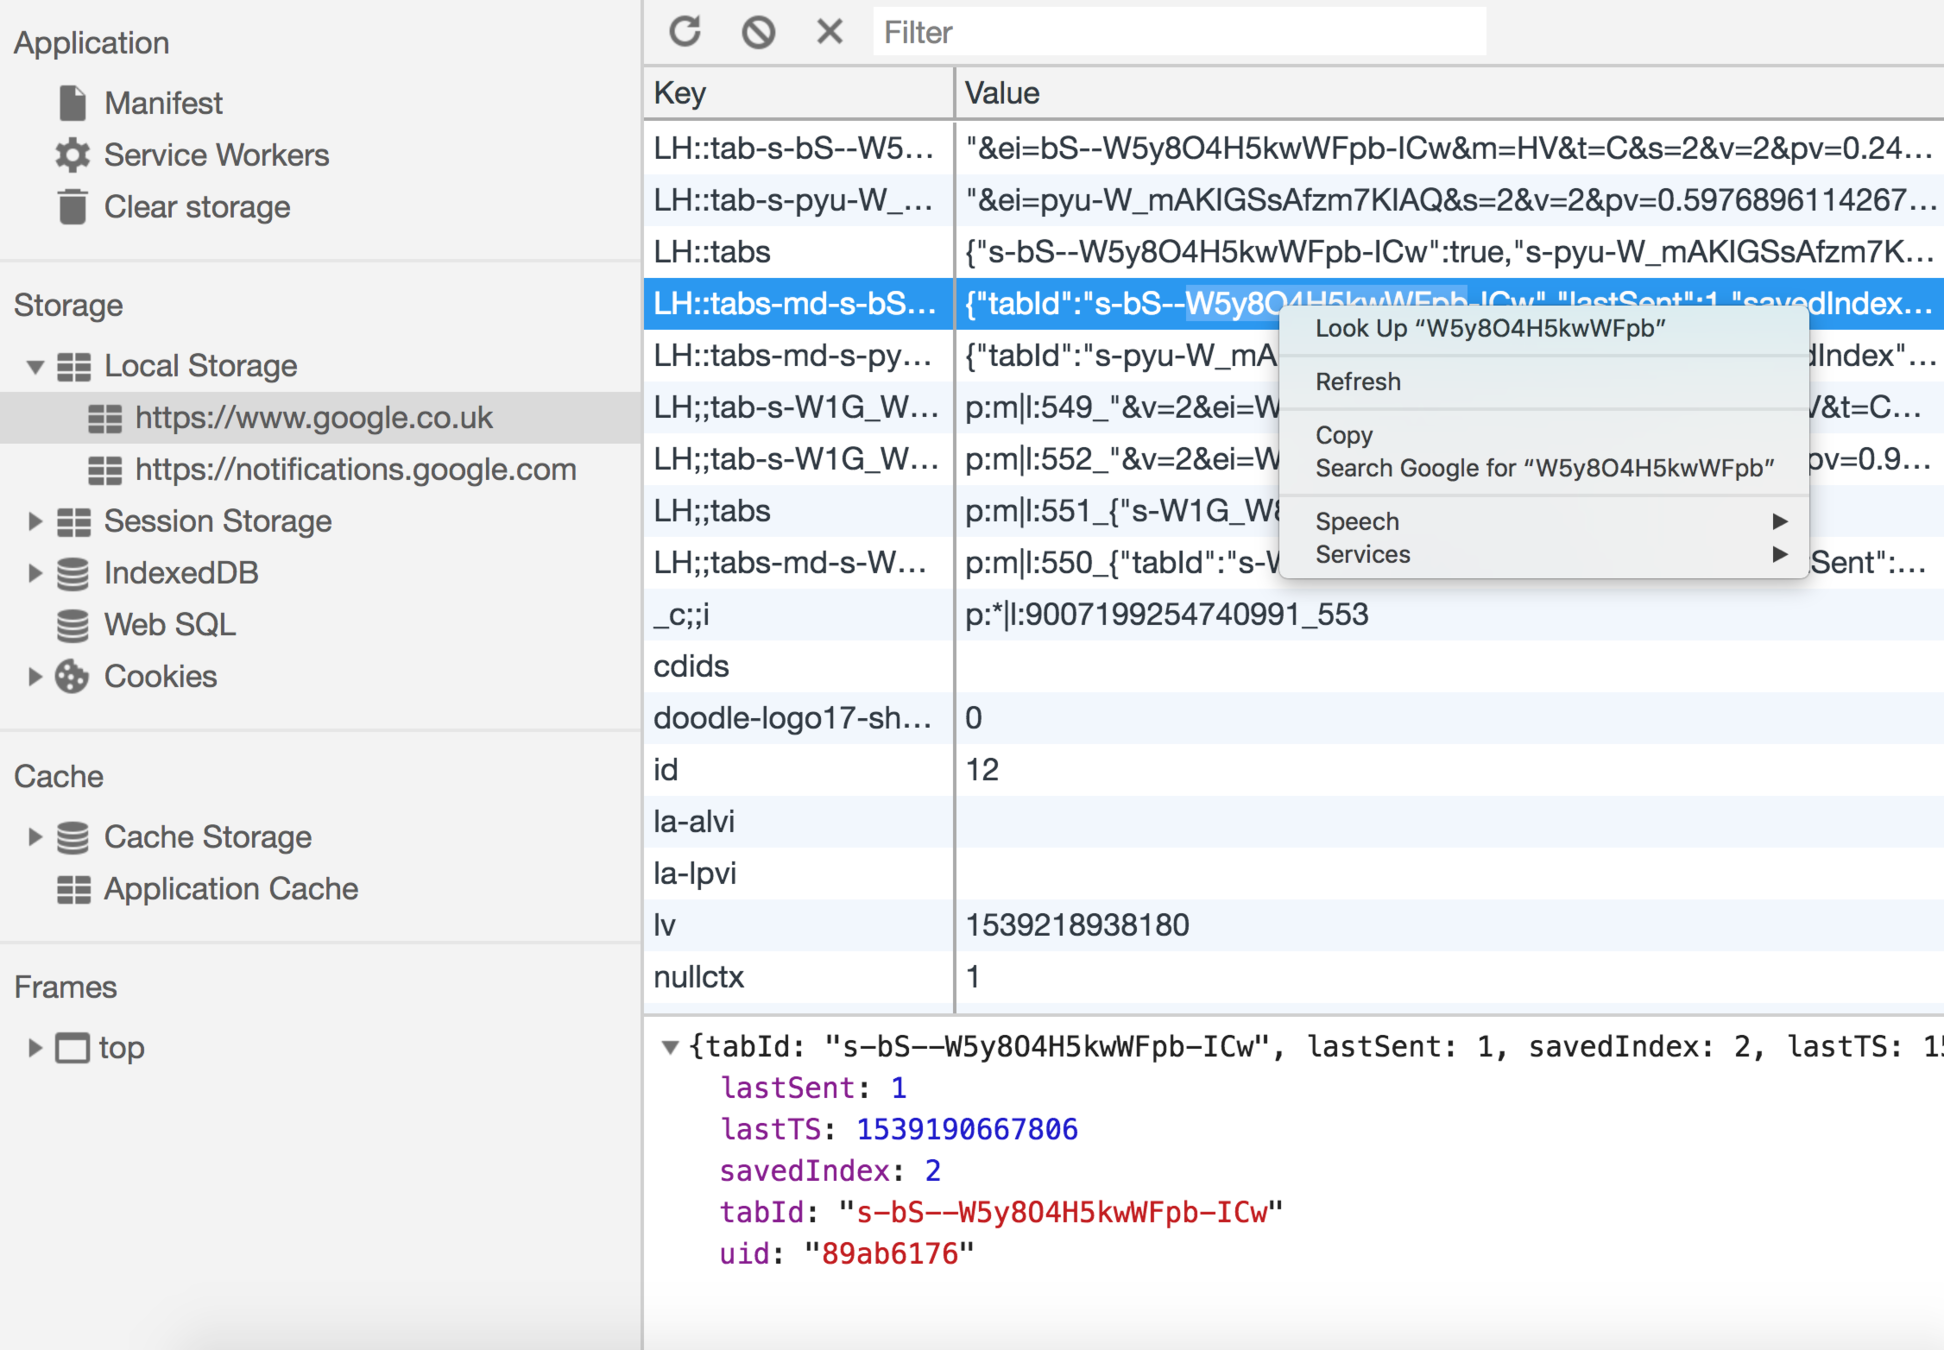
The Application tab shows the state of things like:

  • local/session storage
  • indexedb
  • service workers
  • cookies

Other Tabs

  • Profile, performance & memory
    • (They are advanced and I don't want to overload you at this stage!)
  • Plugins, like react-dev-tools, redux-tools, etc. can all get panels in your dev tools

JavaScript Debugging

By James Sherry

JavaScript Debugging

Via developer tools

  • 999