Findings from the Travel and Places Survey (Wave 1)

Johara Meyer
Research Associate
University of Westminster
J.Meyer@westminster.ac.uk
Dr Jamie Furlong
Research Fellow
University of Westminster
J.Furlong@westminster.ac.uk
The Travel and Places Survey (Wave 1)
Key information (1)
- June-July 2022
- Second wave of longitudinal study with 4,912 responses (baseline: 12,449)
- Survey completed online using Qualtrics software
- Questions on: past-week travel behaviour, local area perceptions, attitudes to TfL/LA funding
- Demographic and household characteristics (e.g. age, gender, ethnicity, car ownership)
- Postcode data allows identification of spatial variables e.g. connectedness to LTNs
Ensuring complete and representative data
Key information (2)
-
Generally, non-response in key variables was under 10%. We dealt with missing data in 2 stages:
- Unrepresentativeness in the wave 1 sample was dealt by creating weights based on demography and LTN awareness
-
Matched baseline to wave1 and wave 1 to baseline
-
Imputation based on individual and area-level sociodemographic characteristics
| Before matching missing with completed baseline responses | After matching missing with completed baseline responses | |
|---|---|---|
| Age | 9.3% | 0.2% |
| Household Income | 26.3% | 14.1% |
| Long Term Illness | 9.2% | 0% |
Key research questions
- Have there been any notable changes in past-week walking, cycling, and car use between baseline and wave 1? Are there any differences amongst demographic groups?
-
Can we find any notable changes in local area perceptions between baseline and wave 1?
-
To what extent do local environment perceptions and attitudes to TfL support for travel modes differ from the baseline?
Section 1: Comparing baseline (2021) with wave 1 (2022)
-
To what extent is there an association between living in a more/less connected area to an LTN and travel behaviour at baseline and at wave 1?
-
Can we find evidence that being more connected to an LTN at baseline is associated with a change in travel behaviour between baseline and wave 1?
-
To what extent is there evidence of new LTNs impacting upon past-week travel behaviour?
-
To what extent does moving into a more/less LTN-connected area lead to any travel behaviour change?
Section 2: The impacts of LTNs on travel behaviour
Methodology: LTN Connectedness
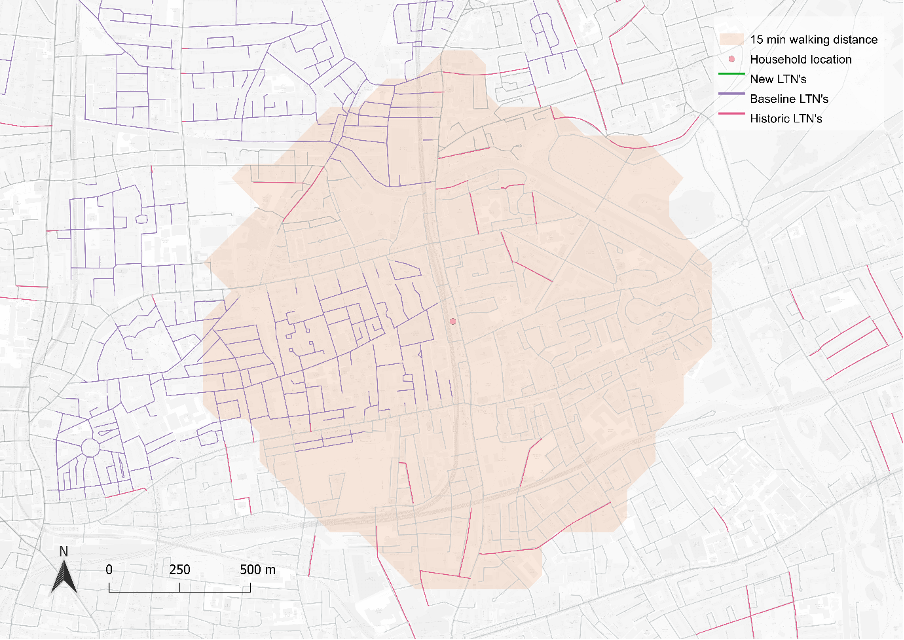
24.1% Baseline LTNs
6.2% Historic LTNs
0% New LTNs
Methodology: Connectedness classification
| Baseline LTNs (March 2020-June 2021) | New LTNs (July 2021-June 2022) |
Wave 1 LTNs (Baseline plus New LTNs) | Historic LTNs (pre-March 2020) |
|
|---|---|---|---|---|
| Cut-off | N= 4322 | N= 4322 | N= 4322 | N= 4322 |
| <5% of roads within LTN | 3288 | 4292 | 3285 | 2353 |
| 5-15% of roads within LTN | 393 | 30 | 379 | 1391 |
| 15-30% of roads within LTN | 369 | 0 | 385 | 478 |
| 30-45% of roads within LTN | 178 | 0 | 178 | 91 |
| 45-60% of roads within LTN | 70 | 0 | 71 | 9 |
| >60% of roads within LTN | 24 | 0 | 24 | 0 |
| Connectedness to LTN classification | Cut-off | Respondent count (wave 1 LTNs) | Respondent count (baseline LTNs) |
|---|---|---|---|
| Low | <15% of roads in LTNs | 3664 | 3681 |
| Medium | 15-30% of roads in LTNs | 385 | 369 |
| High | >30% of roads in LTNs | 273 | 272 |
| Connectedness to LTN classification | Cut-off | Respondent count (new LTNs) |
|---|---|---|
| Low | 0% of roads within new LTN | 4224 |
| High | >0% of roads within new LTN | 96 |
The classification used in analysis of Wave 1 and Baseline LTNs
The classification used in analysis of New LTNs
The wave 1 sample by percentage of roads within LTN by LTN type
Comparing Baseline with Wave 1:
Past week cycling, walking, car use
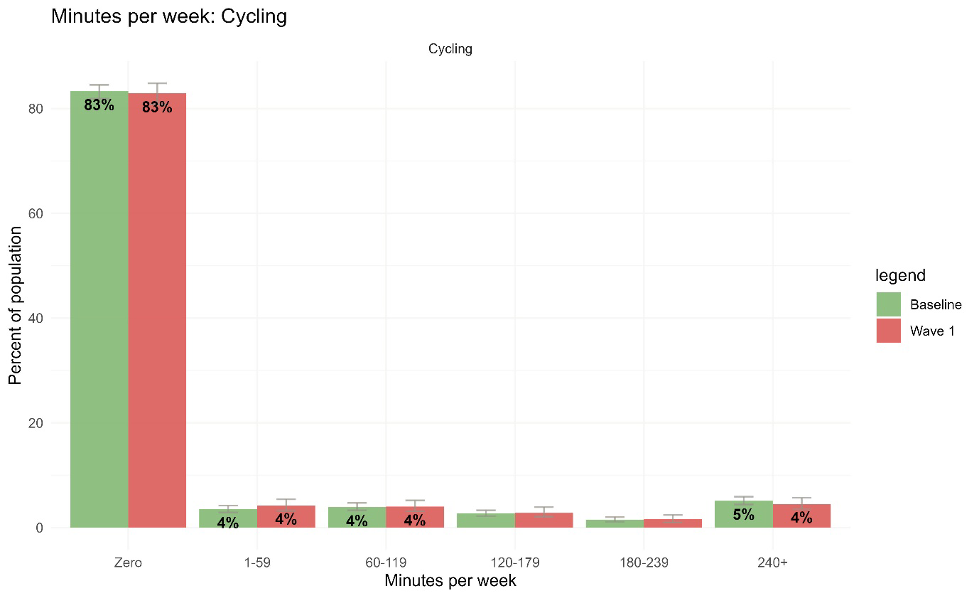
- most of the wave 1 and baseline sample does little cycling
- cycling behaviour largely remained largely unchanged
- only increased among Black or Black British and Mixed respondents
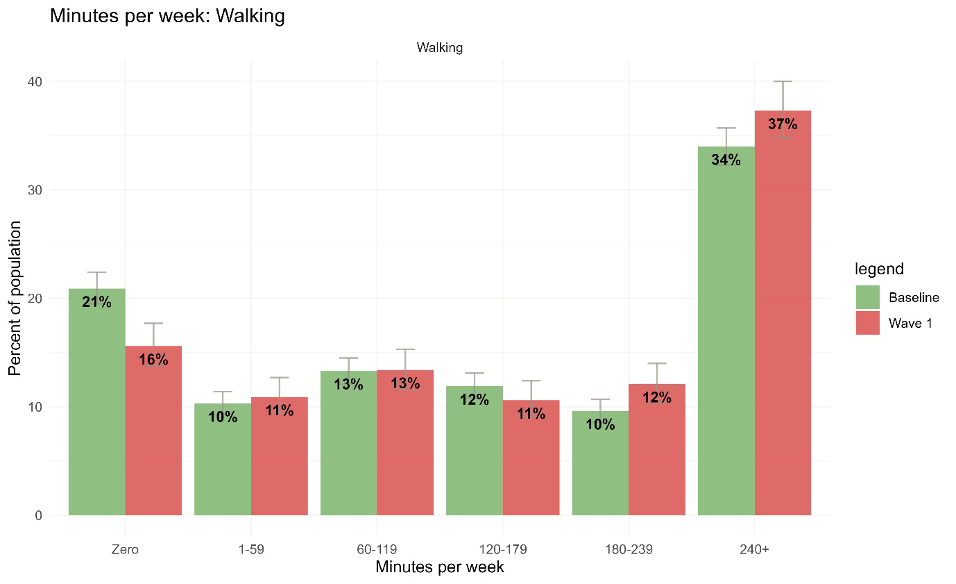
RQ1: Is there a detectable change in past-week travel behaviour between baseline and wave 1?
RQ2: Is there a detectable change in demographic predictors of past-week travel behaviour between baseline and wave 1?
- we can see a small increase in past-week walking
- 5 percentage point decrease in respondents who reported to have done no walking
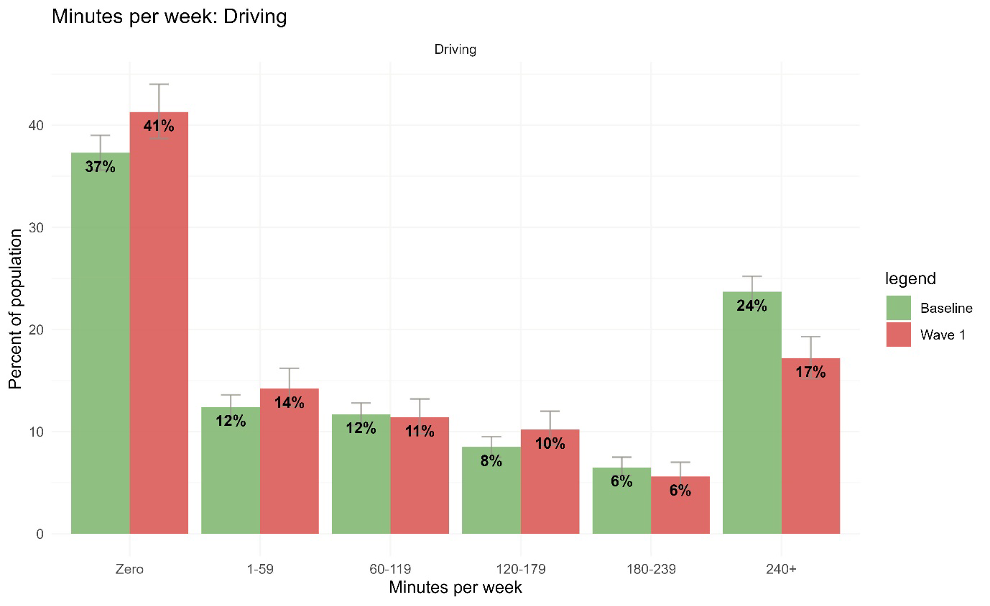
- we can see a small decrease in past-week car use
- increase from 37% to 41% in respondents who did not use a car and those using a car over 240 minutes reduced by 7%
| No evidence |
Limited evidence |
Some evidence | Clear evidence | |
|---|---|---|---|---|
| Change in minutes cycled |
x | |||
| Change in minutes walked | increase | |||
| Change in minutes of car use |
decrease |
RQ1: Is there a detectable change in past-week travel behaviour between baseline and wave 1?
RQ2: Is there a detectable change in demographic predictors of past-week travel behaviour between baseline and wave 1?
| Change in cycling among Black or Black British & Mixed respondents | increase | |||
|---|---|---|---|---|
| Change in other predictors | x |
Comparing Baseline with Wave 1:
Perceptions of local environment
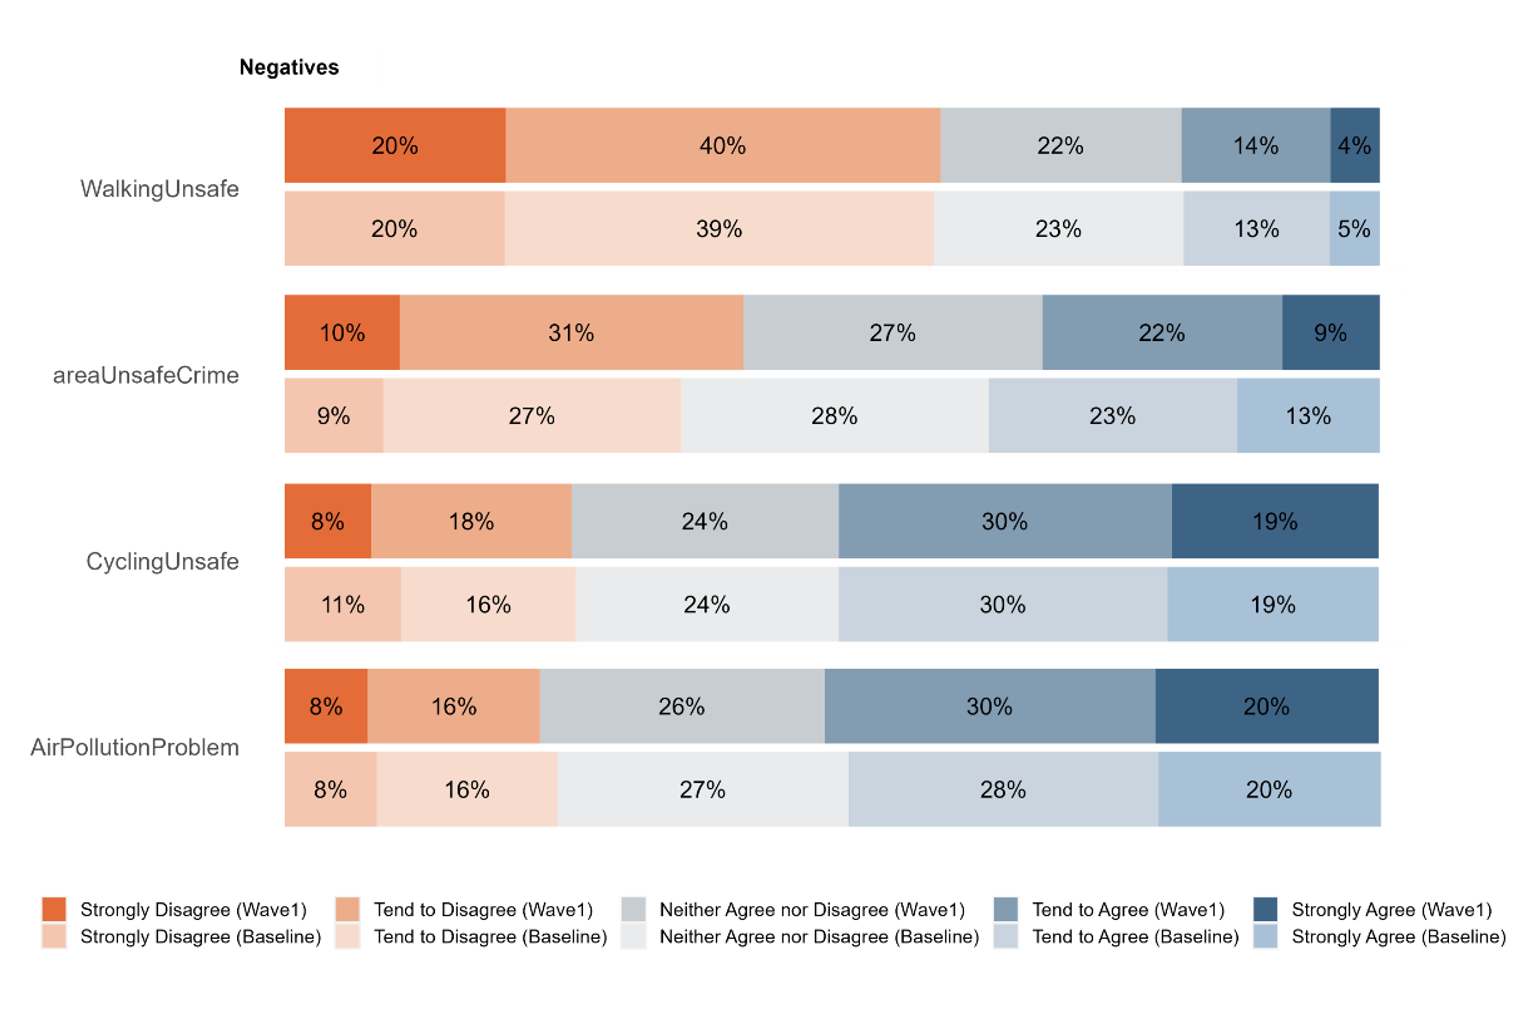
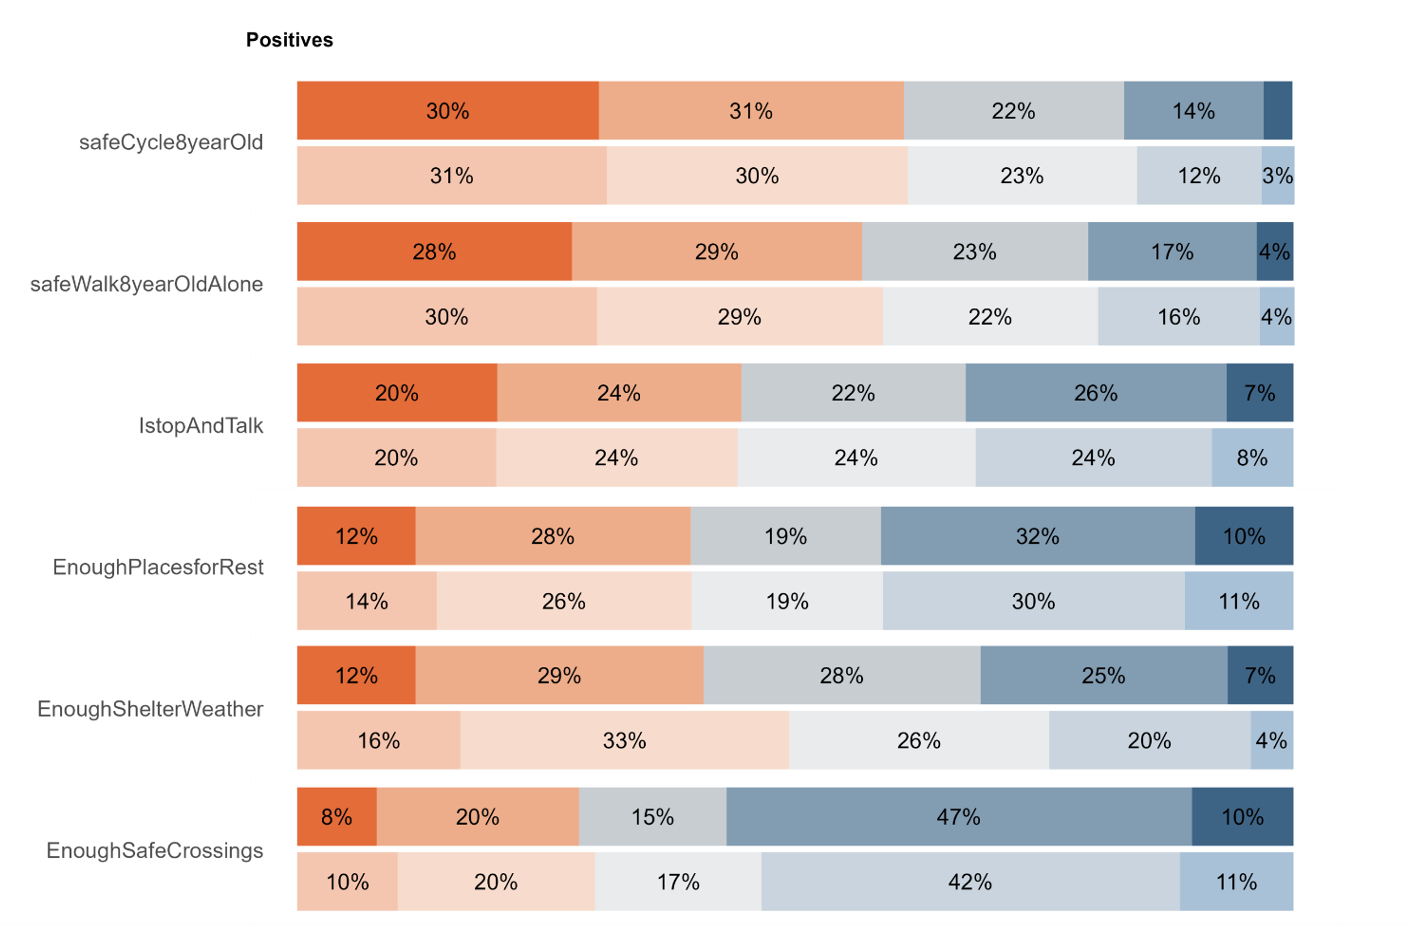
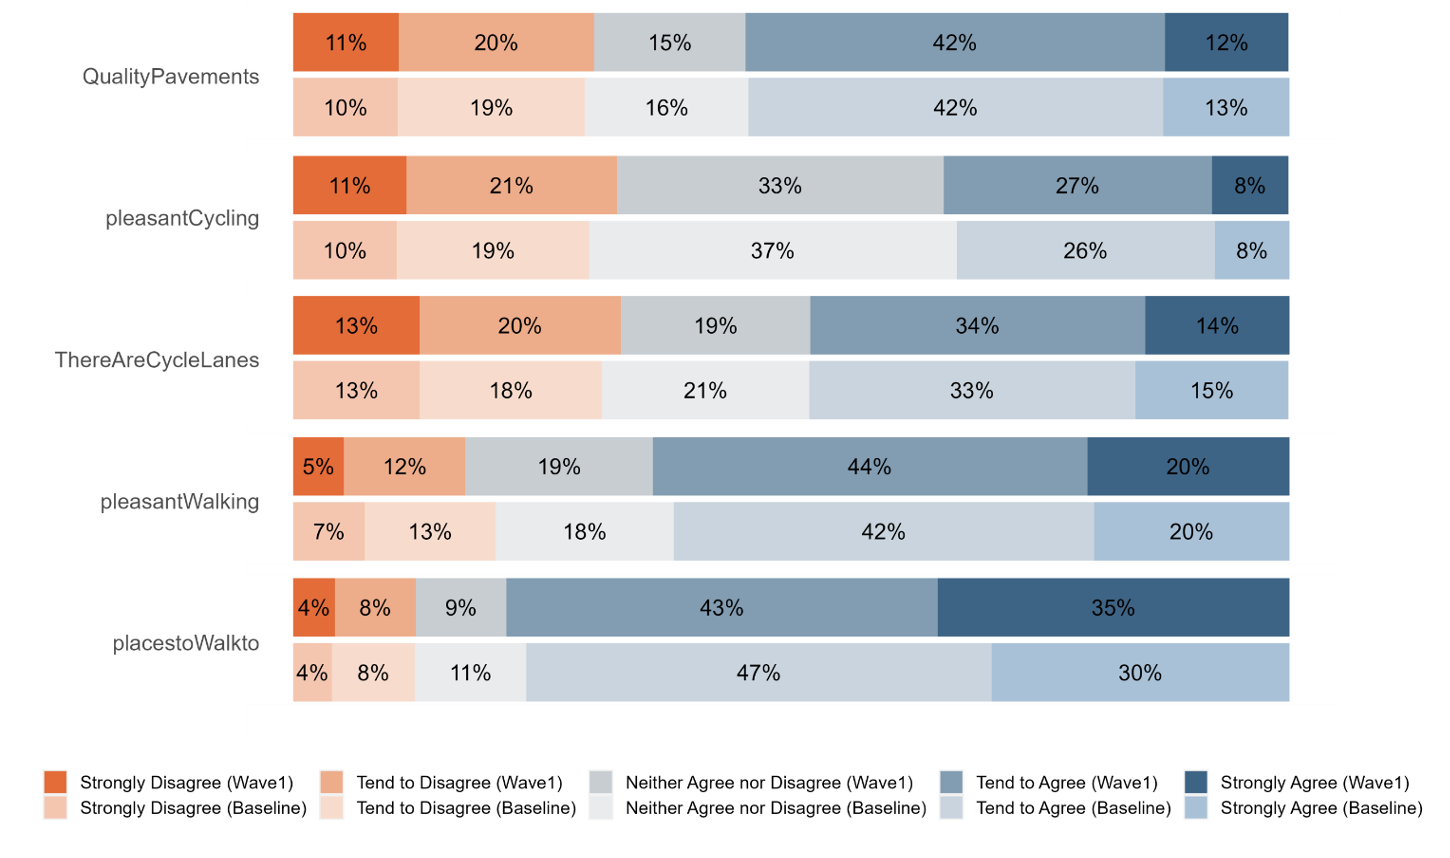
RQ1: Is there a detectable change in perceptions of the local environment between baseline and wave 1.
| No evidence |
Limited evidence |
Some evidence | Clear evidence | |
|---|---|---|---|---|
| Change in perceptions overall | x | |||
| Change in local area is pleasant for walking | increase | |||
| Change in local area has enough place to rest and shelter |
increase |
RQ1: Is there a detectable change in perceptions of the local environment between baseline and wave 1.
5.1 point increase in respondents agreeing
Comparing Baseline with Wave 1:
Attitudes towards TfL & Local Authority funding
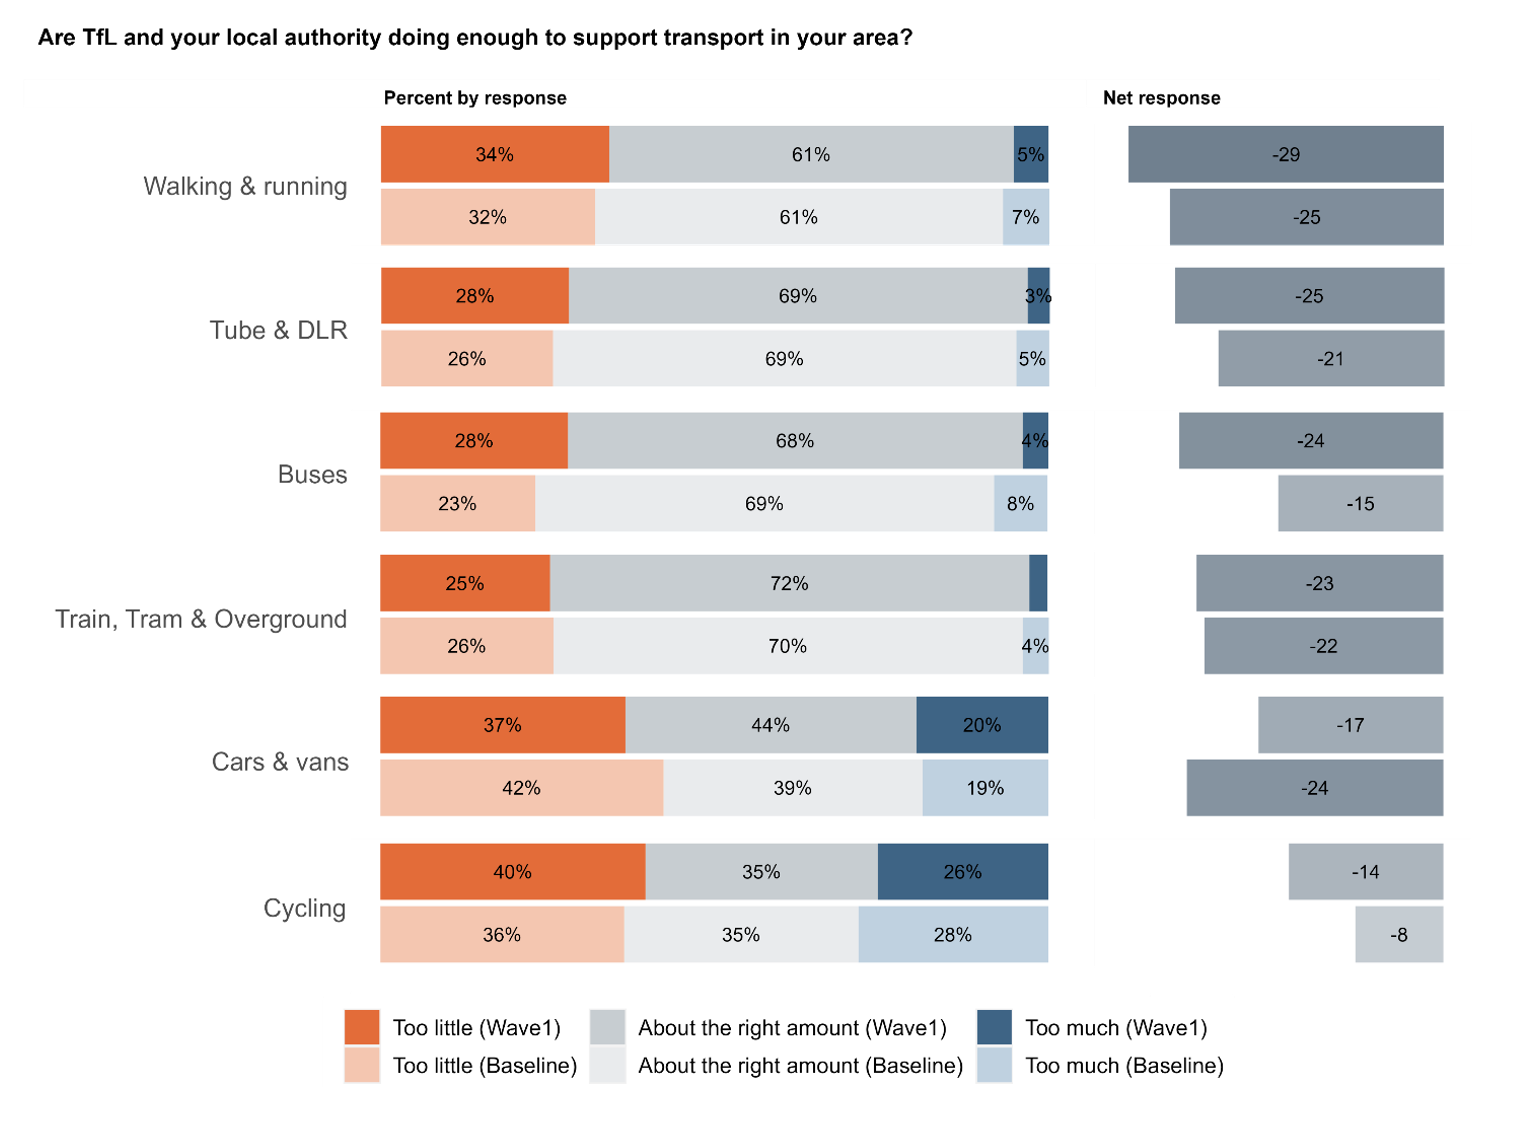
RQ1: Is there a detectable change in attitudes towards TfL and local authority funding for different transport modes between baseline and wave 1.
| No evidence |
Limited evidence |
Some evidence | Clear evidence | |
|---|---|---|---|---|
| Change in desire for funding for cycling | increase | |||
| Change in desire for funding for buses | increase | |||
| Change in desire for funding for cars & vans |
decrease |
|||
| Change in desire for funding for walking & running, Tube & DLR, Train, Tram, Overground | increase |
RQ1: Is there a detectable change in attitudes towards TfL and local authority funding between baseline and wave 1.
The impacts of LTNs on travel behaviour:
Connectedness to Wave 1 and Baseline LTNs
RQ1: To what extent is there an association between living in a more/less connected area to LTNs and travel behaviour at baseline and at wave 1?
| No evidence |
Limited evidence |
Some evidence | Clear evidence | |
|---|---|---|---|---|
| Association with number of minutes cycled | higher | |||
| Association with likelihood of ANY cycling | higher | |||
| Association with number of minutes walked | x |
|
||
| Association with likelihood of ANY walking | x | |||
| Association with number of minutes of car use | lower | |||
| Association with likelihood of ANY car use | lower |
RQ1: To what extent is there an association between living in an an area connected to LTNs and travel behaviour at baseline and at wave 1?
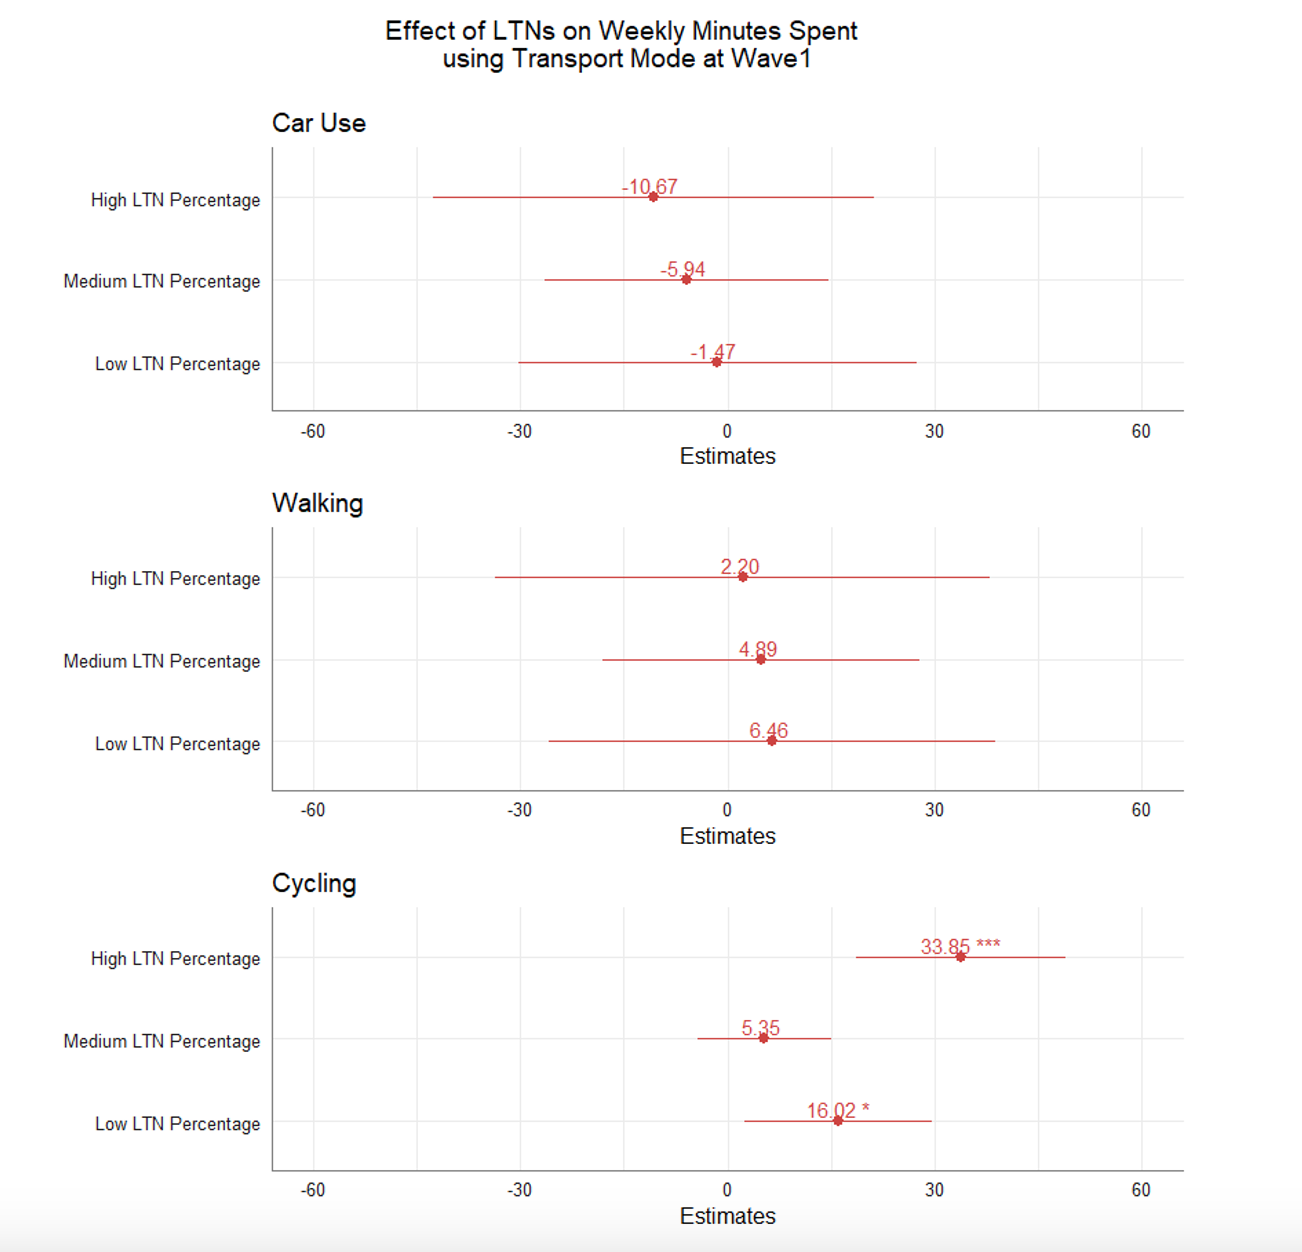
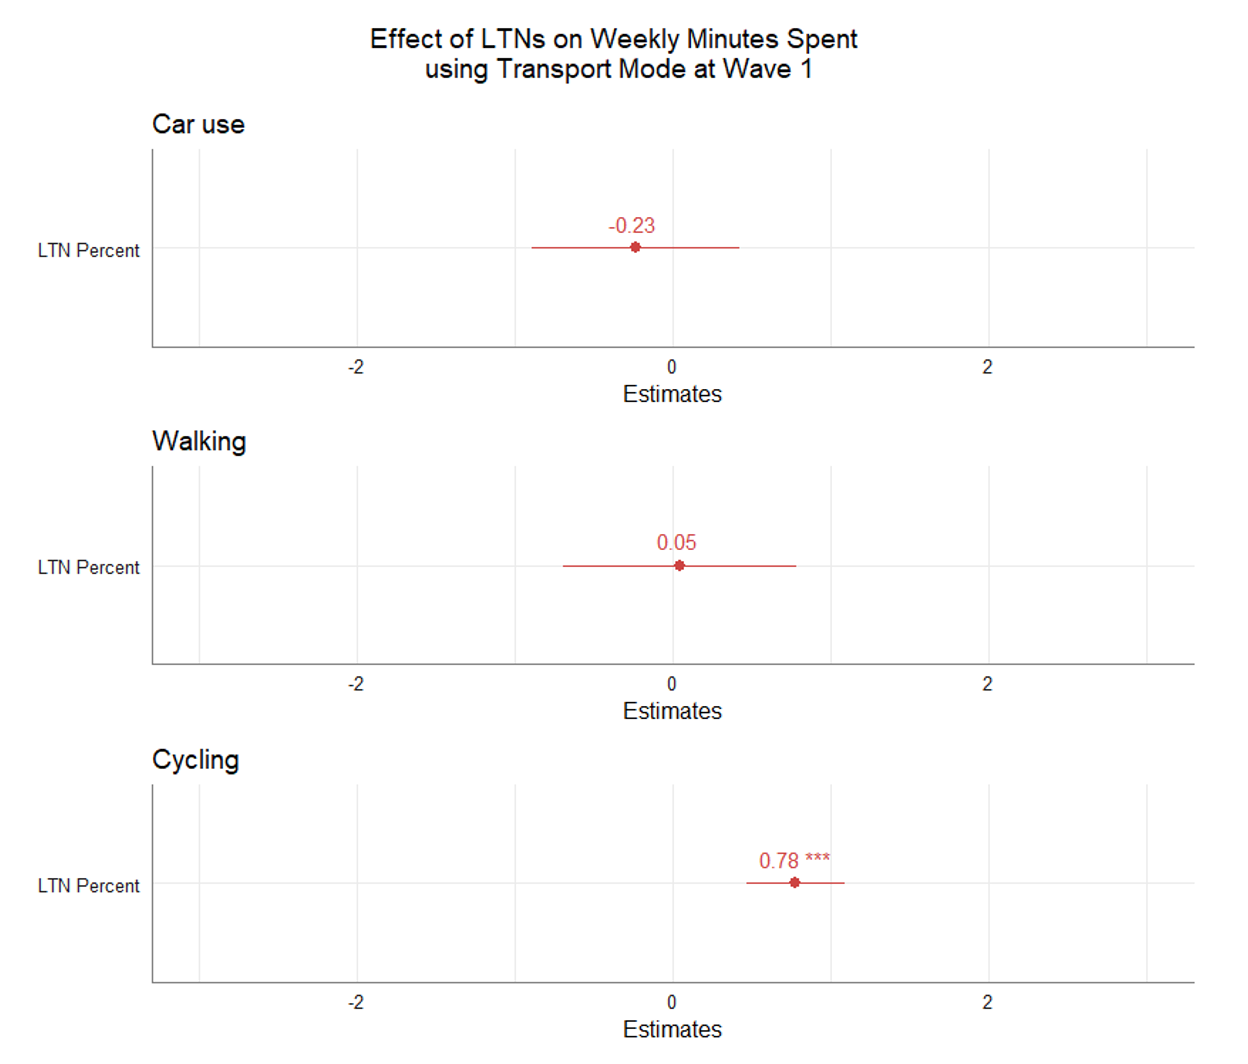
- for every 10% increase in the proportion of roads within 15 minutes that fall within an LTN, there is a significant mean 7.8 minutes per week increase in cycling
- living in an area of High LTN connectedness is associated with a mean 33.85 minutes per week increase in cycling compared to being in an area with zero LTN connectedness
- direction of all relationships is as we would expect but car use and walking are not statistically significant
RQ2: To what extent can we find evidence that being in an LTN at baseline is associated with a change in travel behaviour between baseline and wave 1?
The impacts of LTNs on travel behaviour:
Connectedness to Wave 1 and Baseline LTNs
- there is no evidence that being more connected to an LTN area at baseline is associated with any change in time spent walking, cycling, or using a car between baseline and wave 1
| No evidence |
Limited evidence |
Clear evidence |
|
|---|---|---|---|
| Change in minutes cycled |
x | ||
| Change in minutes walked | x | ||
| Change in minutes of car use |
x |
RQ2: To what extent can we find evidence that being in an LTN at baseline is associated with a change in travel behaviour between baseline and wave 1?
The impacts of LTNs on travel behaviour:
Connectedness to New LTNs
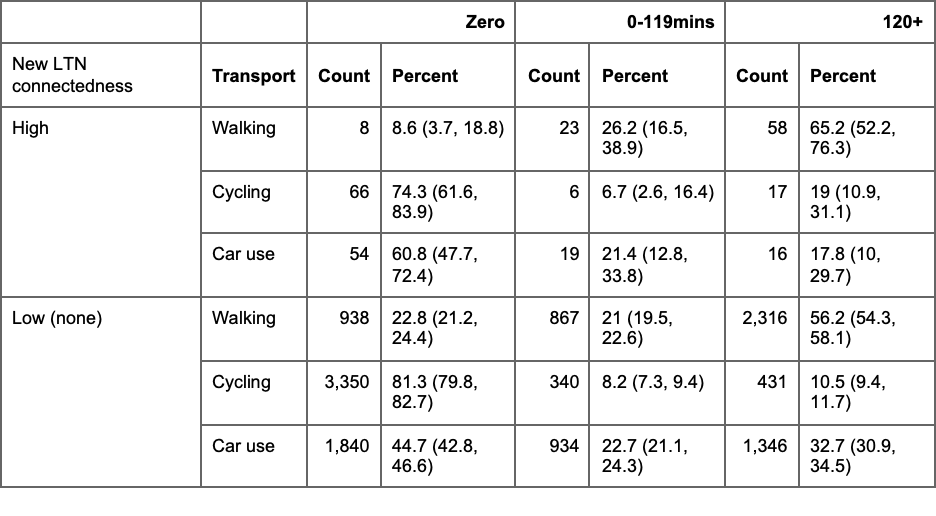
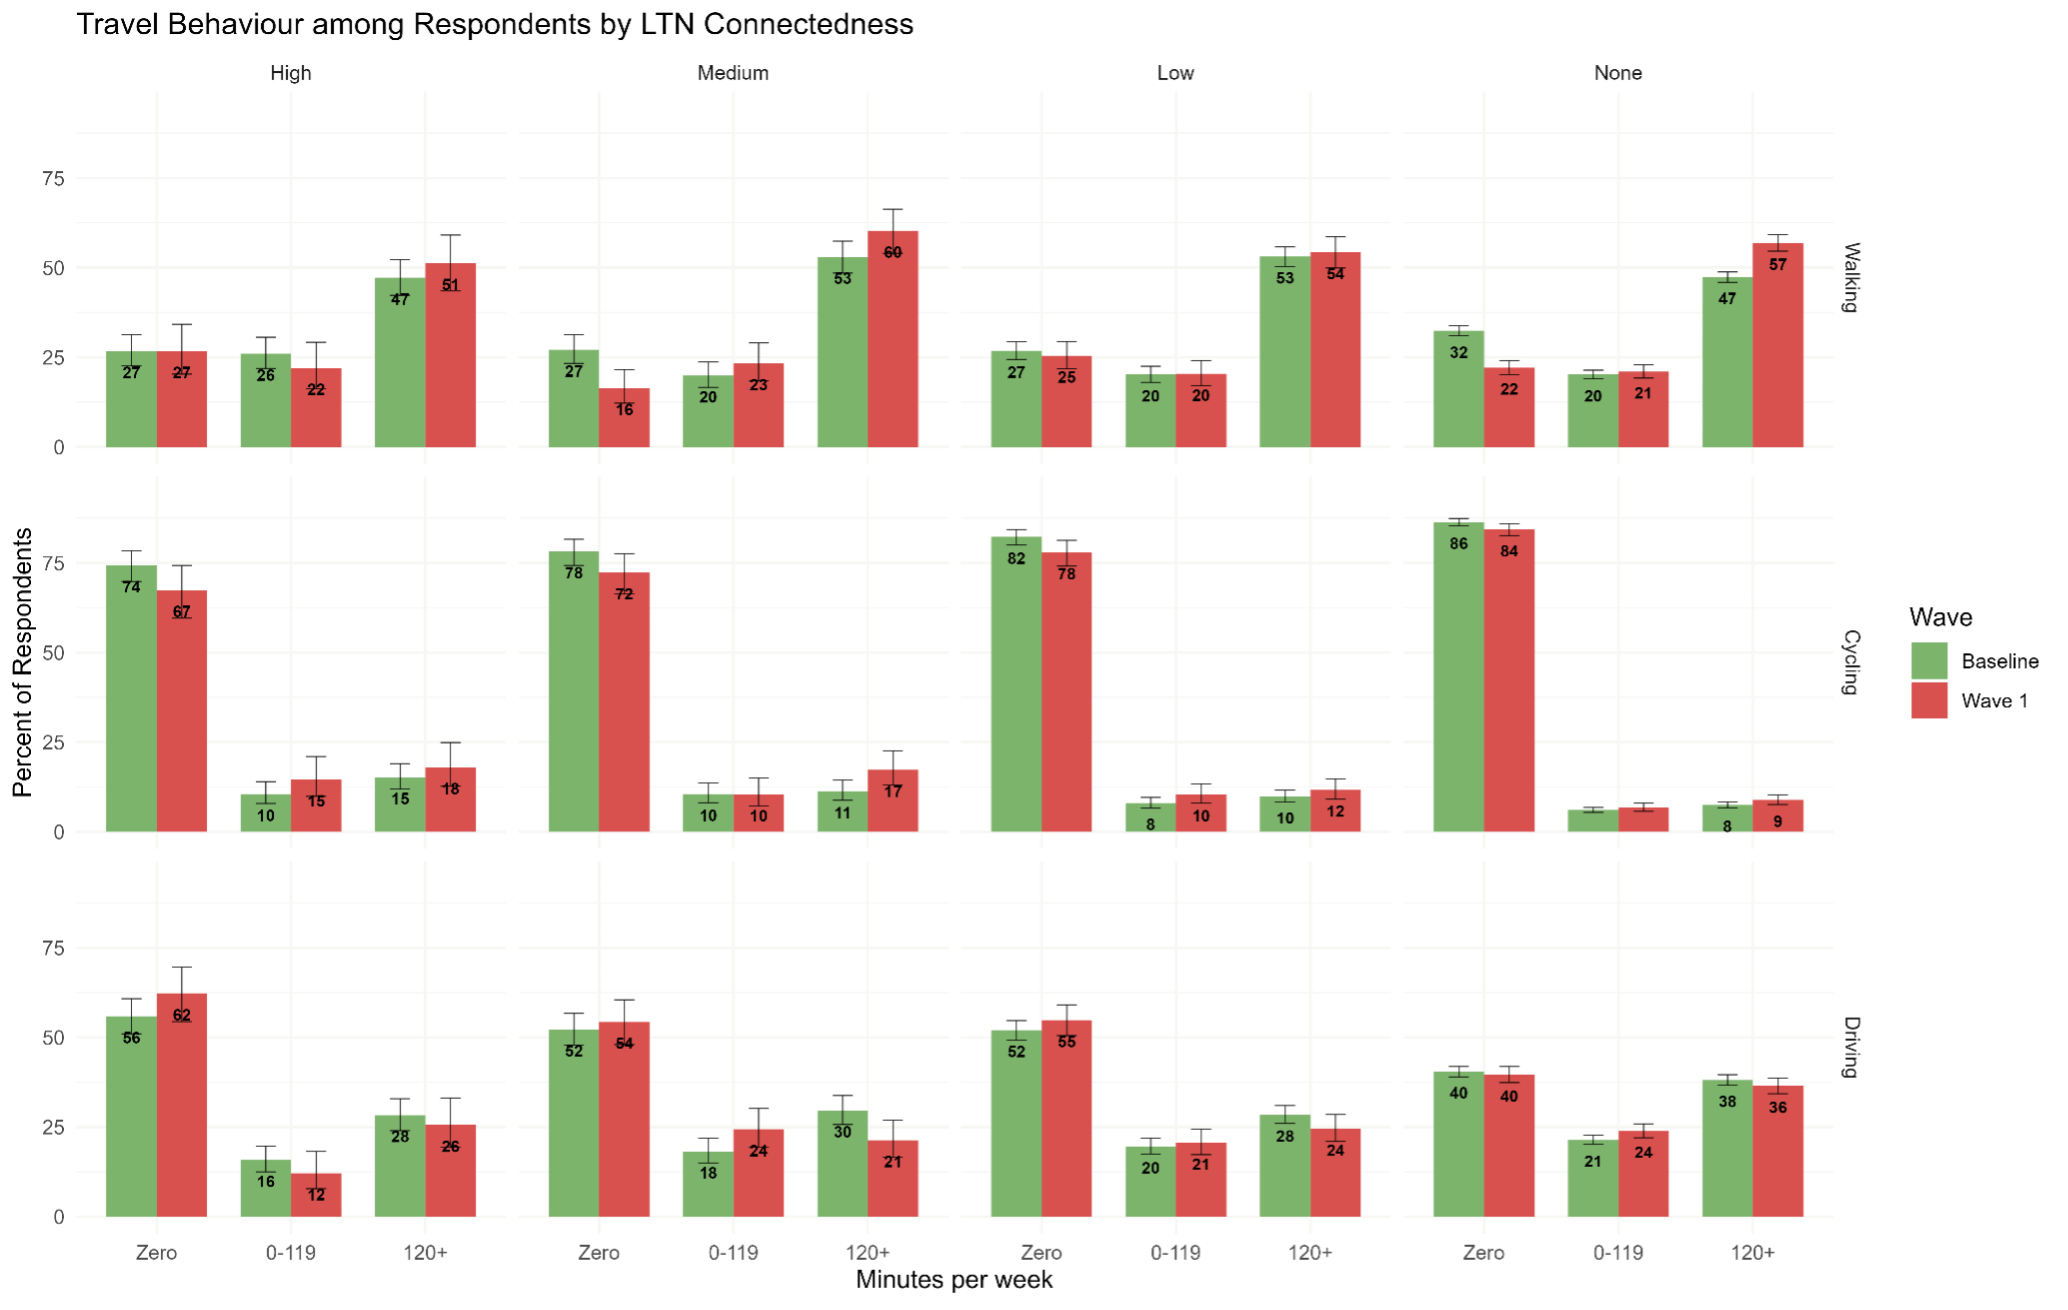
Cycling:
There is no evidence that being more connected to a new LTN is associated with more cycling or any cycling
Car use
Compared to those with no connectedness, a lower proportion of respondents with High connectedness reported car use over 120 minutes and higher proportion reported not driving at all in the past week
Walking:
A lower proportion of respondents living with High connectedness to new LTNs reported no past week walking.
RQ1: To what extent is there an association between living in an an area connected to new LTNs and travel behaviour at wave 1?
| No evidence |
Limited evidence |
Clear evidence | |
|---|---|---|---|
| Association with number of minutes cycled | x | ||
| Association with likelihood of ANY cycling | x | ||
| Association with number of minutes walked | x | ||
| Association with likelihood of ANY walking | higher | ||
| Association with number of minutes of car use | lower | ||
| Association with likelihood of ANY car use | lower |
RQ1: To what extent is there an association between living in an an area connected to new LTNs and travel behaviour at wave 1?
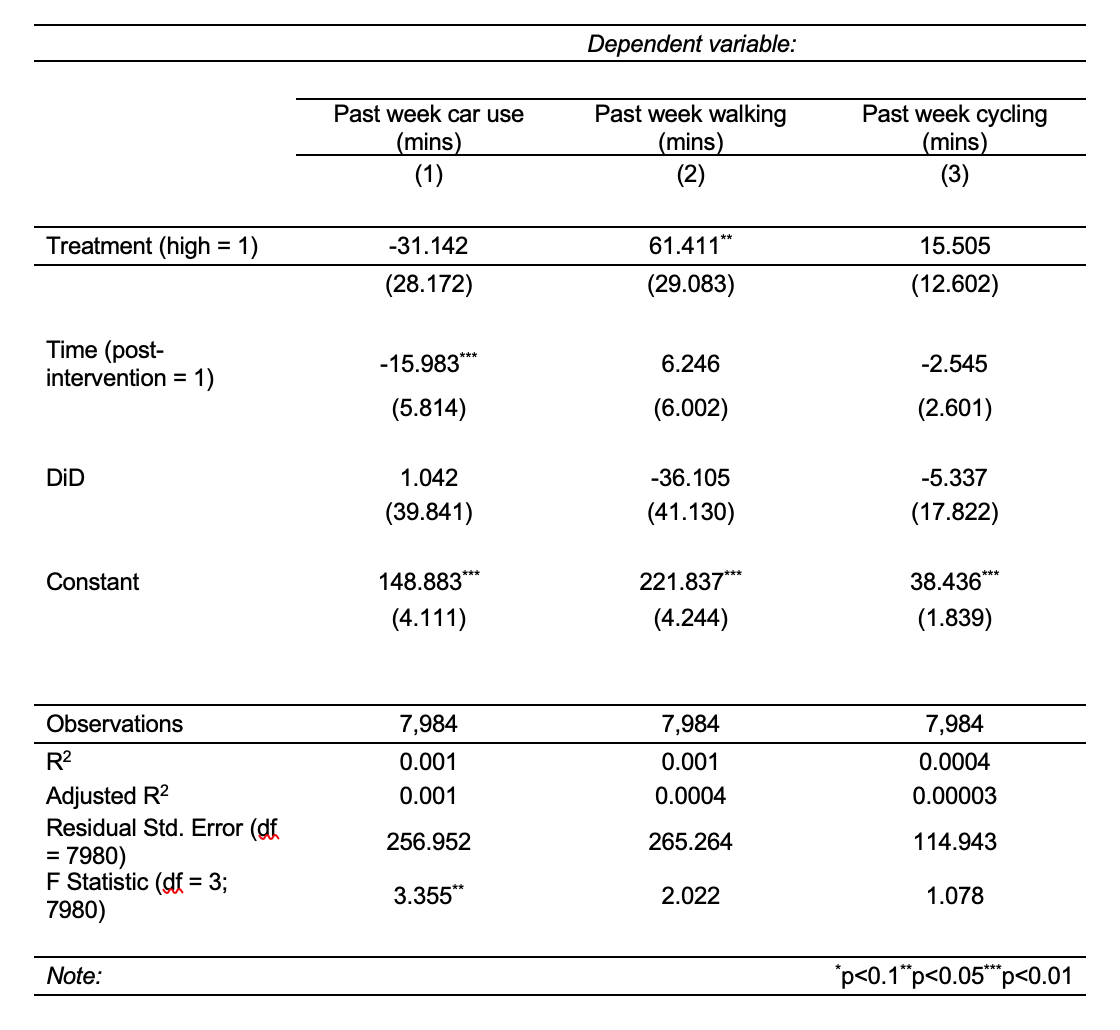
The impacts of LTNs on travel behaviour:
Connectedness to New LTNs
RQ1: To what extent can an we find evidence that becoming connected to a new LTN is associated with a change in travel behaviour between baseline and wave 1?
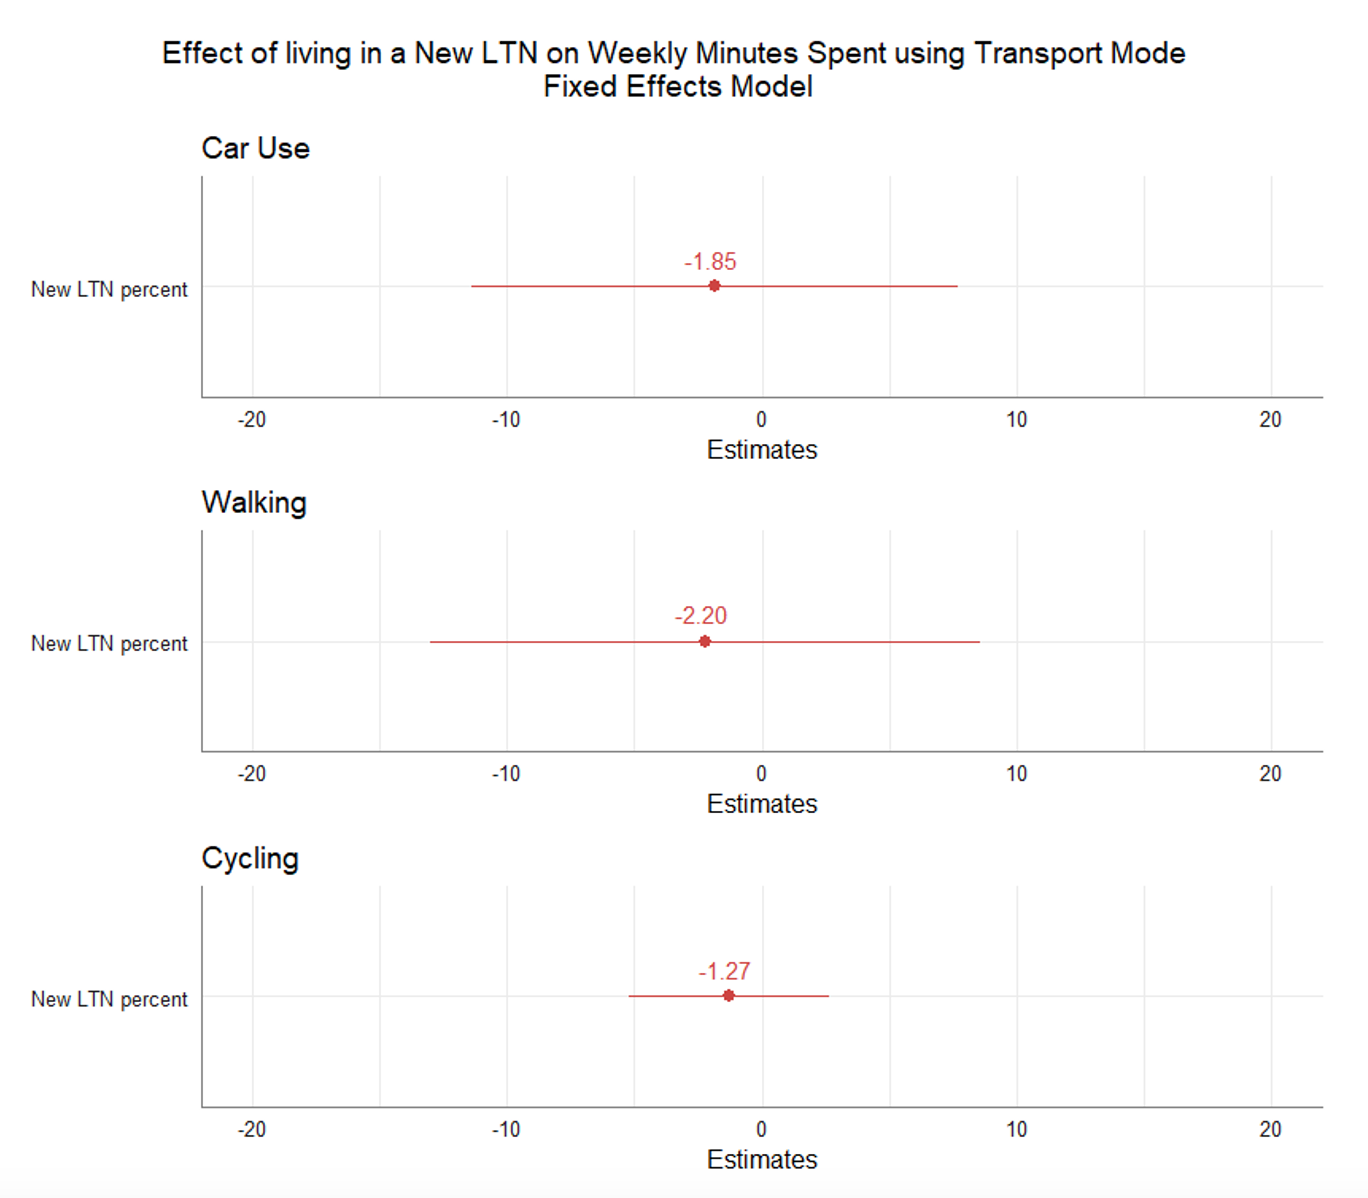
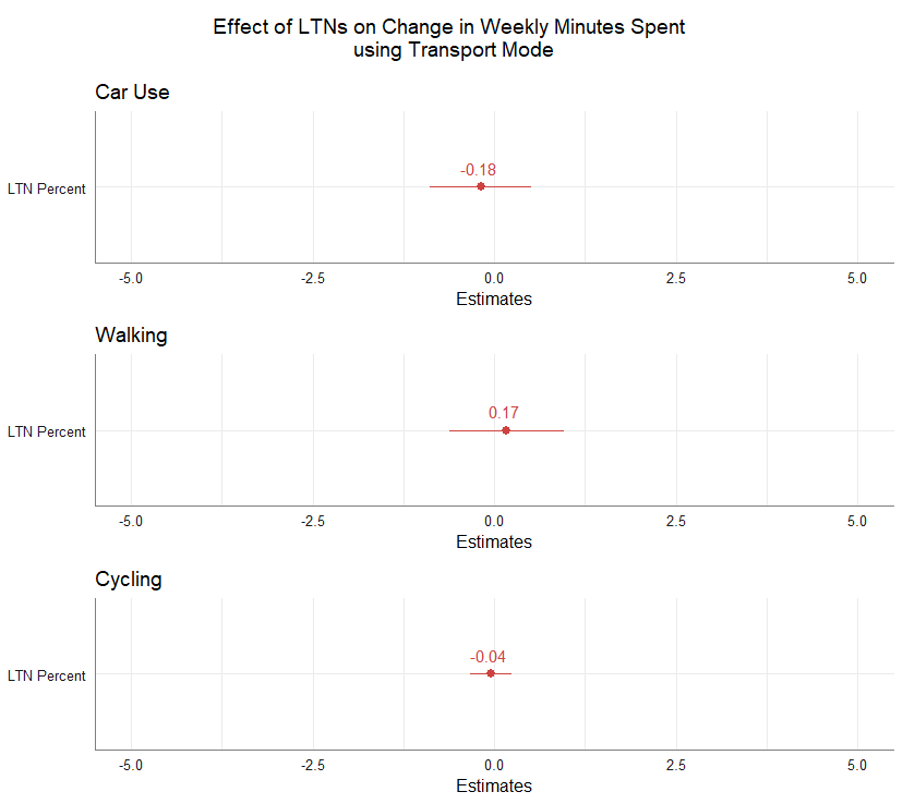
- conducted both a difference-in-differences and fixed effects analysis
- in both models, there are no discernible statistically significant effects associated with the new LTNs yet
- as the number of new LTNs increases, we anticipate greater statistical power to determine possible effects on behaviour change
| No evidence |
Limited evidence |
Clear evidence |
|
|---|---|---|---|
| Change in minutes cycled |
x | ||
| Change in minutes walked | x | ||
| Change in minutes of car use |
x |
RQ2: To what extent can we find evidence that becoming connected to a new LTN is associated with a change in travel behaviour between baseline and wave 1?
The impacts of LTNs on travel behaviour:
Moving into areas with more/less connectedness
Walking
- Those who moved to an area with a higher proportion of roads within an LTN, there is a small increase in mean past week walking (from 241.4 to 271.2 minutes).
- Those who moved to an area with a lower proportion of roads within an LTN, there is a small decrease in the mean and median past week walking
RQ1: To what extent is there an association between moving into a more/less LTN-connected area and travel behaviour change?
| Weighted Mean | Standard deviation | Weighted Median | Weighted Mean | Standard deviation | Weighted Median | |
|---|---|---|---|---|---|---|
| No change | 245.4 | 343.1 | 145 | 195.1 | 225.5 | 132.5 |
| Higher proportion of LTN roads | 241.4 | 272.2 | 162.5 | 271.2 | 297.1 | 165.5 |
| Lower proportion of LTN roads | 236.1 | 221.4 | 175 | 218.4 | 206.4 | 168.3 |
| Baseline (pre move) |
Wave 1 (post move) |
|---|
| No evidence |
Limited evidence |
Clear evidence | |
|---|---|---|---|
| Association with number of minutes cycled | x | ||
| Association with number of minutes walked |
|
higher/lower | |
| Association with number of minutes of car use | x |
RQ1: To what extent is there an association between moving into a more/less LTN-connected area and travel behaviour change?
The impacts of LTNs on travel behaviour:
Moving into areas with more/less connectedness
RQ1: To what extent can we find evidence that becoming more connected to LTNs after moving is associated with a change in travel behaviour between baseline and wave 1?
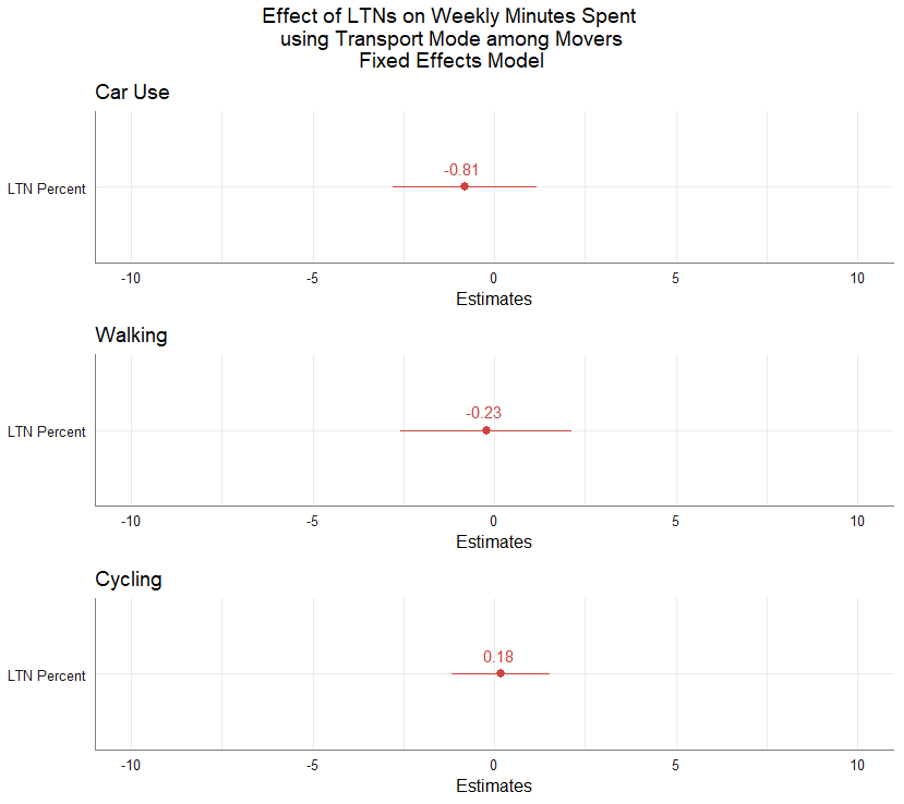
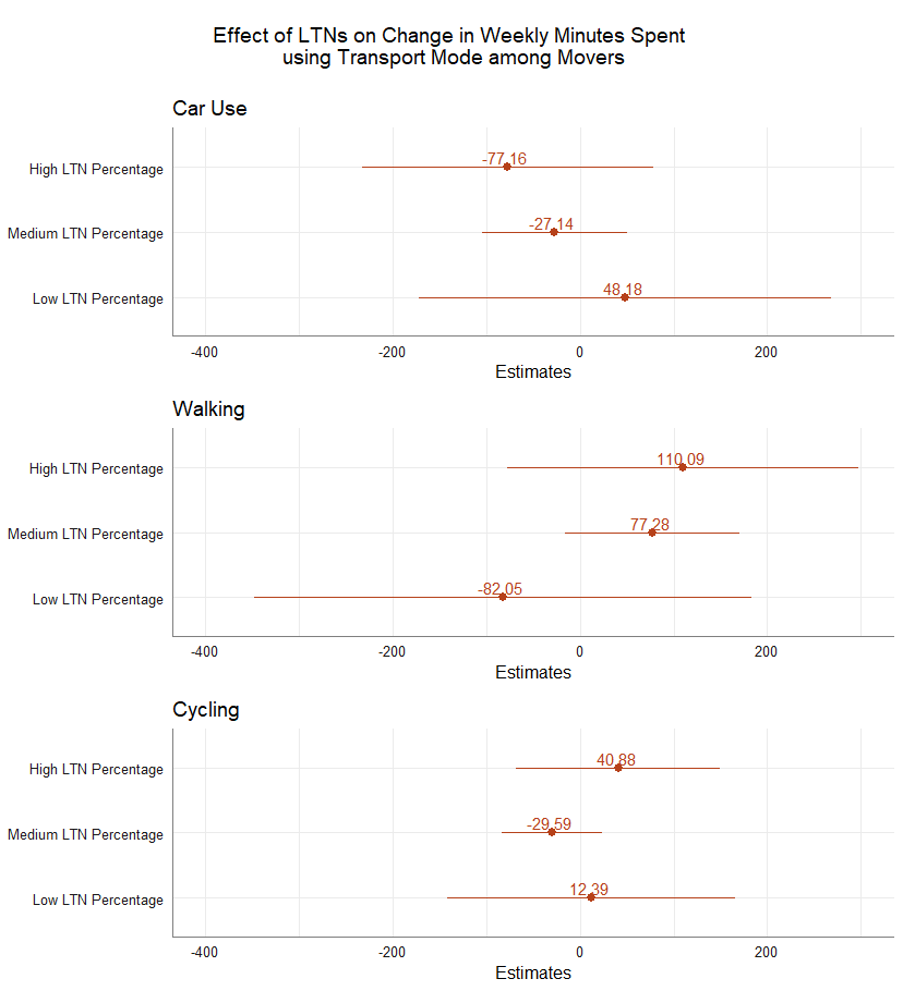
- we cannot yet identify any statistically significant past-week travel effects for movers of being in an area more or less connected to existing LTNs
- as more respondents move and more LTNs are implemented, we may have more statistical power to assess this in future waves
| No evidence |
Limited evidence |
Clear evidence | |
|---|---|---|---|
| Association with number of minutes cycled | x | ||
| Association with number of minutes walked |
x |
||
| Association with number of minutes of car use | x |
RQ2: To what extent can we find evidence that becoming more connected to LTNs after moving is associated with a change in travel behaviour between baseline and wave 1?
Key conclusions
- Travel behaviour and attitudes have changed more than we anticipated
- People that are more connected to LTNs continue to cycle more and use a car less…
-
…But we cannot show any clear effects of LTNs on behaviour change
-
No evidence does not necessarily mean no effects
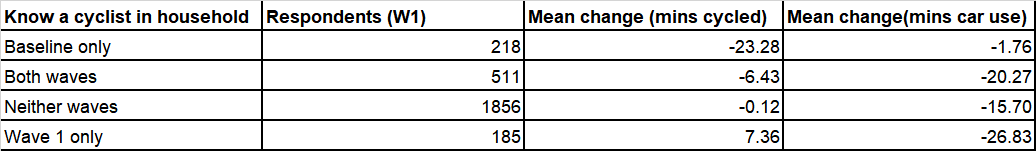
The case for and against future waves of Travel and Places (1)
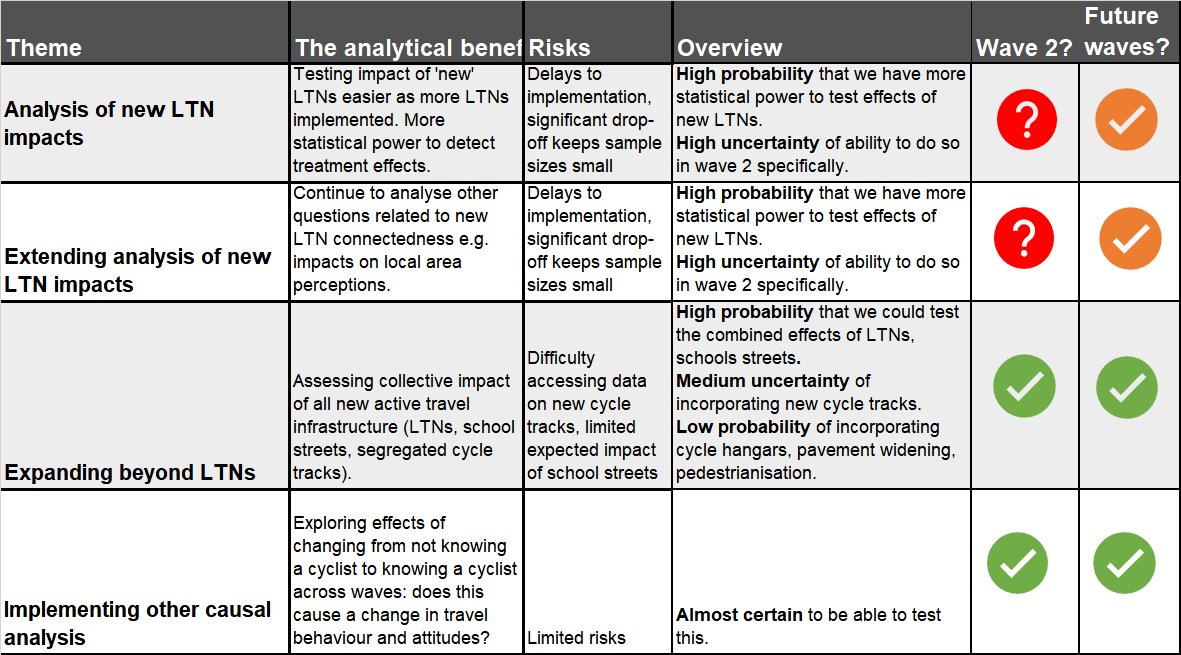
The case for and against future waves of Travel and Places (2)
deck
By joharameyer


