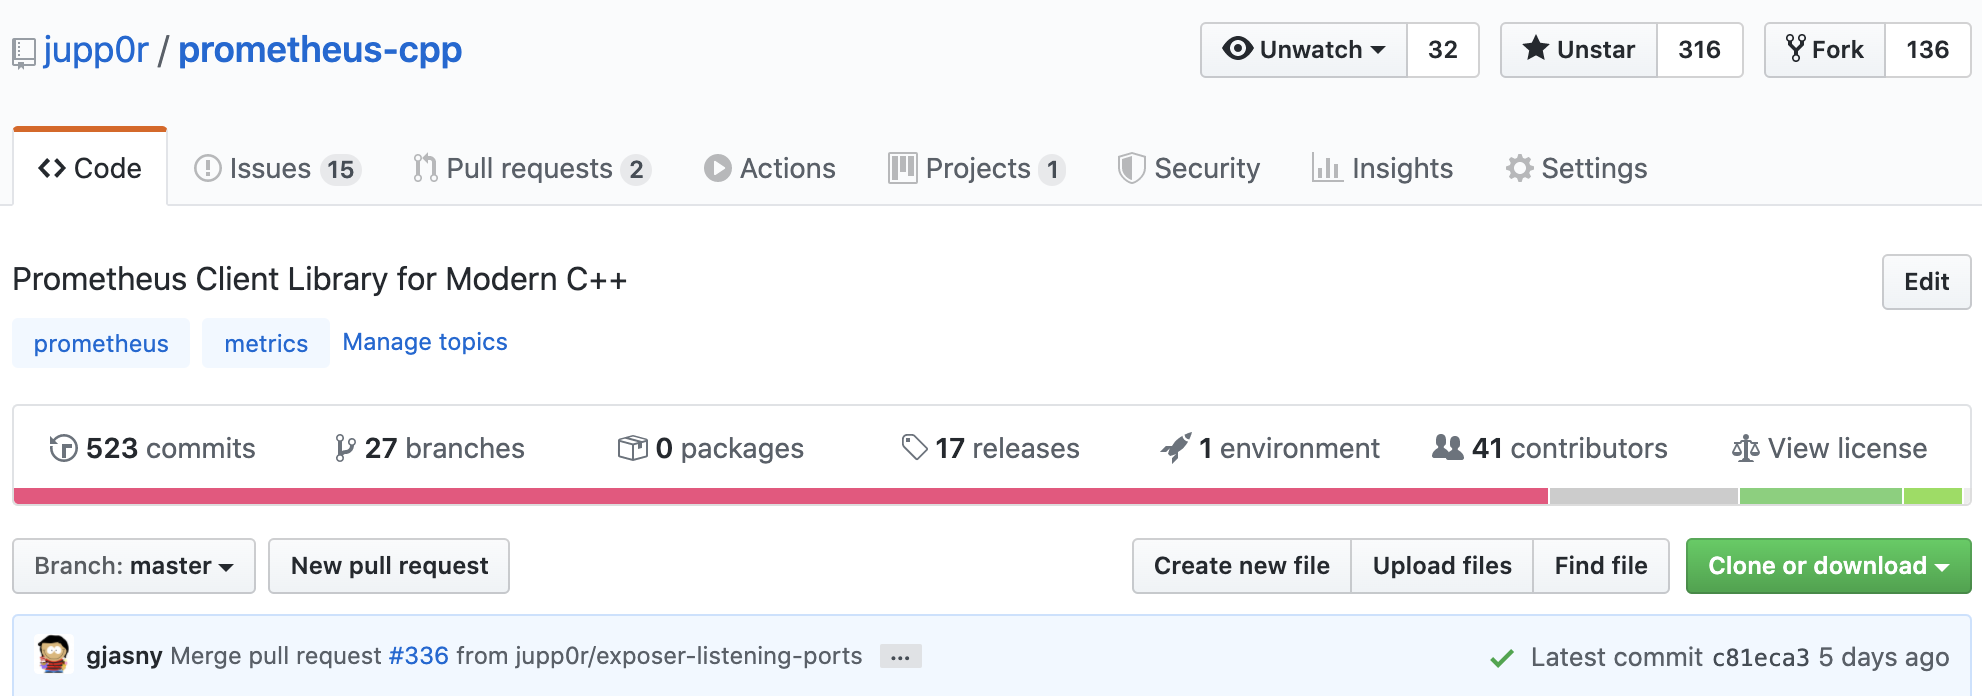
prometheus-cpp
High Performance Metrics in C++
Jupp Mueller
@jupp0r (GitHub/Twitter)
/me
- Senior Software Engineer @ LogMeIn
- worked on large scale applications for > 10 years
- I like outdoor things (climbing, surfing, hiking, trail running ...)
- I'm a keyboard nerd
- feel free to interrupt me or shout comments during the talk
Metrics
Prometheus
Server
Application
Application
Application
HTTP GET
HTTP GET
HTTP GET
Service Discovery
subscribes to
Development
- learn how your software behaves
- get hard data to make engineering decisions
- find resource leaks
- pinpoint performance bottlenecks
- ...
Operations
- monitoring
- alerting
Prometheus
- rewrite by Ex-Googlers of Googles' Borgmon monitoring system
- conists of
- client libraries
- collection service
- time series database
- alerting service
Prometheus Server
- has strong opinions on pets vs cattle
- pull-based metrics collection
- scrapes clients in configurable intervals
- integrates with modern service discovery systems / container orchestrators
- kubernetes
- consul
- etcd
- ...
Prometheus
Server
Application
Application
Application
HTTP GET
HTTP GET
HTTP GET
Service Discovery
subscribes to
Metrics
Data
Model
Everything is a time series.
Time series each have a name and a set of label pairs.
Because different label pairs yield different, independent time series we talk of label dimensions.
api_http_requests_total{method="POST",
                        handler="/messages"}
Metric
Types
Counter
- cumulative
- single value
- only ever goes up
- used to represent total number of connections, etc
Gauge
- single value
- can increase and decrease
- used to represent things like active connections, etc
Histogram
- has single observe method
- has cumulative counters for configurable observation buckets
- total sum of all observed values
- observation count
Histogram
# HELP exposer_request_latencies Latencies of serving scrape requests, in milliseconds
# TYPE exposer_request_latencies HISTOGRAM
exposer_request_latencies_bucket{le="1.000000",} 0
exposer_request_latencies_bucket{le="5.000000",} 1
exposer_request_latencies_bucket{le="10.000000",} 1
exposer_request_latencies_bucket{le="20.000000",} 1
exposer_request_latencies_bucket{le="40.000000",} 1
exposer_request_latencies_bucket{le="80.000000",} 1
exposer_request_latencies_bucket{le="160.000000",} 1
exposer_request_latencies_bucket{le="320.000000",} 1
exposer_request_latencies_bucket{le="640.000000",} 1
exposer_request_latencies_bucket{le="1280.000000",} 1
exposer_request_latencies_bucket{le="2560.000000",} 1
exposer_request_latencies_bucket{le="inf",} 1
exposer_request_latencies_sum{} 2.000000
exposer_request_latencies_count{} 1
Instrumenting Applications
Client Libraries
Prometheus
Server
Application
Application
Application
HTTP GET
HTTP GET
HTTP GET
Service Discovery
subscribes to
Go Java Scala Python Ruby Bash C++ Lisp Elixir Erlang Haskell Lua .NET Node.js PHP Rust
  // create an http server running on port 8080
  auto exposer = Exposer{"127.0.0.1:8080"};

  // create a metrics registry with component=main labels applied to all its
  // metrics
  auto registry = std::make_shared<Registry>();

  // add a new counter family to the registry (families combine values with the
  // same name, but distinct label dimenstions)
  auto& counter_family = BuildCounter()
                             .Name("time_running_seconds")
                             .Help("How many seconds is this server running?")
                             .Labels({{"label", "value"}})
                             .Register(*registry);

  // add a counter to the metric family
  auto& second_counter = counter_family.Add(
      {{"another_label", "value"}, {"yet_another_label", "value"}});

  // ask the exposer to scrape the registry on incoming scrapes
  exposer.RegisterCollectable(registry);

  for (;;) {
    std::this_thread::sleep_for(std::chrono::seconds(1));
    // increment the counter by one (second)
    second_counter.Increment();
  }
  return 0;
Performance
INFO: Running command line: bazel-bin/tests/benchmark/benchmarks
Run on (8 X 2300 MHz CPU s)
2016-10-17 15:56:49
Benchmark Time CPU Iterations
--------------------------------------------------------------------
BM_Counter_Increment 11 ns 11 ns 62947942
BM_Counter_Collect 84 ns 84 ns 8221752
BM_Gauge_Increment 11 ns 11 ns 61384663
BM_Gauge_Decrement 11 ns 11 ns 62148197
BM_Gauge_SetToCurrentTime 199 ns 198 ns 3589670
BM_Gauge_Collect 86 ns 85 ns 7469136
BM_Histogram_Observe/0 122 ns 122 ns 5839855
BM_Histogram_Observe/1 116 ns 115 ns 5806623
BM_Histogram_Observe/8 126 ns 126 ns 5781588
BM_Histogram_Observe/64 138 ns 138 ns 4895550
BM_Histogram_Observe/512 228 ns 228 ns 2992898
BM_Histogram_Observe/4k 959 ns 958 ns 642231
BM_Histogram_Collect/0 328 ns 327 ns 2002792
BM_Histogram_Collect/1 356 ns 354 ns 1819032
BM_Histogram_Collect/8 1553 ns 1544 ns 454921
BM_Histogram_Collect/64 10389 ns 10287 ns 66759
BM_Histogram_Collect/512 75795 ns 75093 ns 9075
BM_Histogram_Collect/4k 615853 ns 610277 ns 1222
BM_Registry_CreateFamily 195 ns 182 ns 3843894
BM_Registry_CreateCounter/0 319 ns 317 ns 1914132
BM_Registry_CreateCounter/1 2146 ns 2131 ns 408432
BM_Registry_CreateCounter/8 8936 ns 8837 ns 82439
BM_Registry_CreateCounter/64 72589 ns 72010 ns 9248
BM_Registry_CreateCounter/512 694323 ns 686655 ns 1056
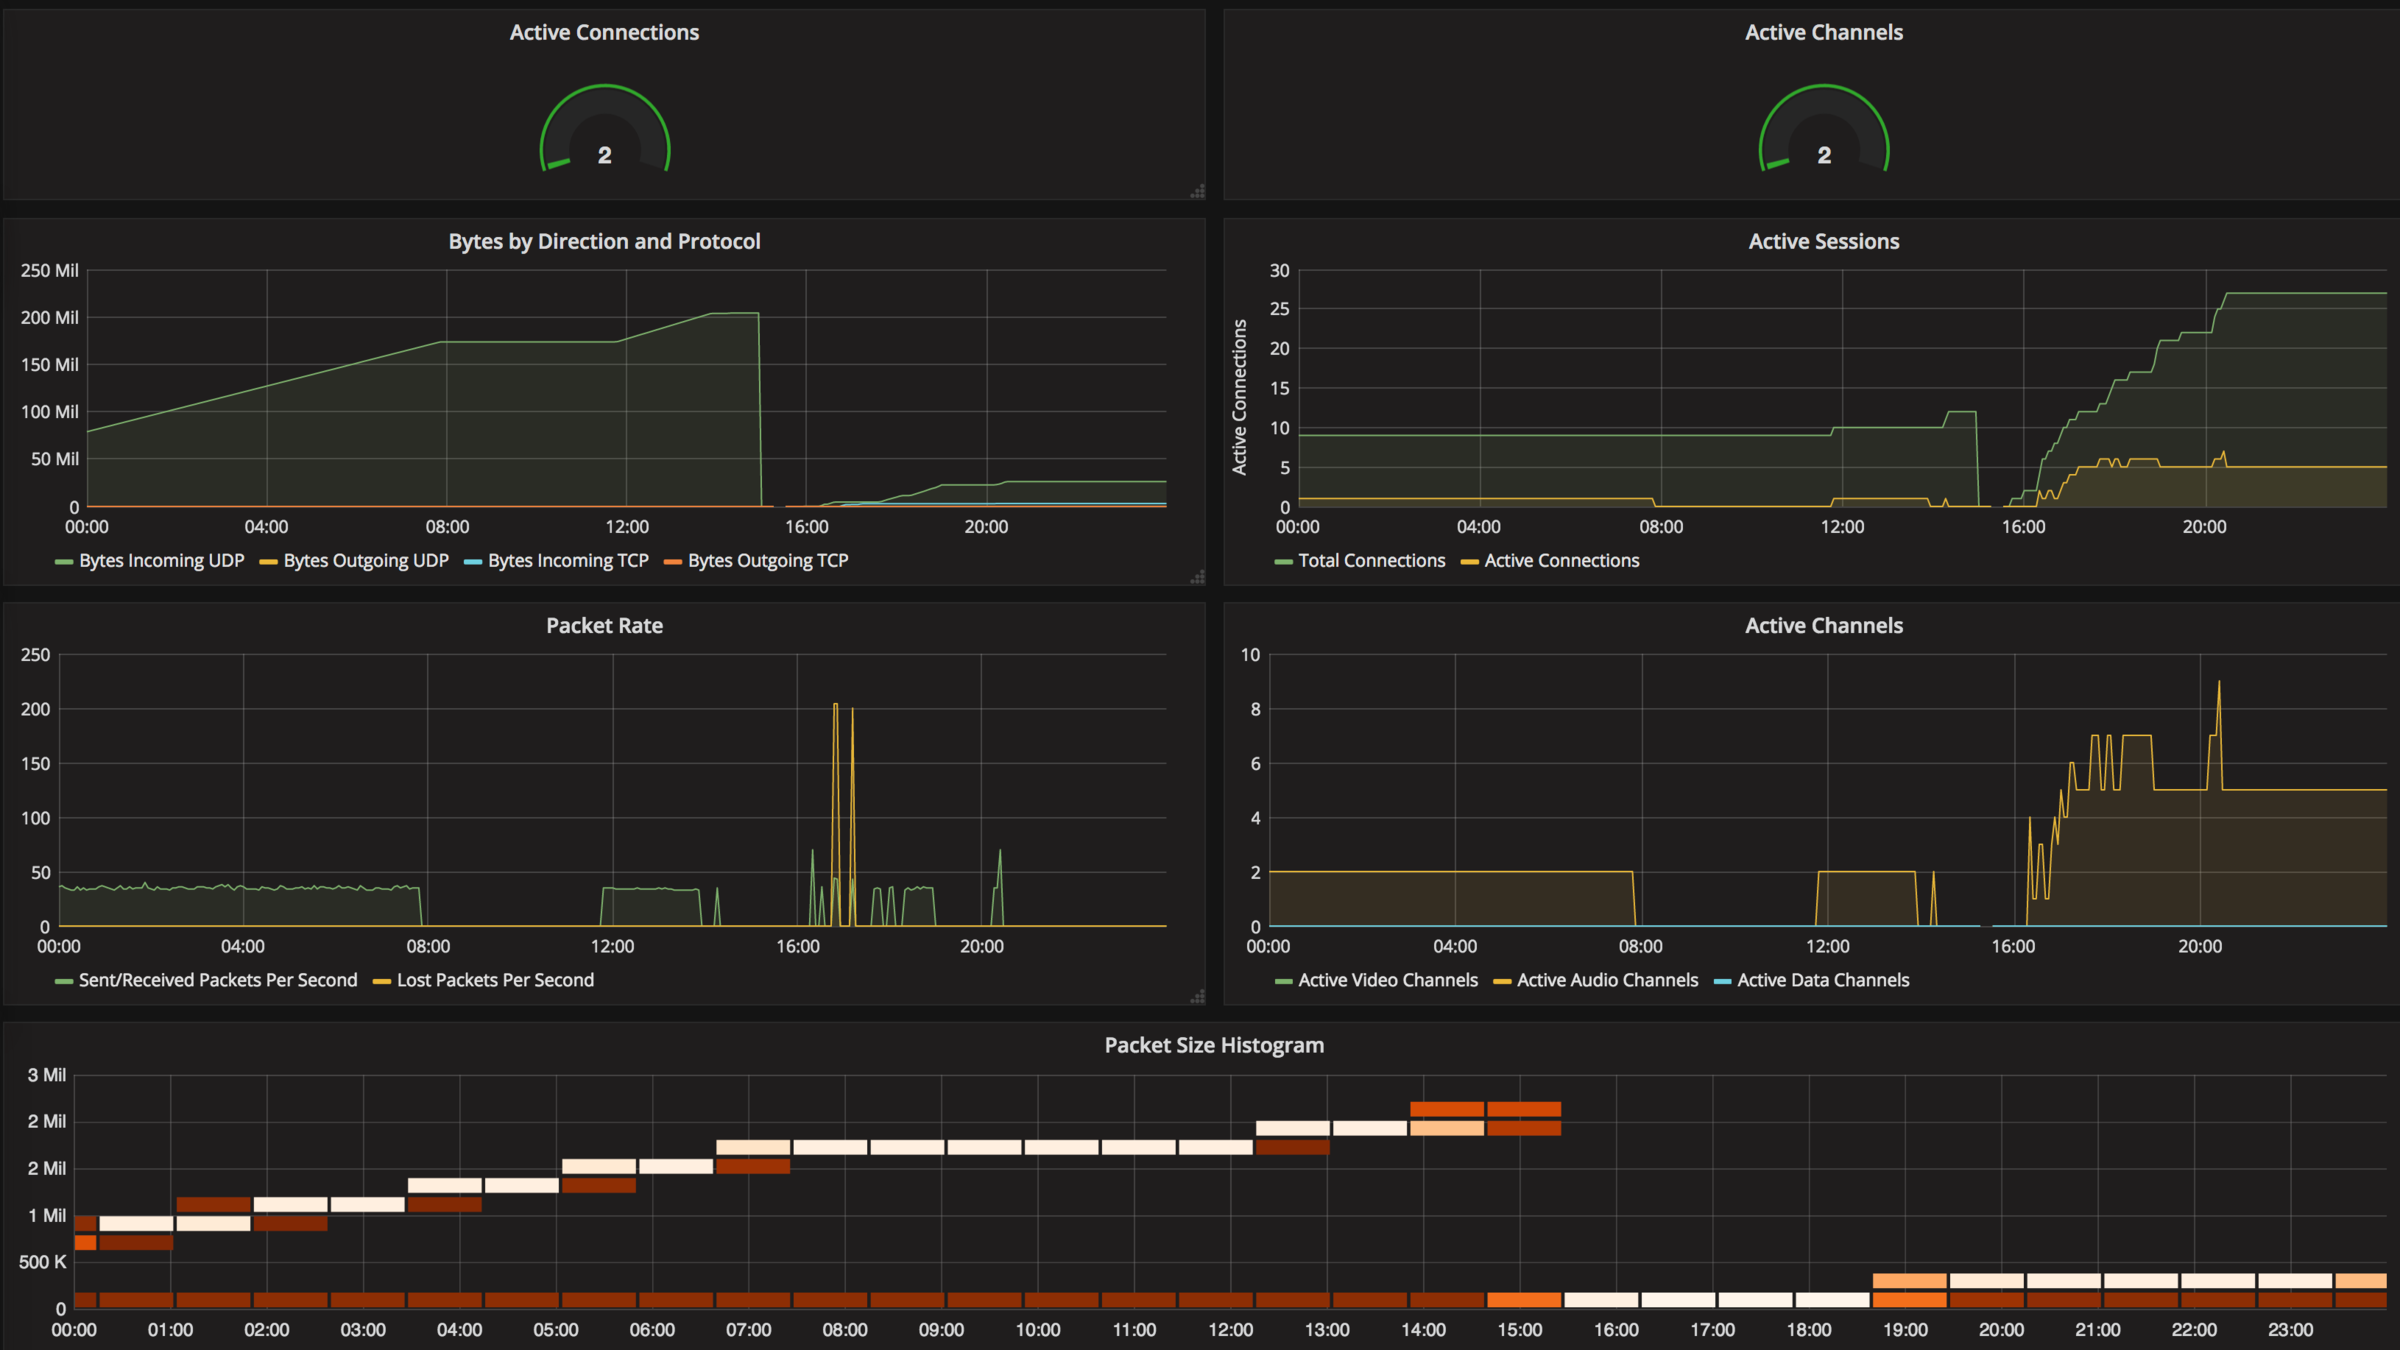
BM_Registry_CreateCounter/4k 18246638 ns 18150525 ns 40Queries
avtp3_connections_created_total - avtp3_connections_closed_totalsum(avtp3_channels_created_total)
- sum(avtp3_channels_closed_total)avtp3_connections_created_totalavtp3_connections_created_total
- avtp3_connections_closed_totalavtp3_transferred_bytes_sum{direction="incoming",protocol="udp"}
avtp3_transferred_bytes_sum{direction="outgoing",protocol="udp"}
avtp3_transferred_bytes_sum{direction="incoming",protocol="tcp"}
avtp3_transferred_bytes_sum{direction="outgoing",protocol="tcp"}sum(irate(avtp3_transferred_bytes_count{}[1d]))
sum(irate(avtp3_lost_packets_total{}[1d]))histogram_quantile(
0.99,
sum(
rate(
task_queueing_delay_ns_bucket{
instance=~"^($bridge).*$",
type="immediate"
}[1m])
) by (instance, le)
)/1000000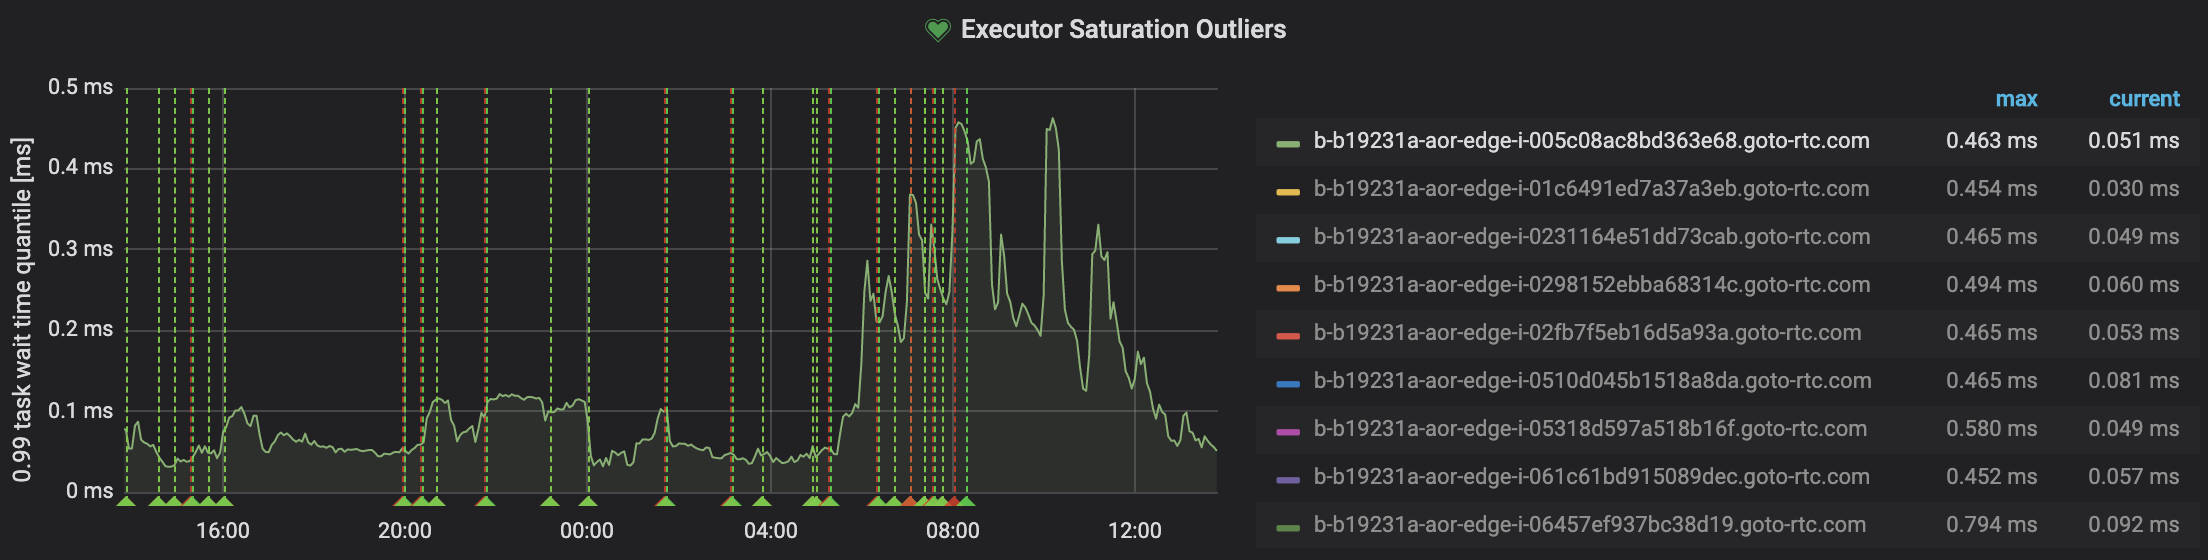
Thanks for your attention! Questions?

prometheus-cpp
By Jupp Müller


