Data Visualisation
12 May 2020
@maartenzam
Boehringer Ingelheim
2.Interactive & online
Today
1. Data visualisation fundamentals
2. Online and interactive data visualisation
3. Going beyond bars and lines: non-standard visualisations
4. Dashboard design
Interactive & online viz
Online graphics: bitmaps, svg, canvas, webGL
Responsive data visualisation
Interactive data visualisation
Why the New York Times is doing fewer interactives
Online graphics


Bitmaps
Raster of pixels
Each pixel a color
Vectors
Coordinates
Shape specification
Shape properties
[1,1] => rgb(255, 255, 255)
[1,2] => rgb(236, 89, 83)
[1,3] => rgb(234, 50, 35)
...
<circle cx=30 cy=30 r=20 fill="red">
Bitmaps
Do not scale
jpg, png
Vectors
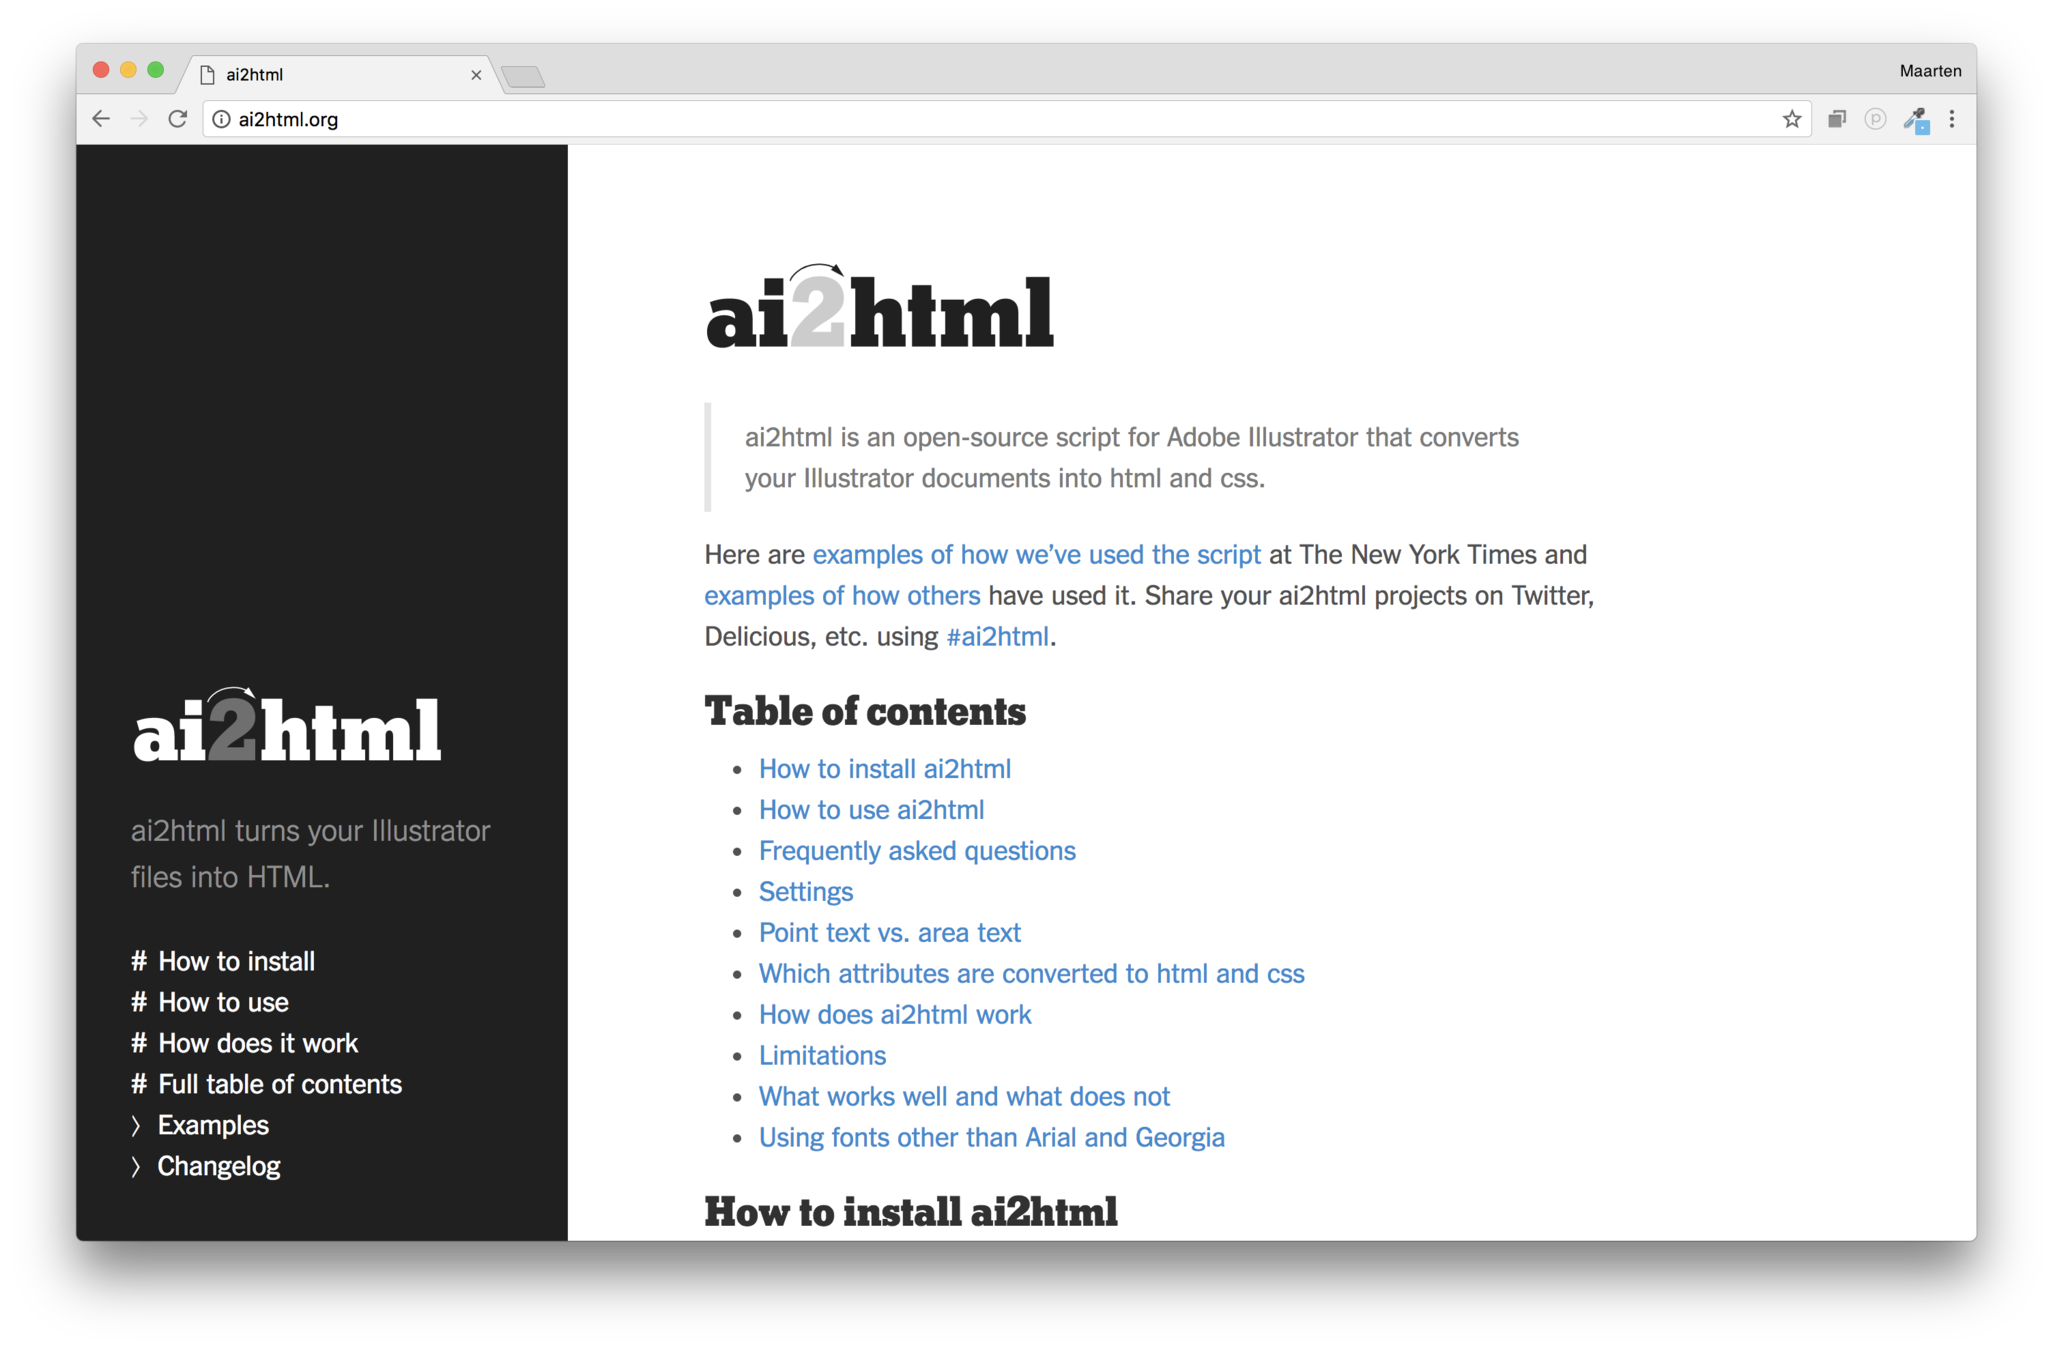
svg = scalable vector graphics
<circle>, <line>, <rect>, <path>, <text>, ...
Works together with html, css, js
[1,1] => rgb(255, 255, 255)
[1,2] => rgb(236, 89, 83)
[1,3] => rgb(234, 50, 35)
...
<circle cx=30 cy=30 r=20 fill="red">


svg
Scales well in resolution
Smaller file sizes
Part of the DOM: events
Animatable
Accessible
Filters
Part of the DOM: limited number of elements
Not good for things like photos
canvas
Added in html5
Draw bitmaps with javascript
<!DOCTYPE html>
<html>
  <head>
    <meta charset="utf-8"/>
    <title>Canvas tutorial</title>
    <script type="text/javascript">
      function draw() {
        var canvas = document.getElementById('tutorial');
        var ctx = canvas.getContext('2d');
        ctx.fillStyle = "green";
        ctx.fillRect(10, 10, 100, 100);
      }
    </script>
  </head>
  <body onload="draw();">
    <canvas id="tutorial" width="150" height="150"></canvas>
  </body>
</html>
svg
canvas
Pro
Con
Easy to get started
Easy to register user interactions
Easy to animate
Very performant
Easy to update
Potentially complex DOM updates
Not performant for large numbers of elements
More work to get started
More work to handle interactions
Have to write custom animations
WebGL
Hardware accelerated graphics
In <canvas>
animating lots and lots of circles with WebGL and REGL.js
Responsive visualisations

Font too small
Axis labels might start to overlap
Line is too narrow

Small responsive
Less ticks
More compact formatting
Thicker line width
Bigger font
Remove y axis

Large responsive
More ticks
Less compact formatting
Thinner line width
Smaller font
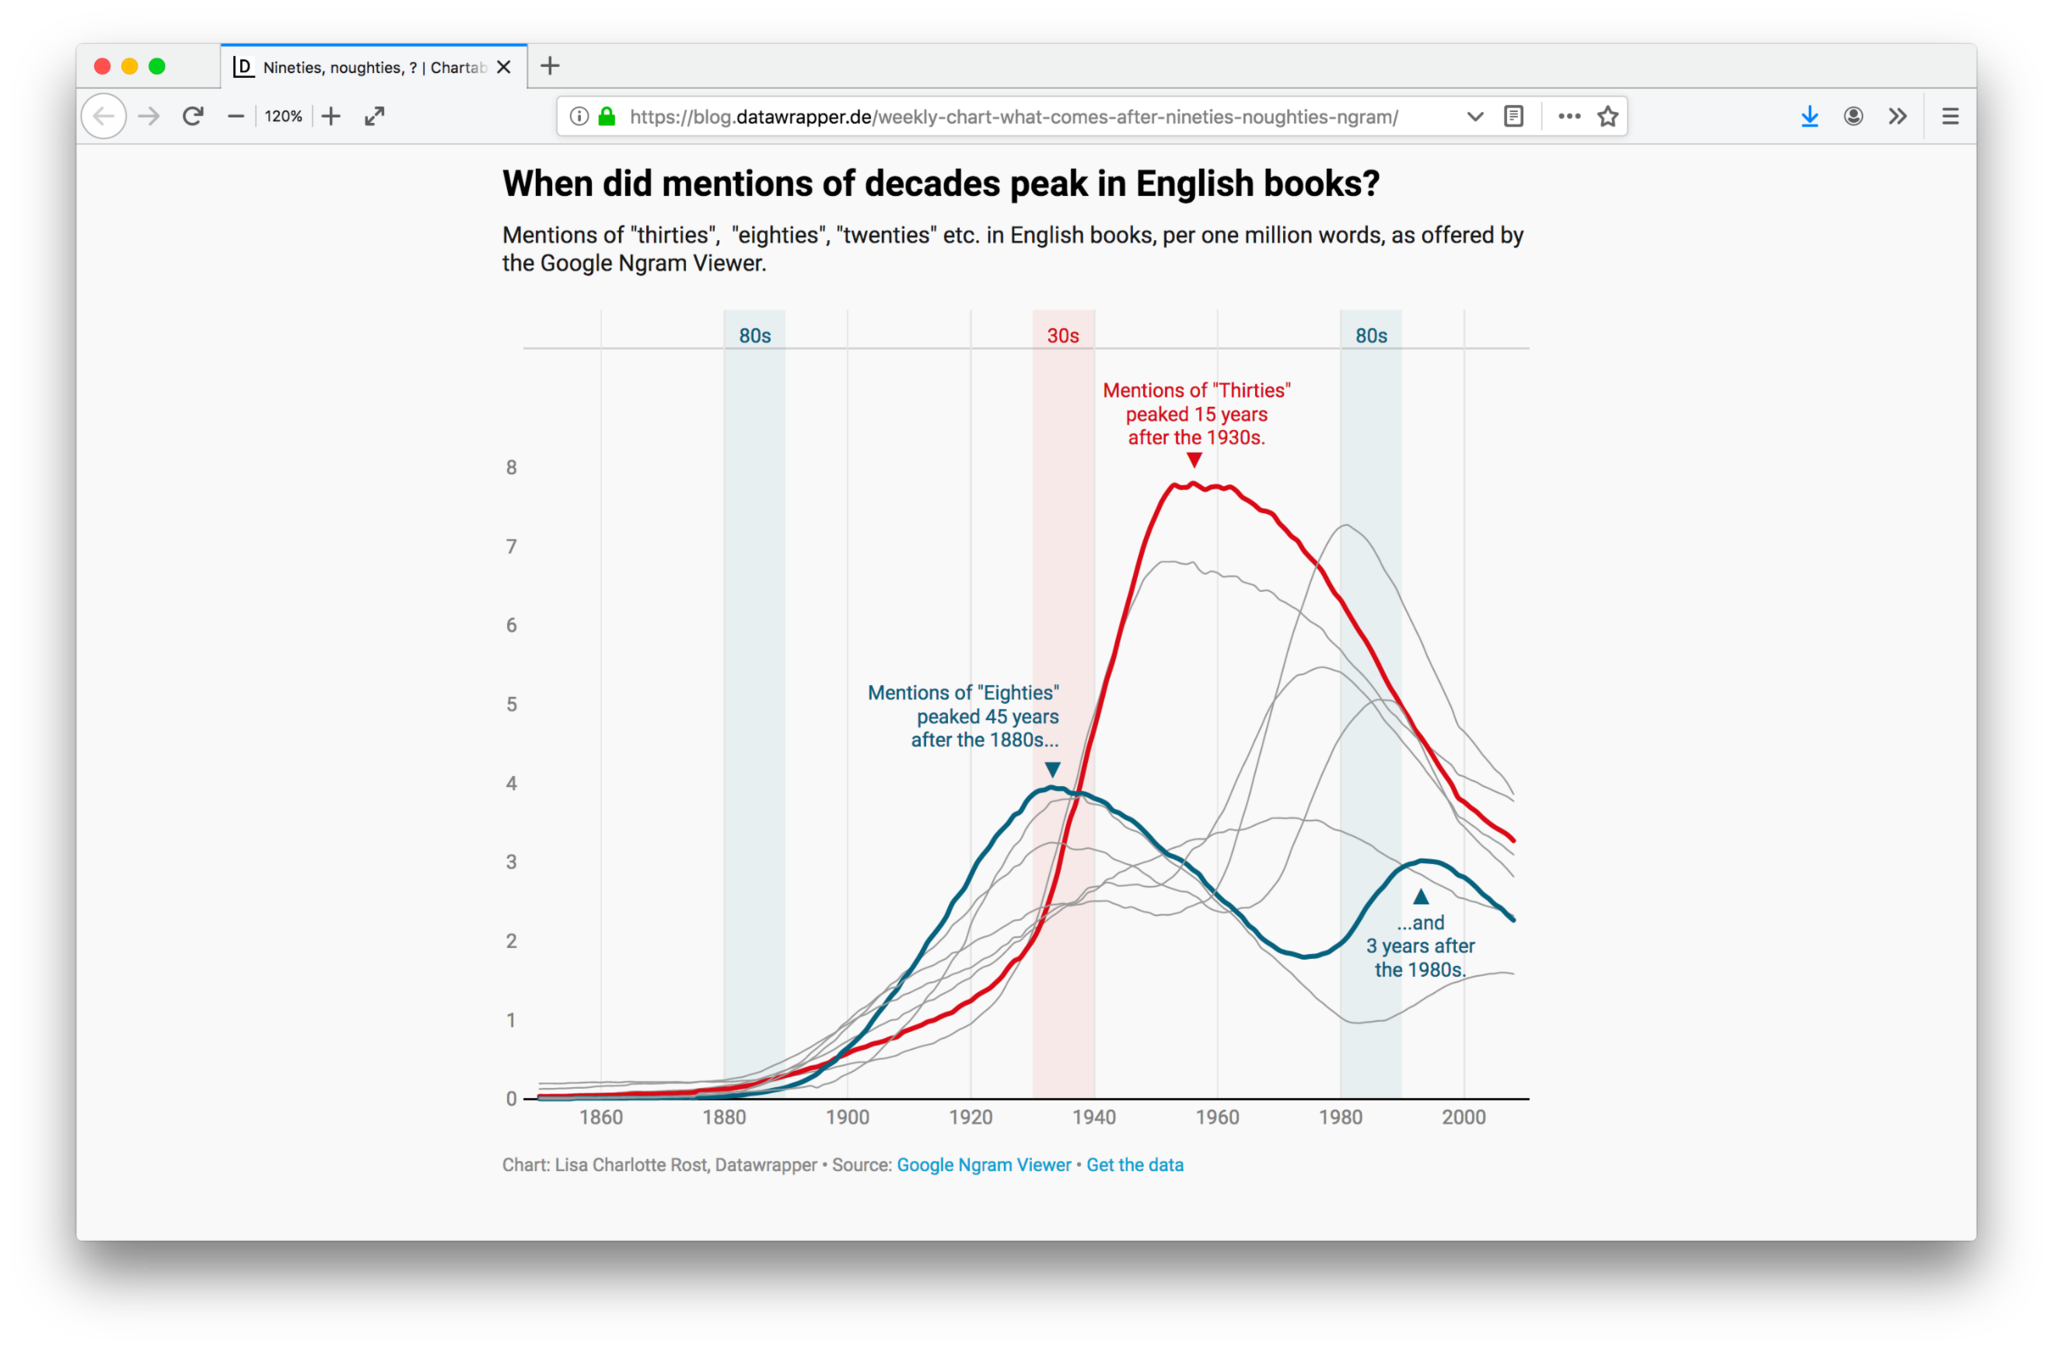
Chart orientation
Interactivity
What is interactivity for visualisation?
What is interactivity?
As of today there is no consensus on what interaction is, and what its role for visualization is – as interaction is an elusive and overloaded term
Interactivity for analysis
Specify visual encoding
Choose different dimension to be visualised
Choose another chart type

Interactivity for analysis
Filter out relevant data
Thresholds, time ranges, categories, geographical regions, ...
Interactivity for analysis
Sort data
To reveal patterns

Interactivity for analysis
Derive values
Normalisation
Aggregation
Models and statistics
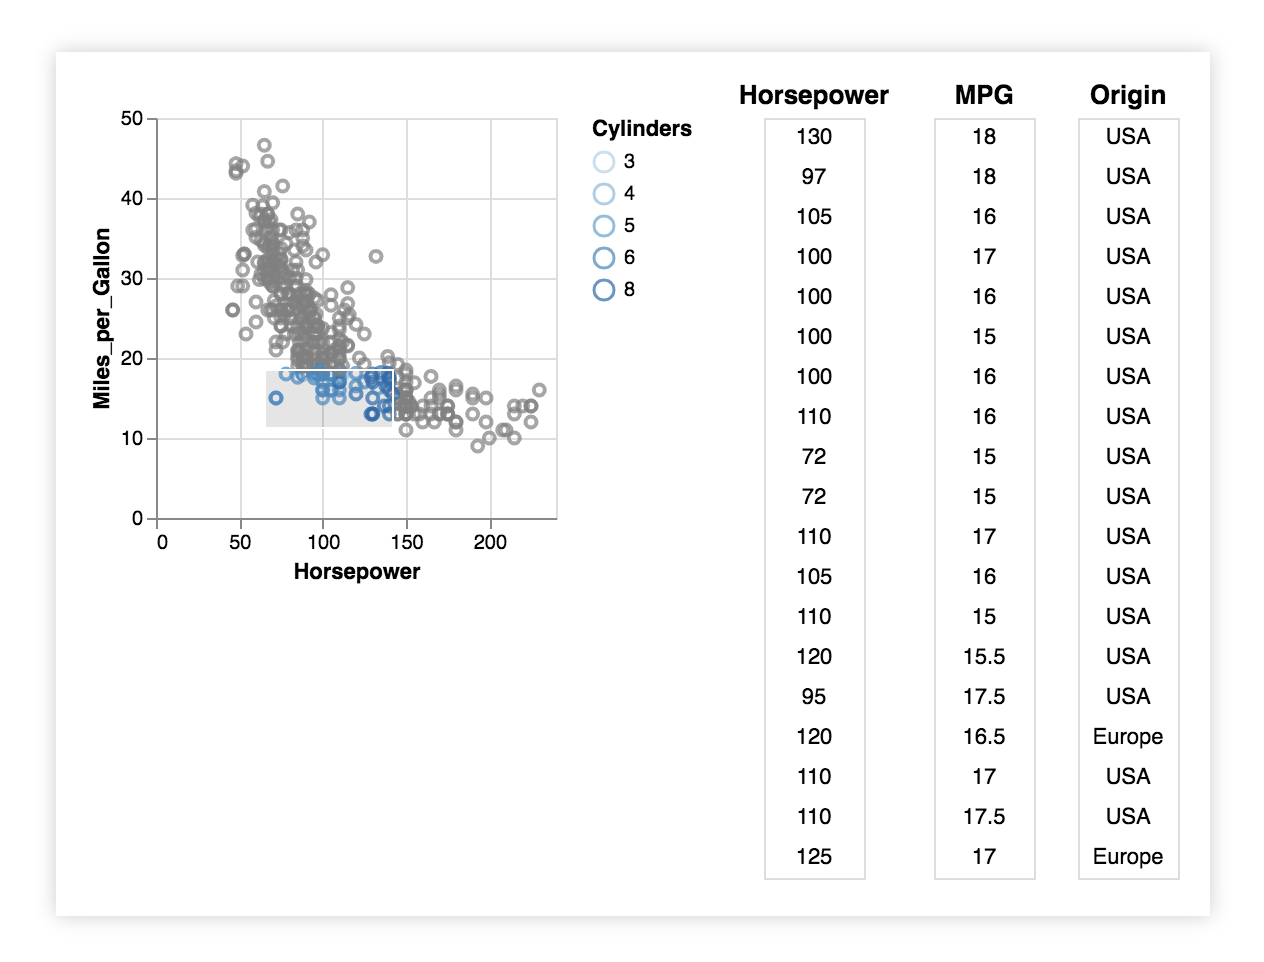
Interactivity for analysis
Select items
Identify single or multiple items, get details/summaries
Filter items in or out
Interactivity for analysis
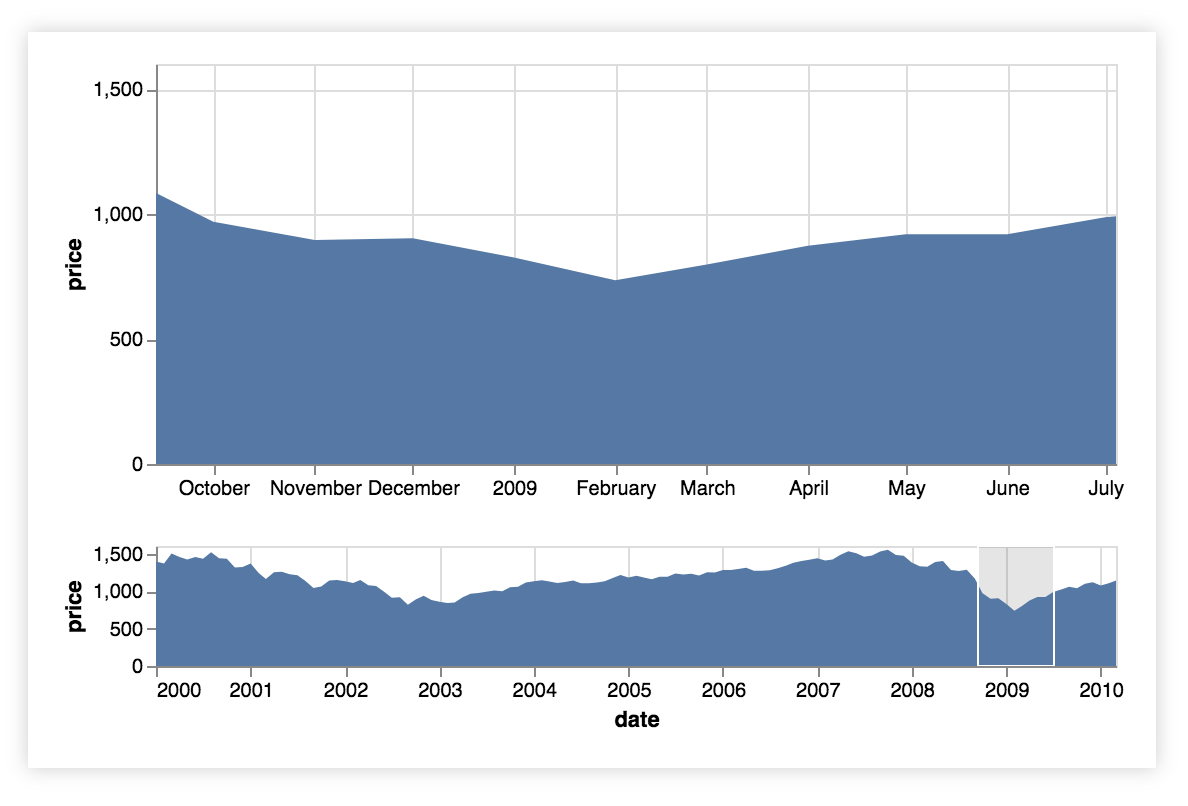
Navigate
Zoom out for bigger picture
Zoom in for details
Pan the viewport on the data
Interactivity for analysis
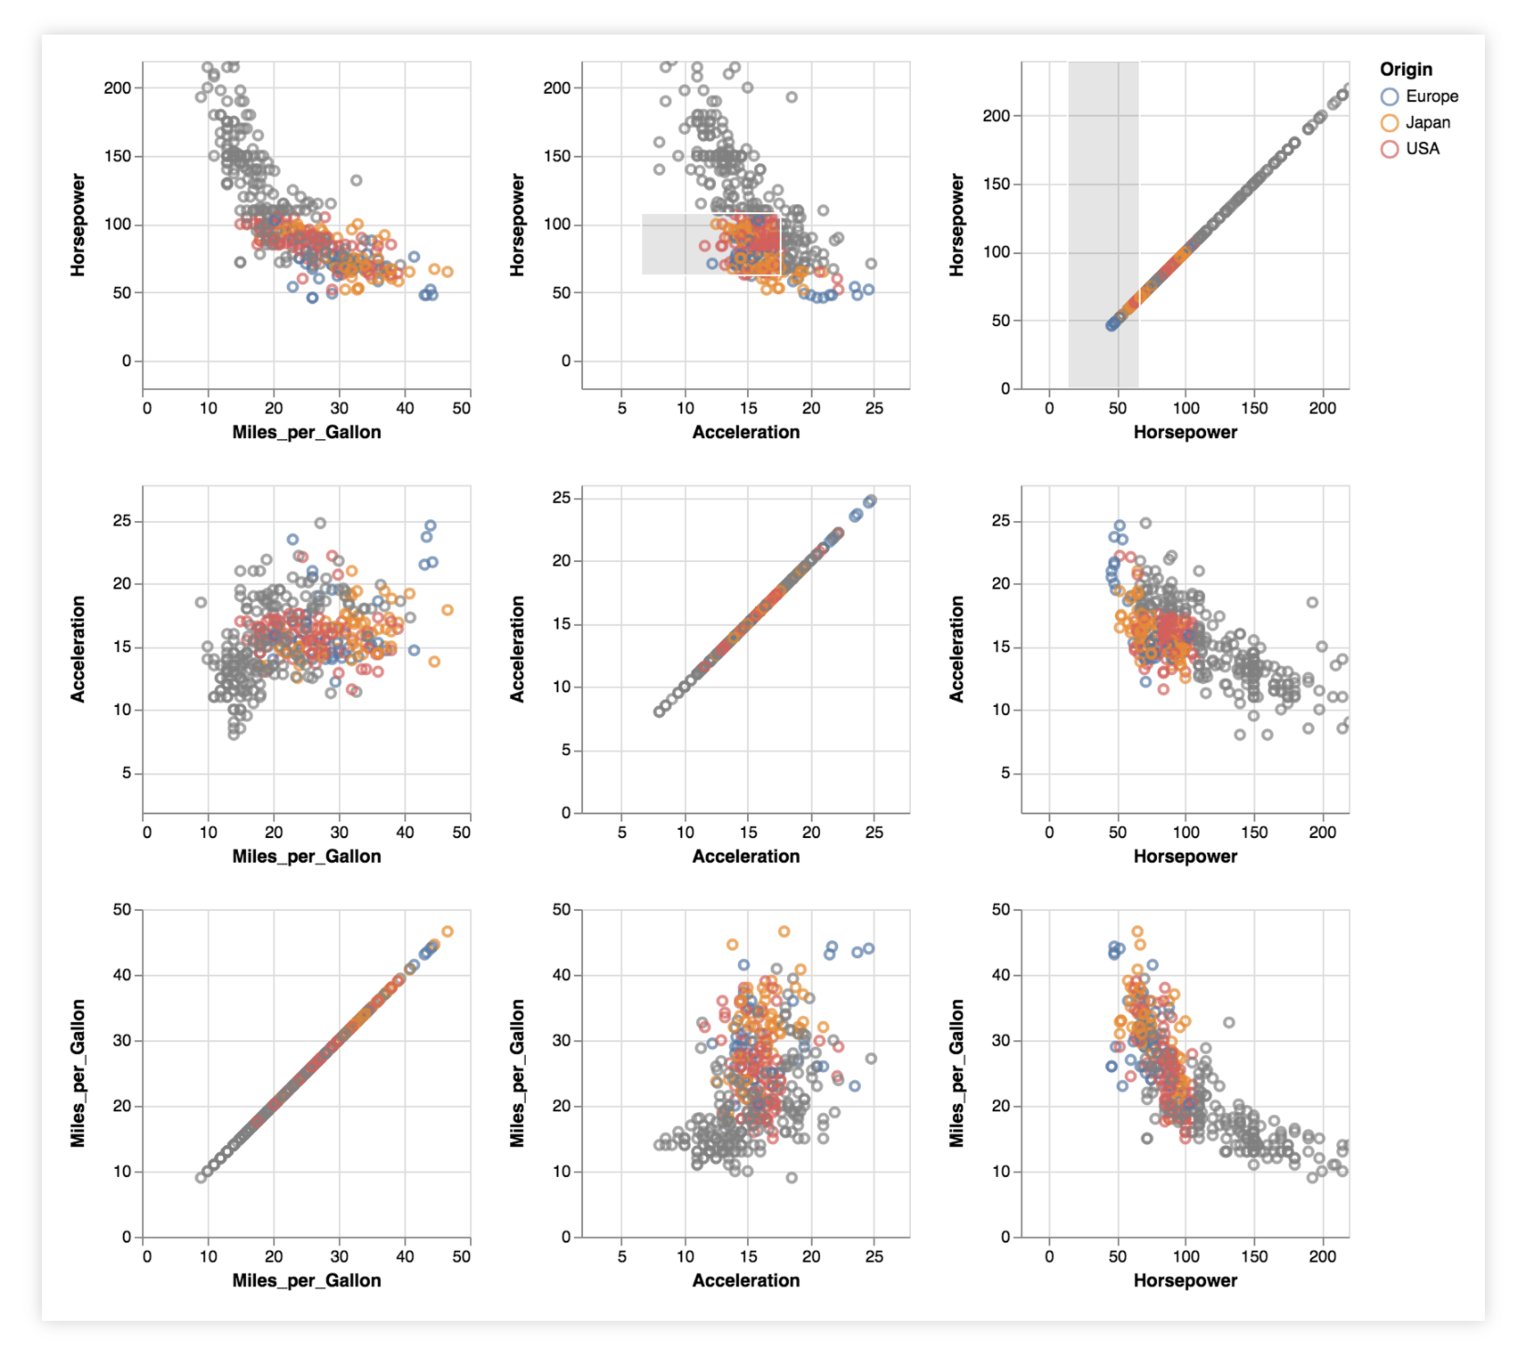
Coordinate multiple views
Explore multivariate data
Small multiples
Brushing and linking
Interactivity for explanatory data visualisation
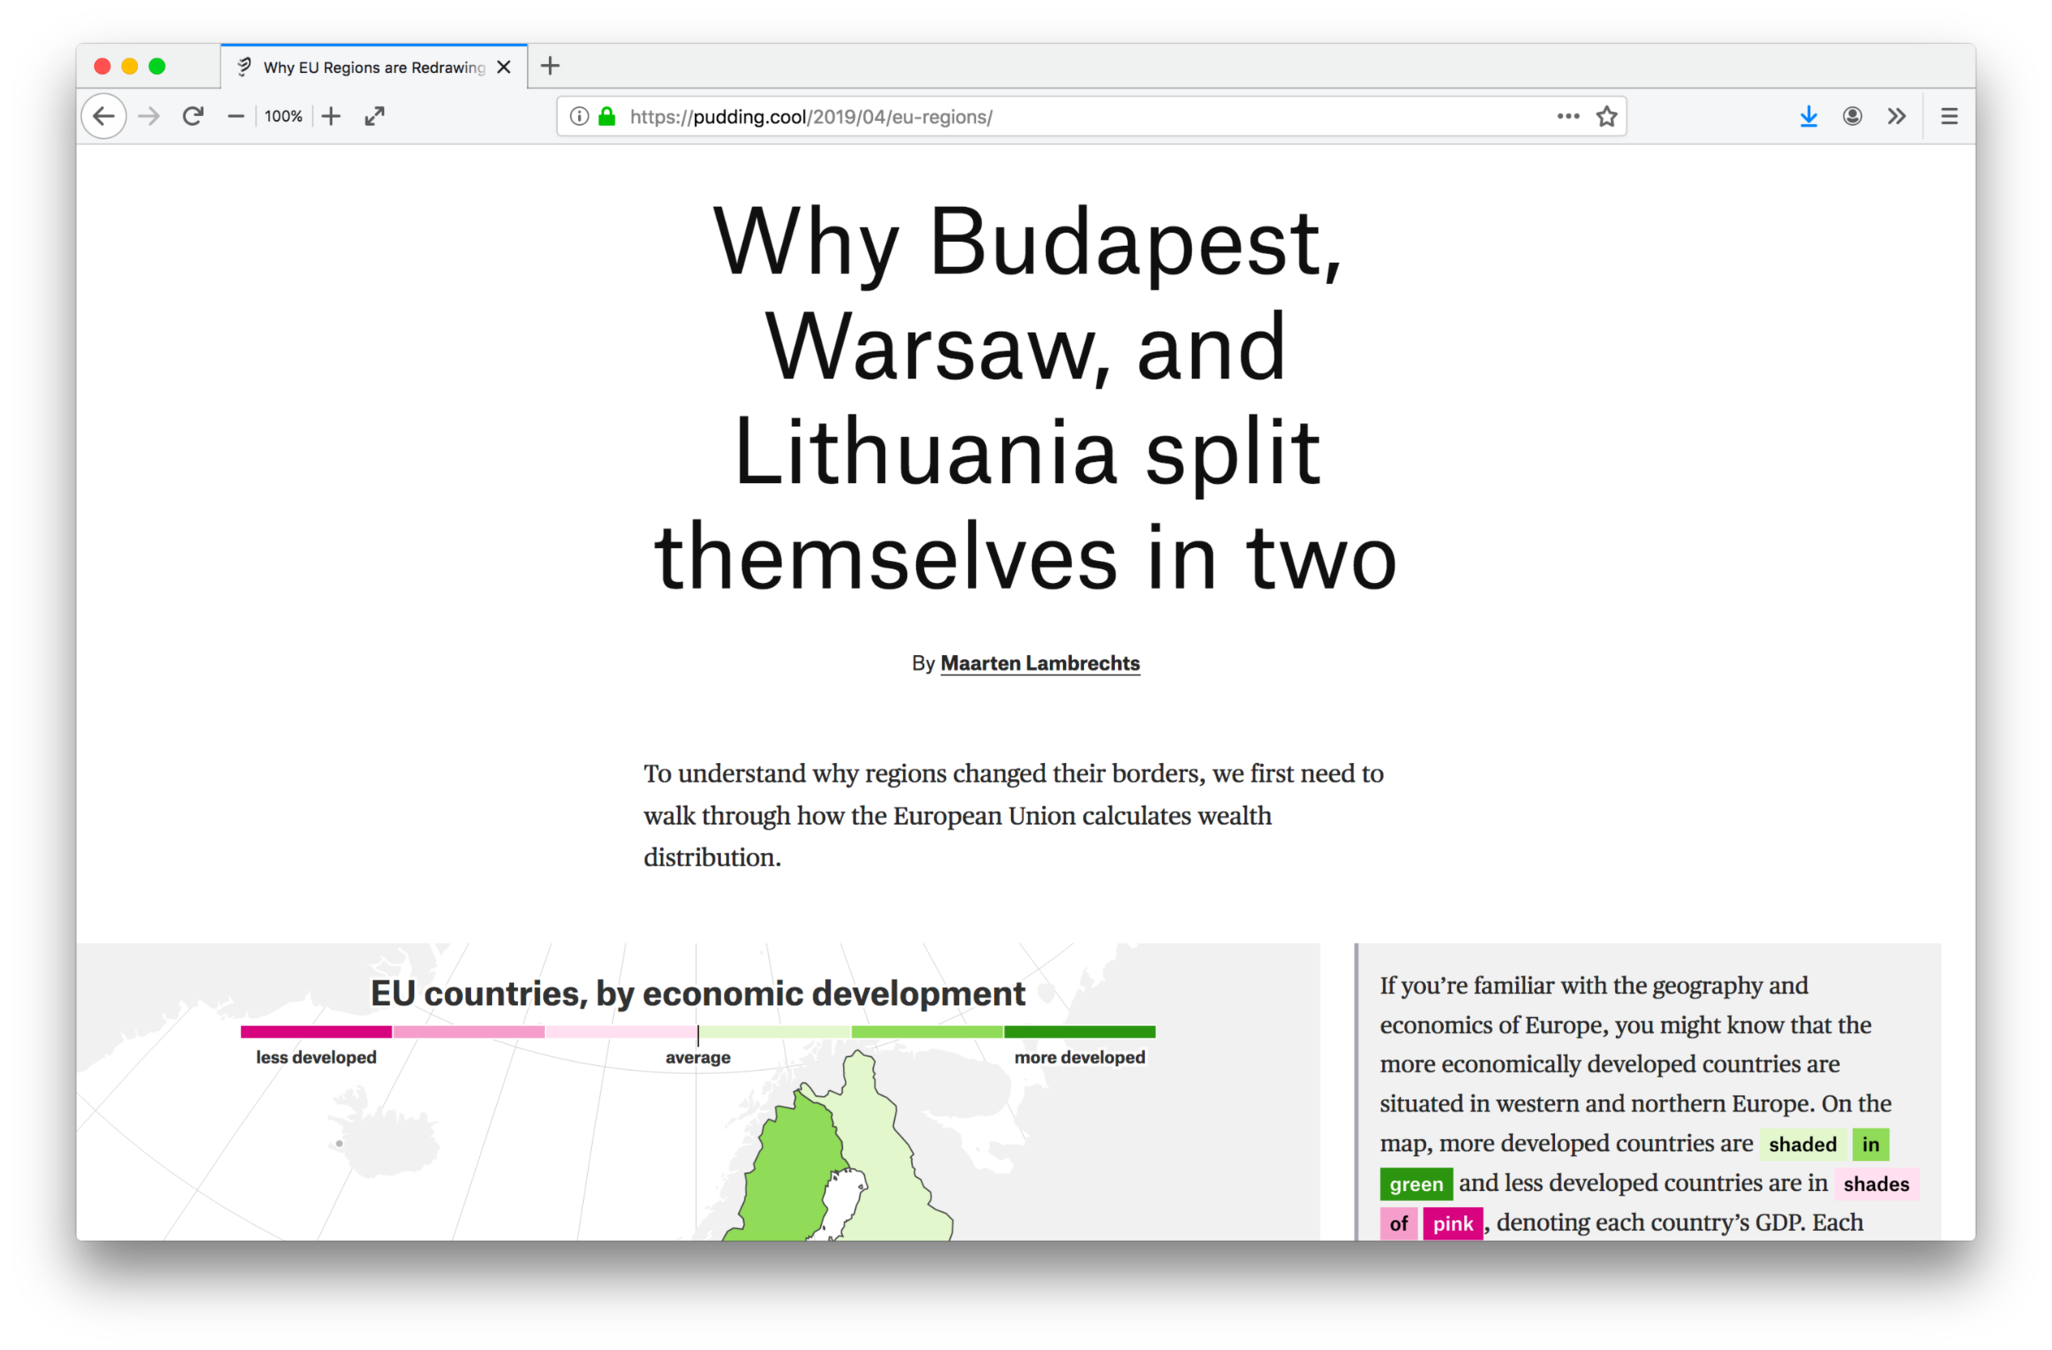
What interactive features can you identify in pudding.cool/2019/04/eu-regions?
Interactivity for Explanatory dataviz
Tooltips
Identify items
Offer exact data points
Give more details
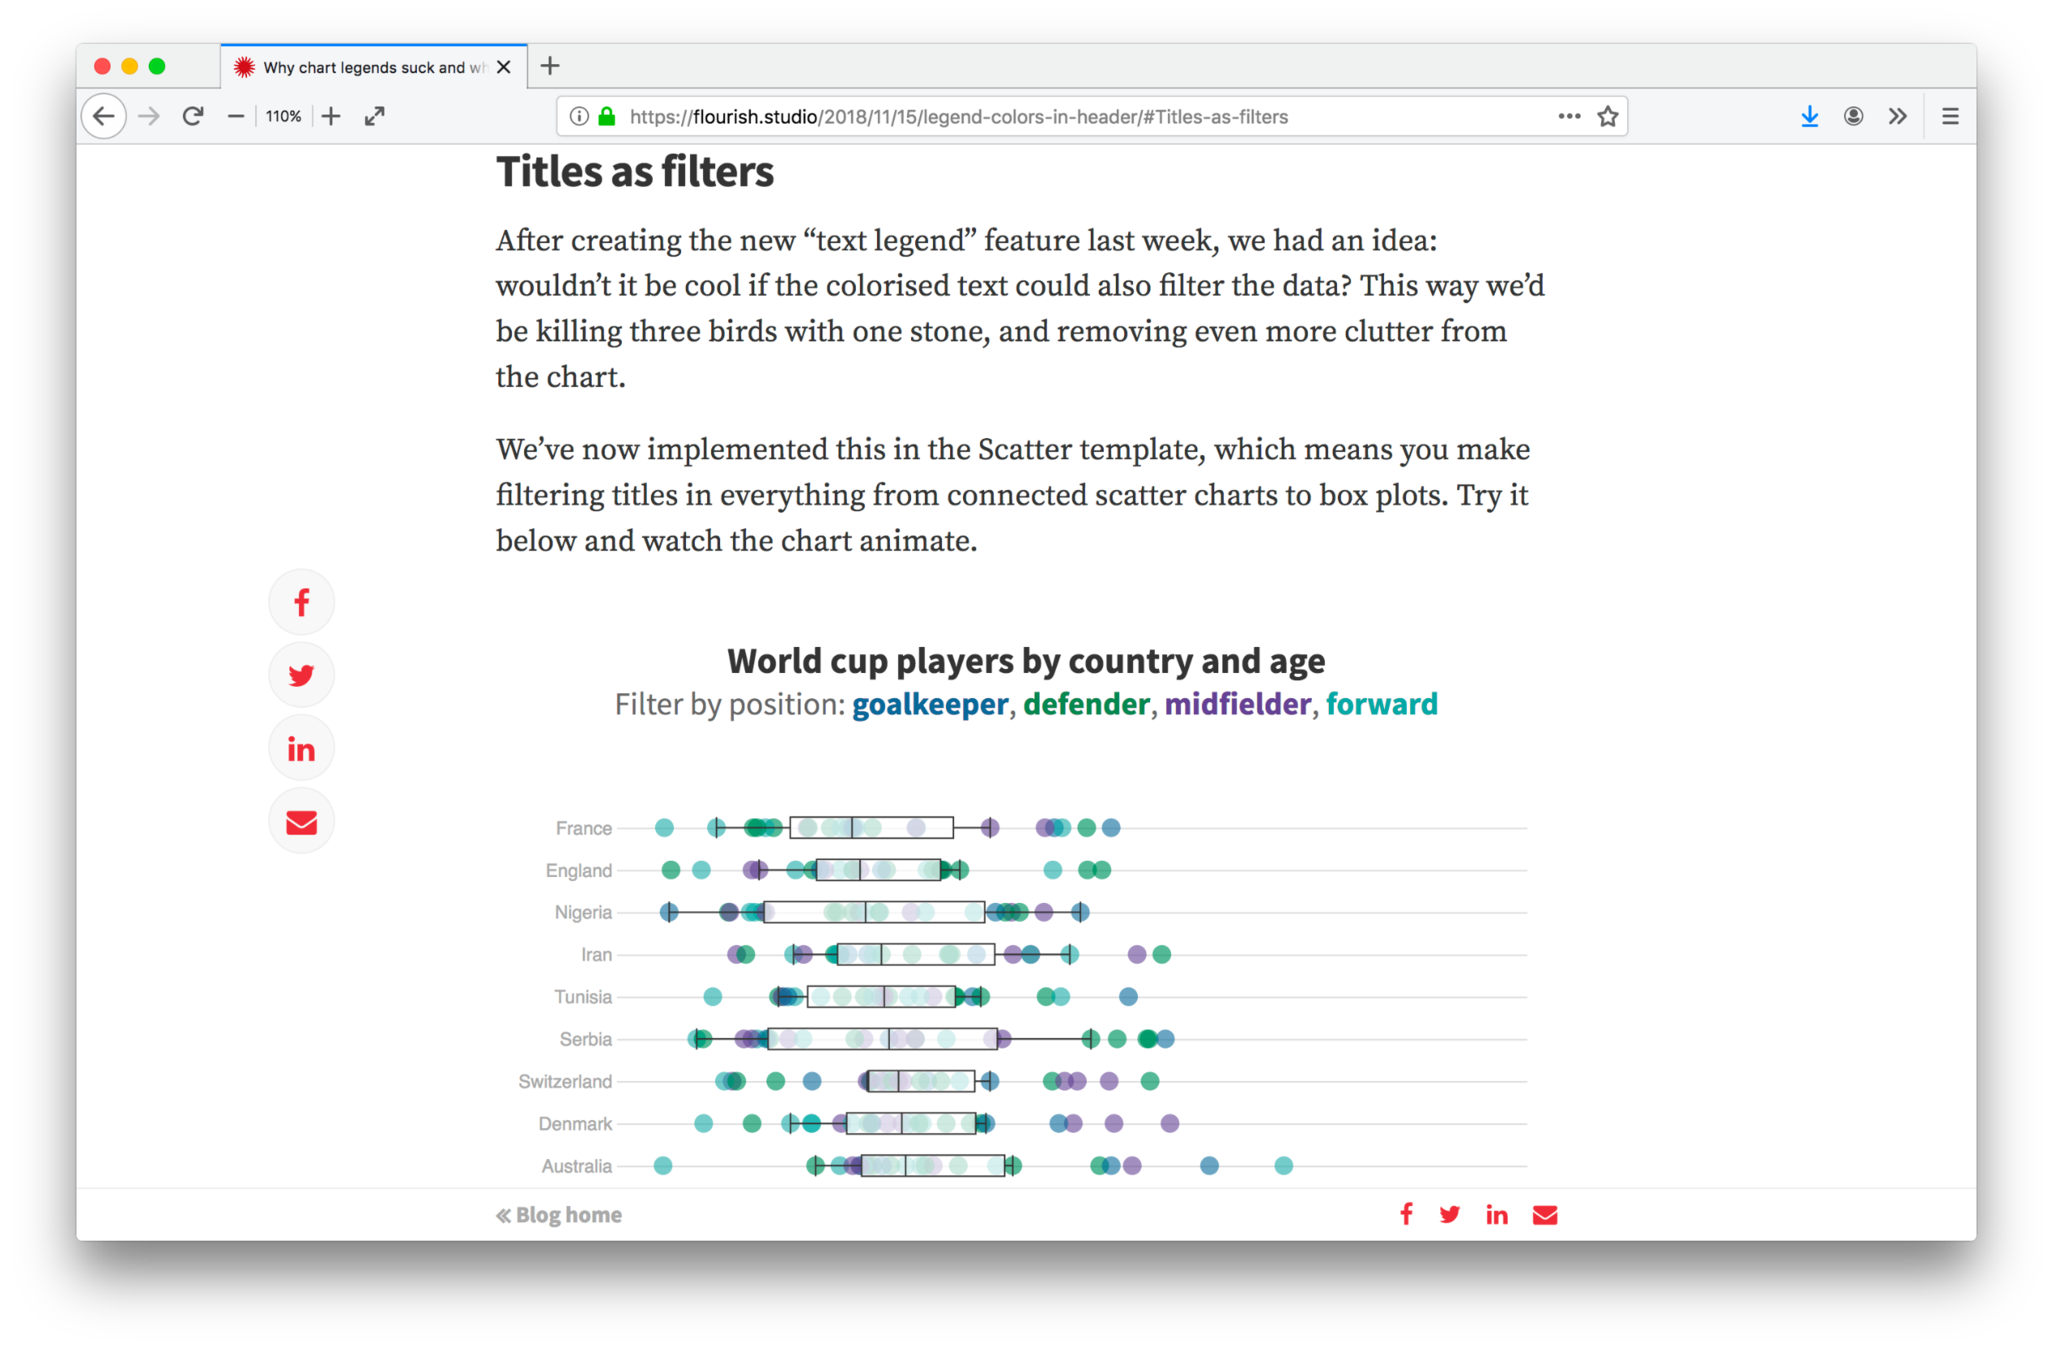
Interactivity for Explanatory dataviz
Highlighting
Identify items
Show group of items
Interactivity for Explanatory dataviz
Animation
Object constancy
Transitions for zoom and panning the data space
Transition between visual encodings
Need triggers: time interval, scroll, click
Interactivity for Explanatory dataviz
Zoom
Filter, focus attention
Why the NYT is doing fewer interactives
Title of a famous talk by Archie Tse, graphics director of The New York Times
Based on user statistics, they noted that many interactive features were not being used
They came up with 3 rules for visual storytelling
They apply to the online news context, but good to know about them
1. If you make the reader click or do anything other than scroll, something spectacular should happen
2. If you make a tooltip or a rollover, assume no one will ever see it. If content is important for readers to see, don't hide it
3. When deciding to make something interactive, remember that it is expensive to make it work on all platforms
- Users can dig deep
- Users can discover the full data set
- Interaction can help build trust in your analysis
Tomorrow
1. Data visualisation fundamentals
2. Online and interactive data visualisation
3. Going beyond bars and lines: non-standard visualisations
4. Dashboard design
Thank you!
Interactive and online visualisations
By maartenzam


