Data storytelling
Eyeon
How to make impactful data messages
30 October 2017
@maartenzam
Once upon a time...
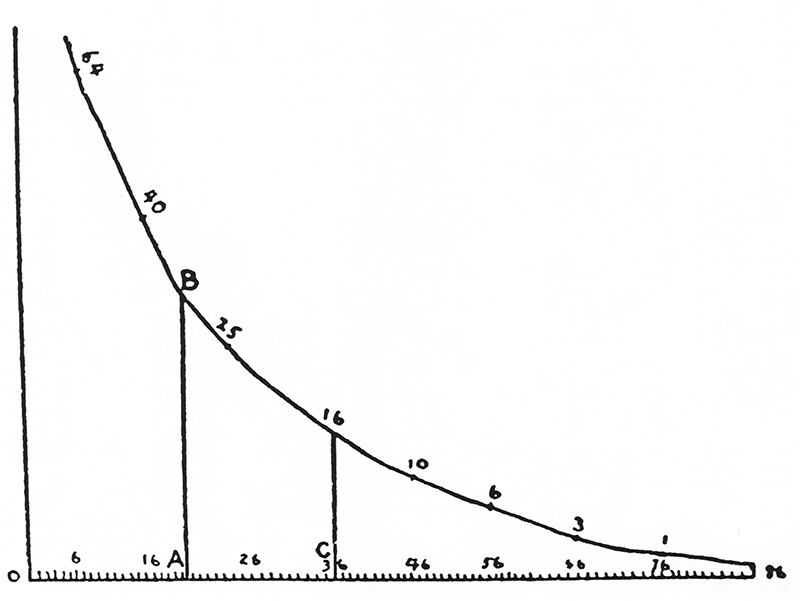
"As knowledge increases amongst mankind, and transactions multiply, it becomes more and more desirable to abbreviate and facilitate the modes of conveying information from one person to another, and from one individual to the many."
William Playfair, 1786
"Everything that can be expressed in numbers can be represented by lines."
John Playfair


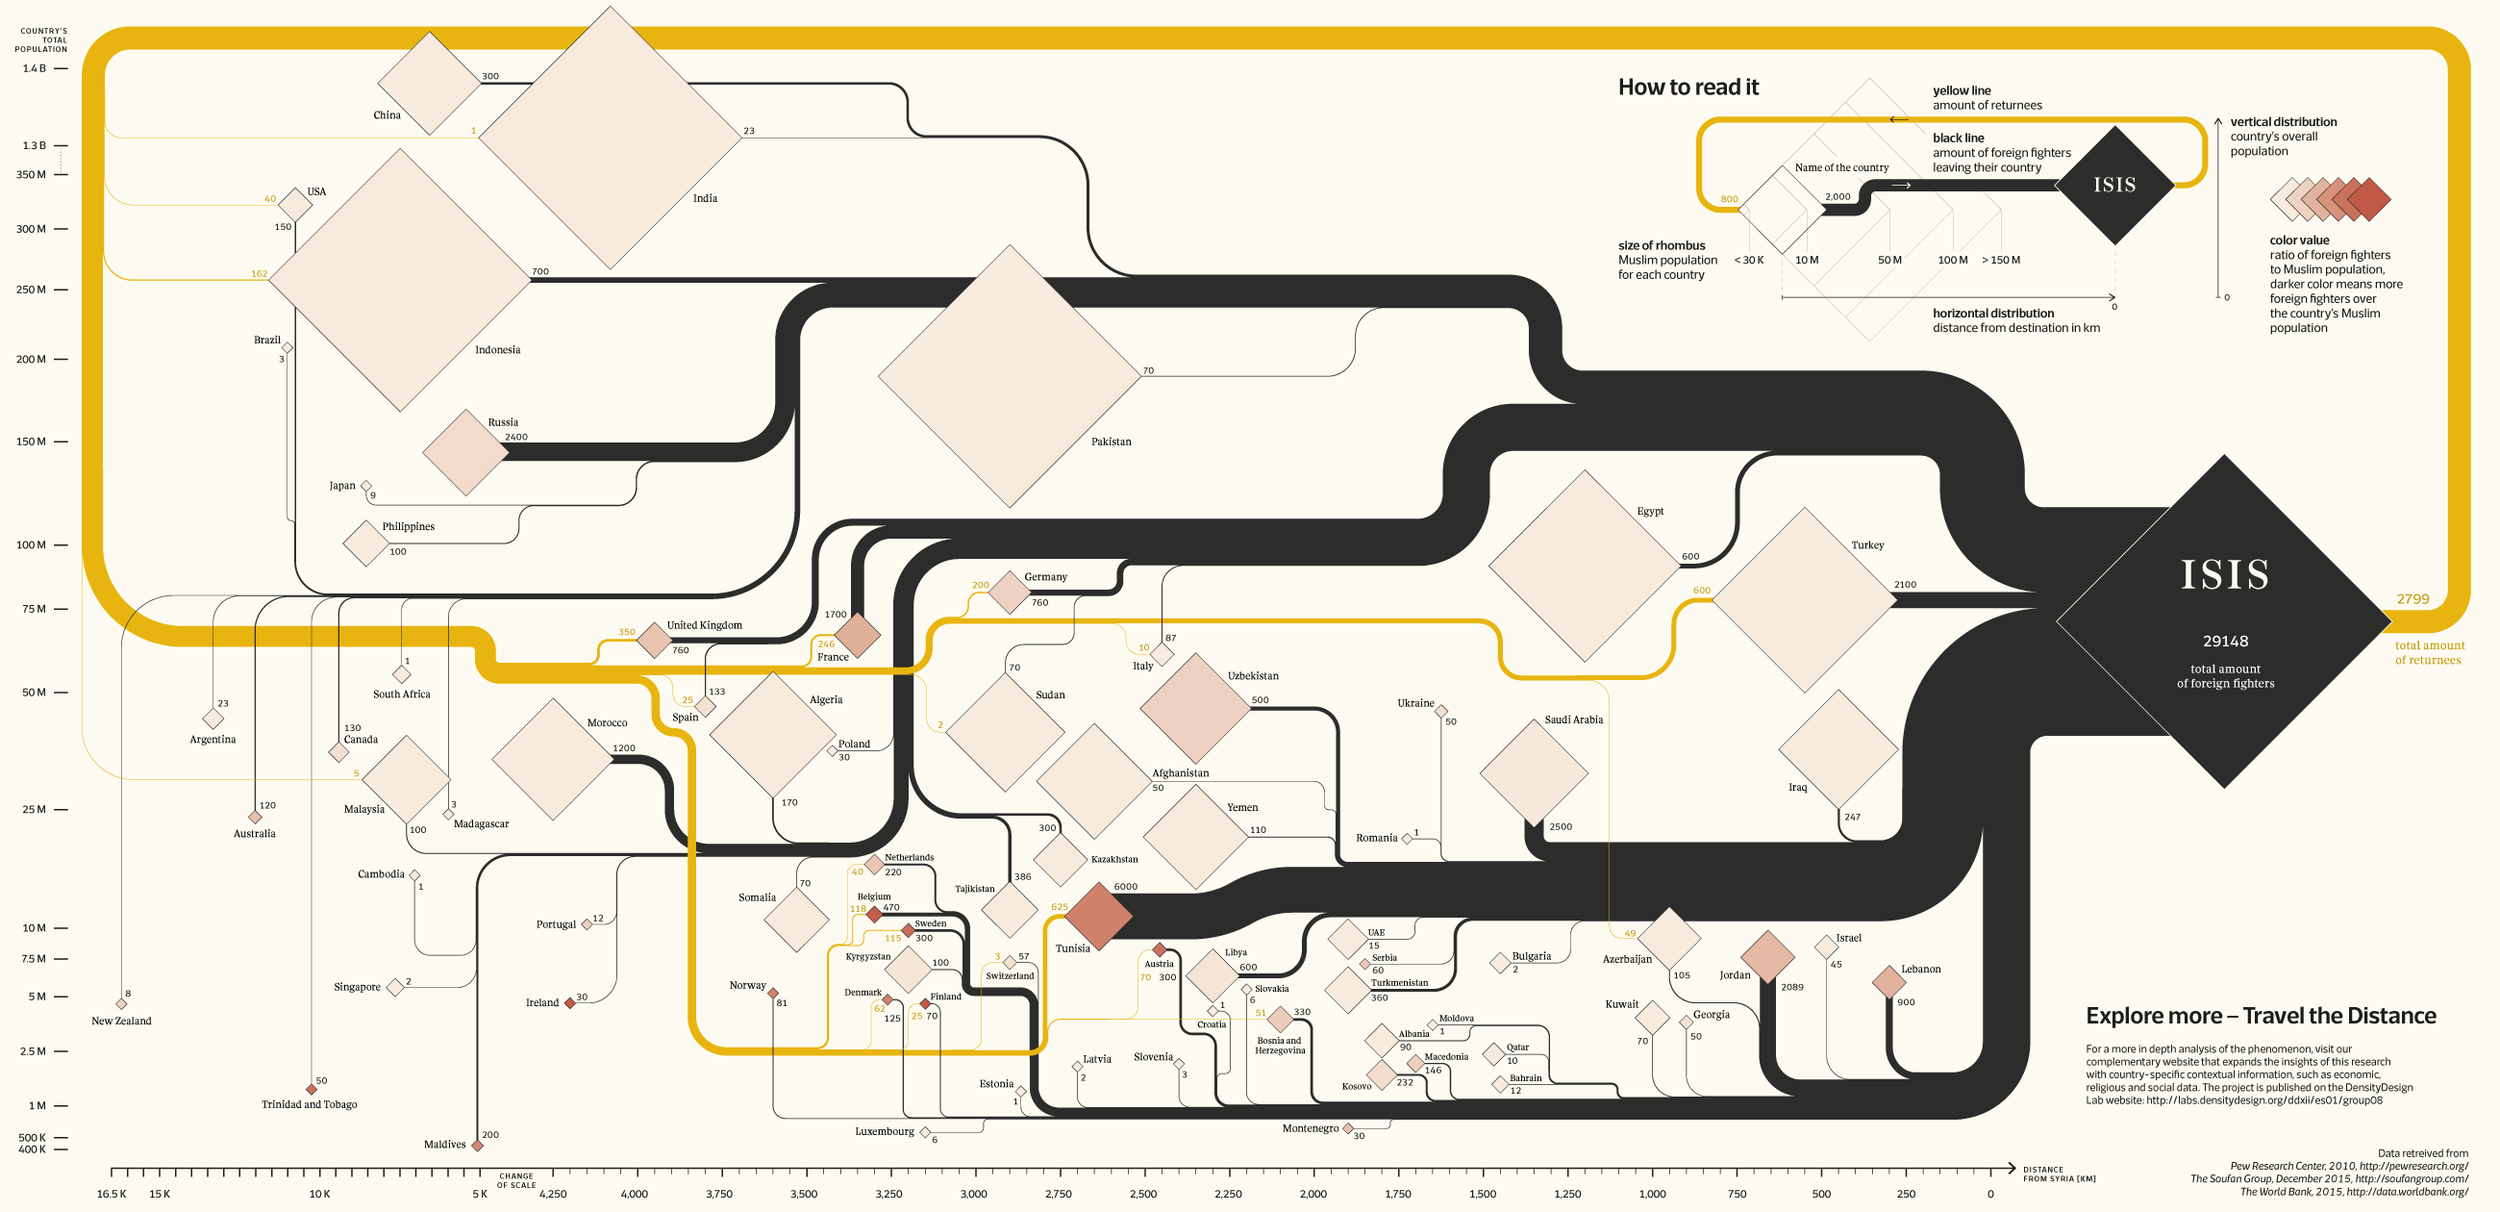

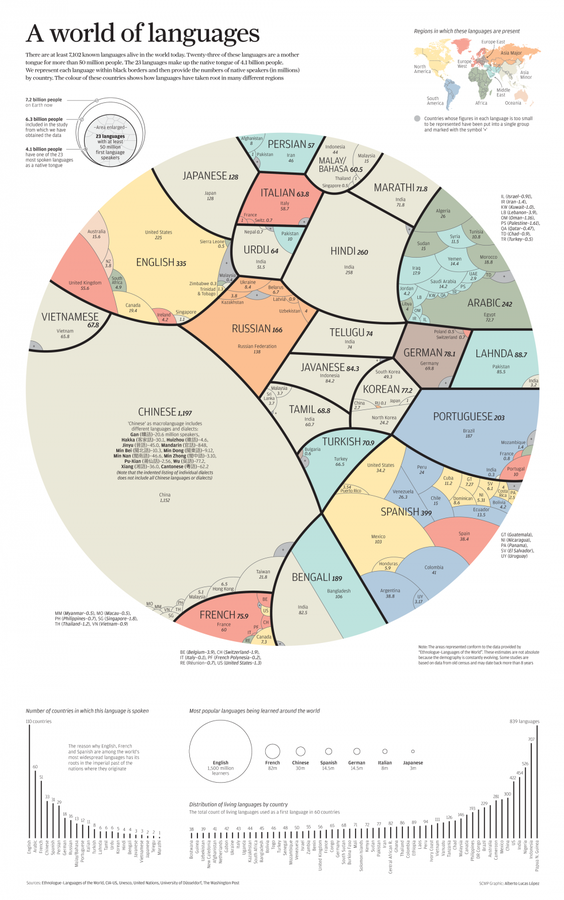
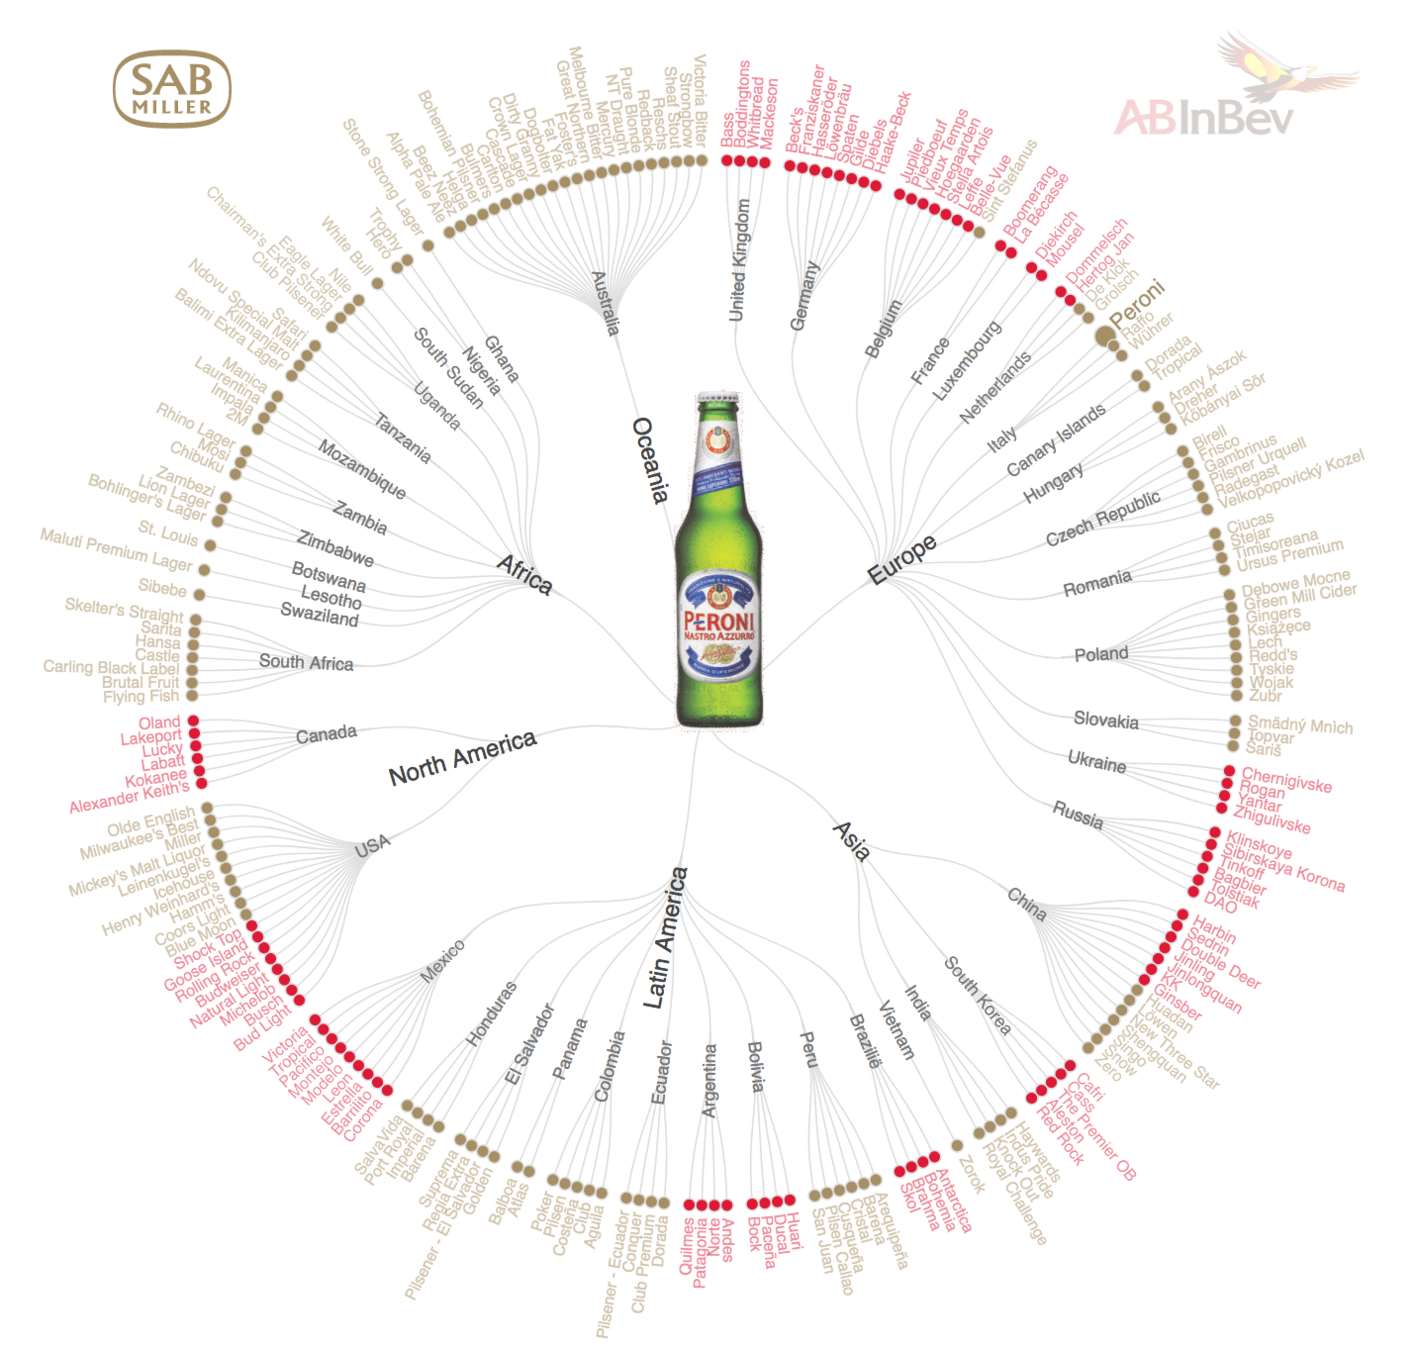
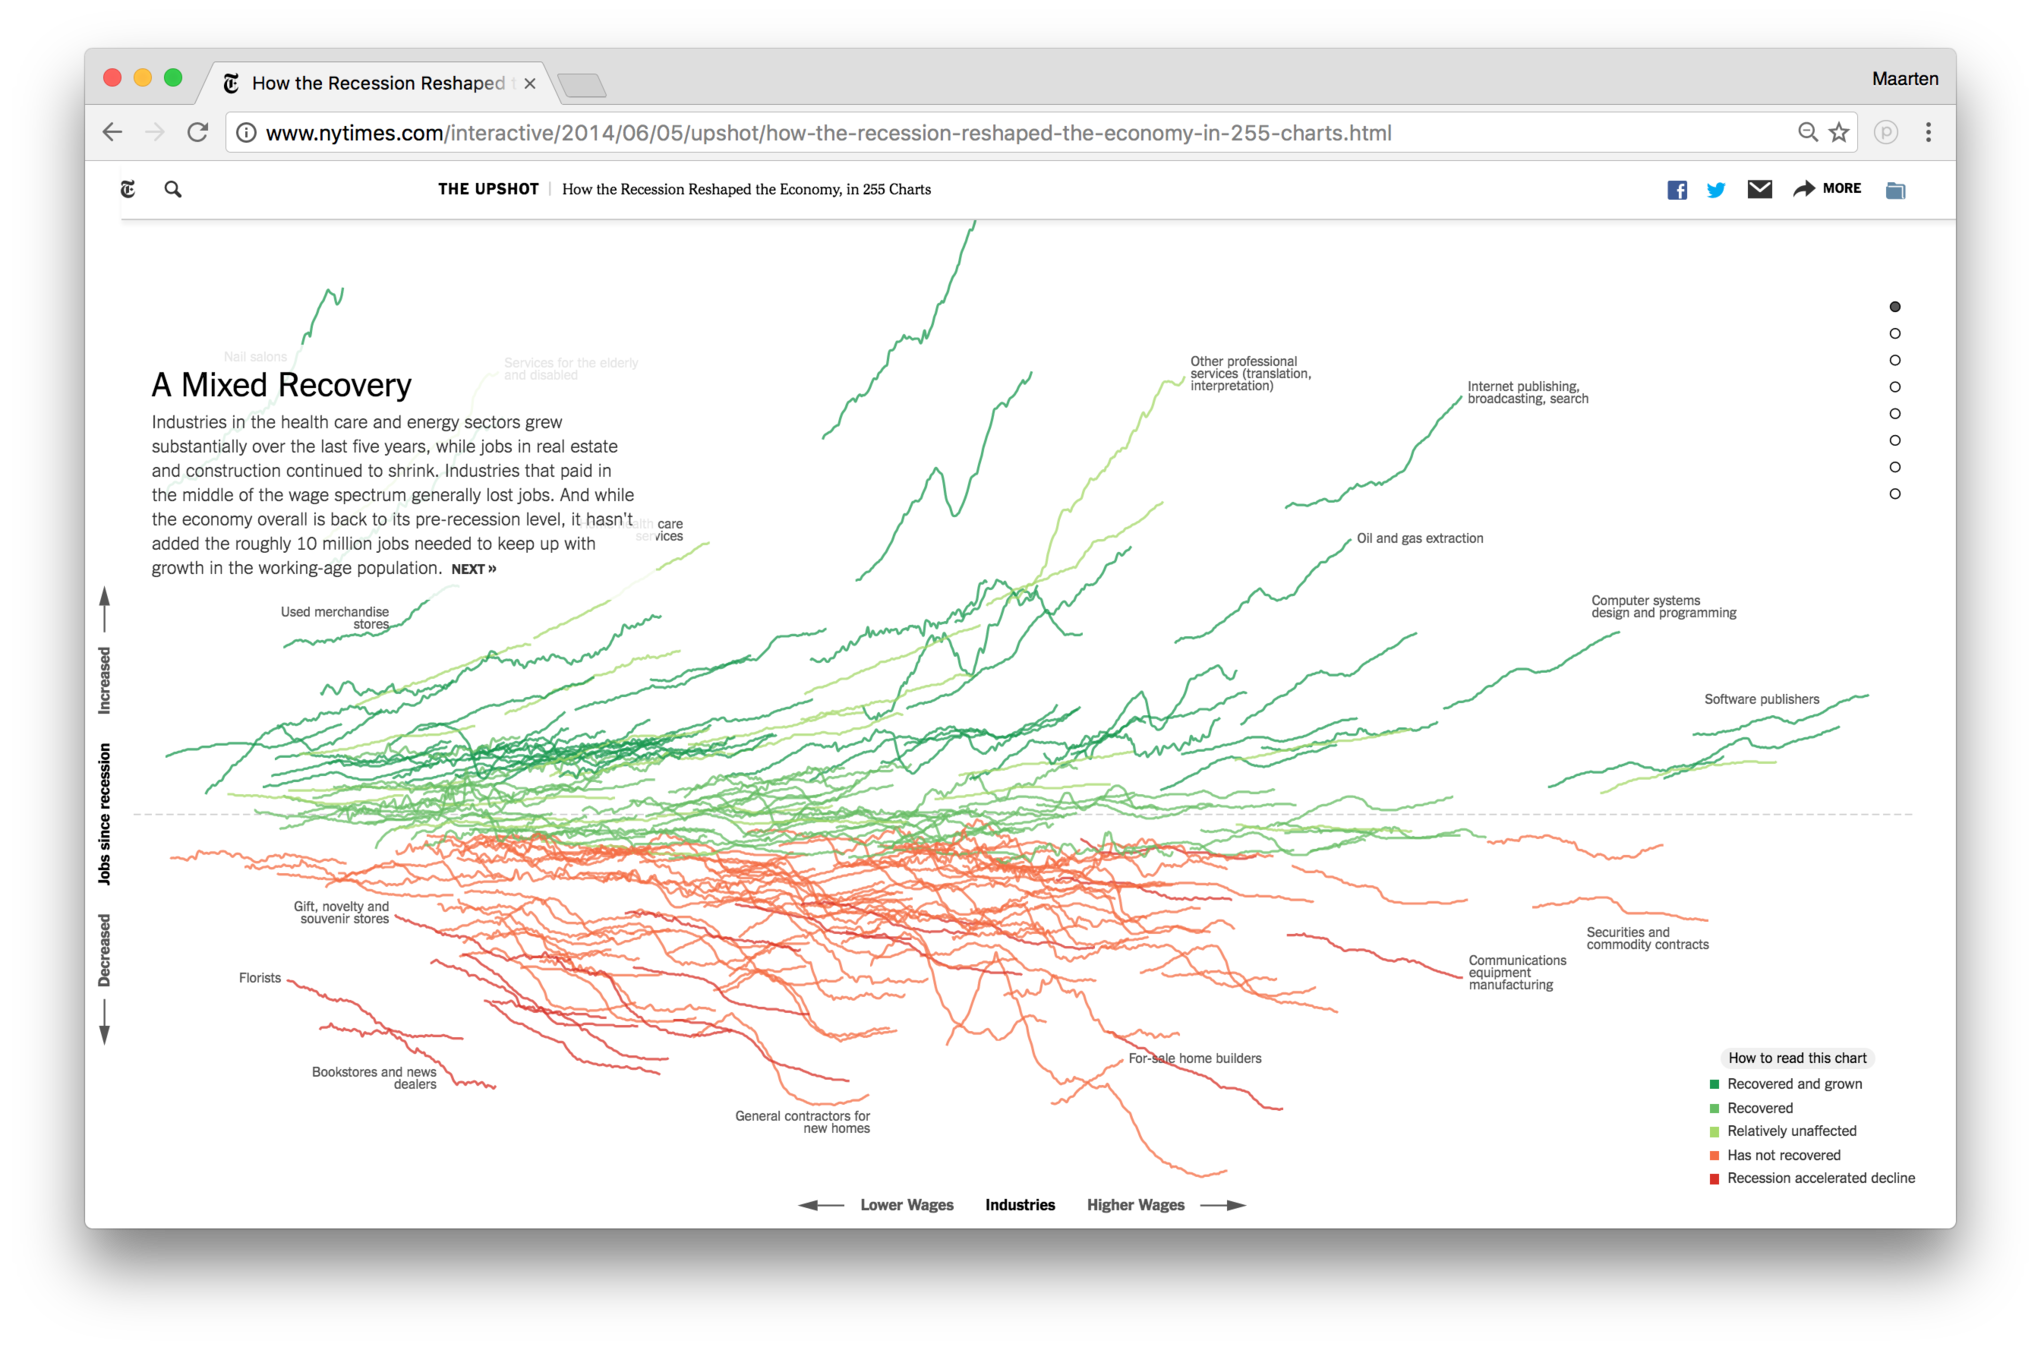
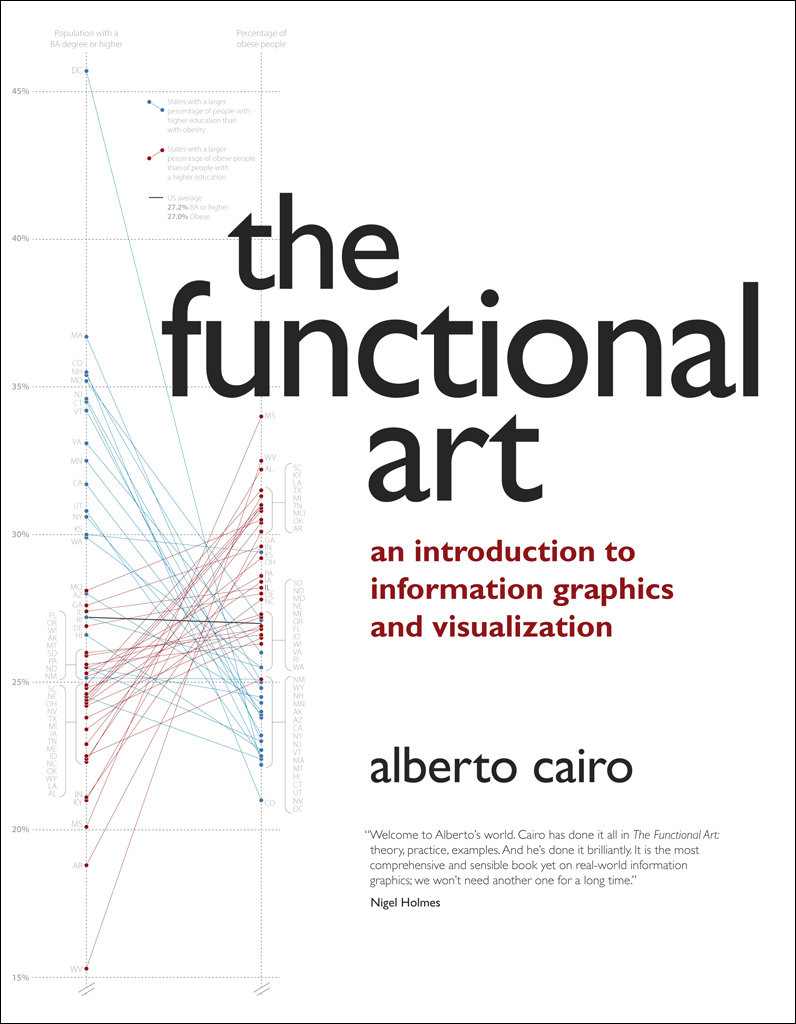
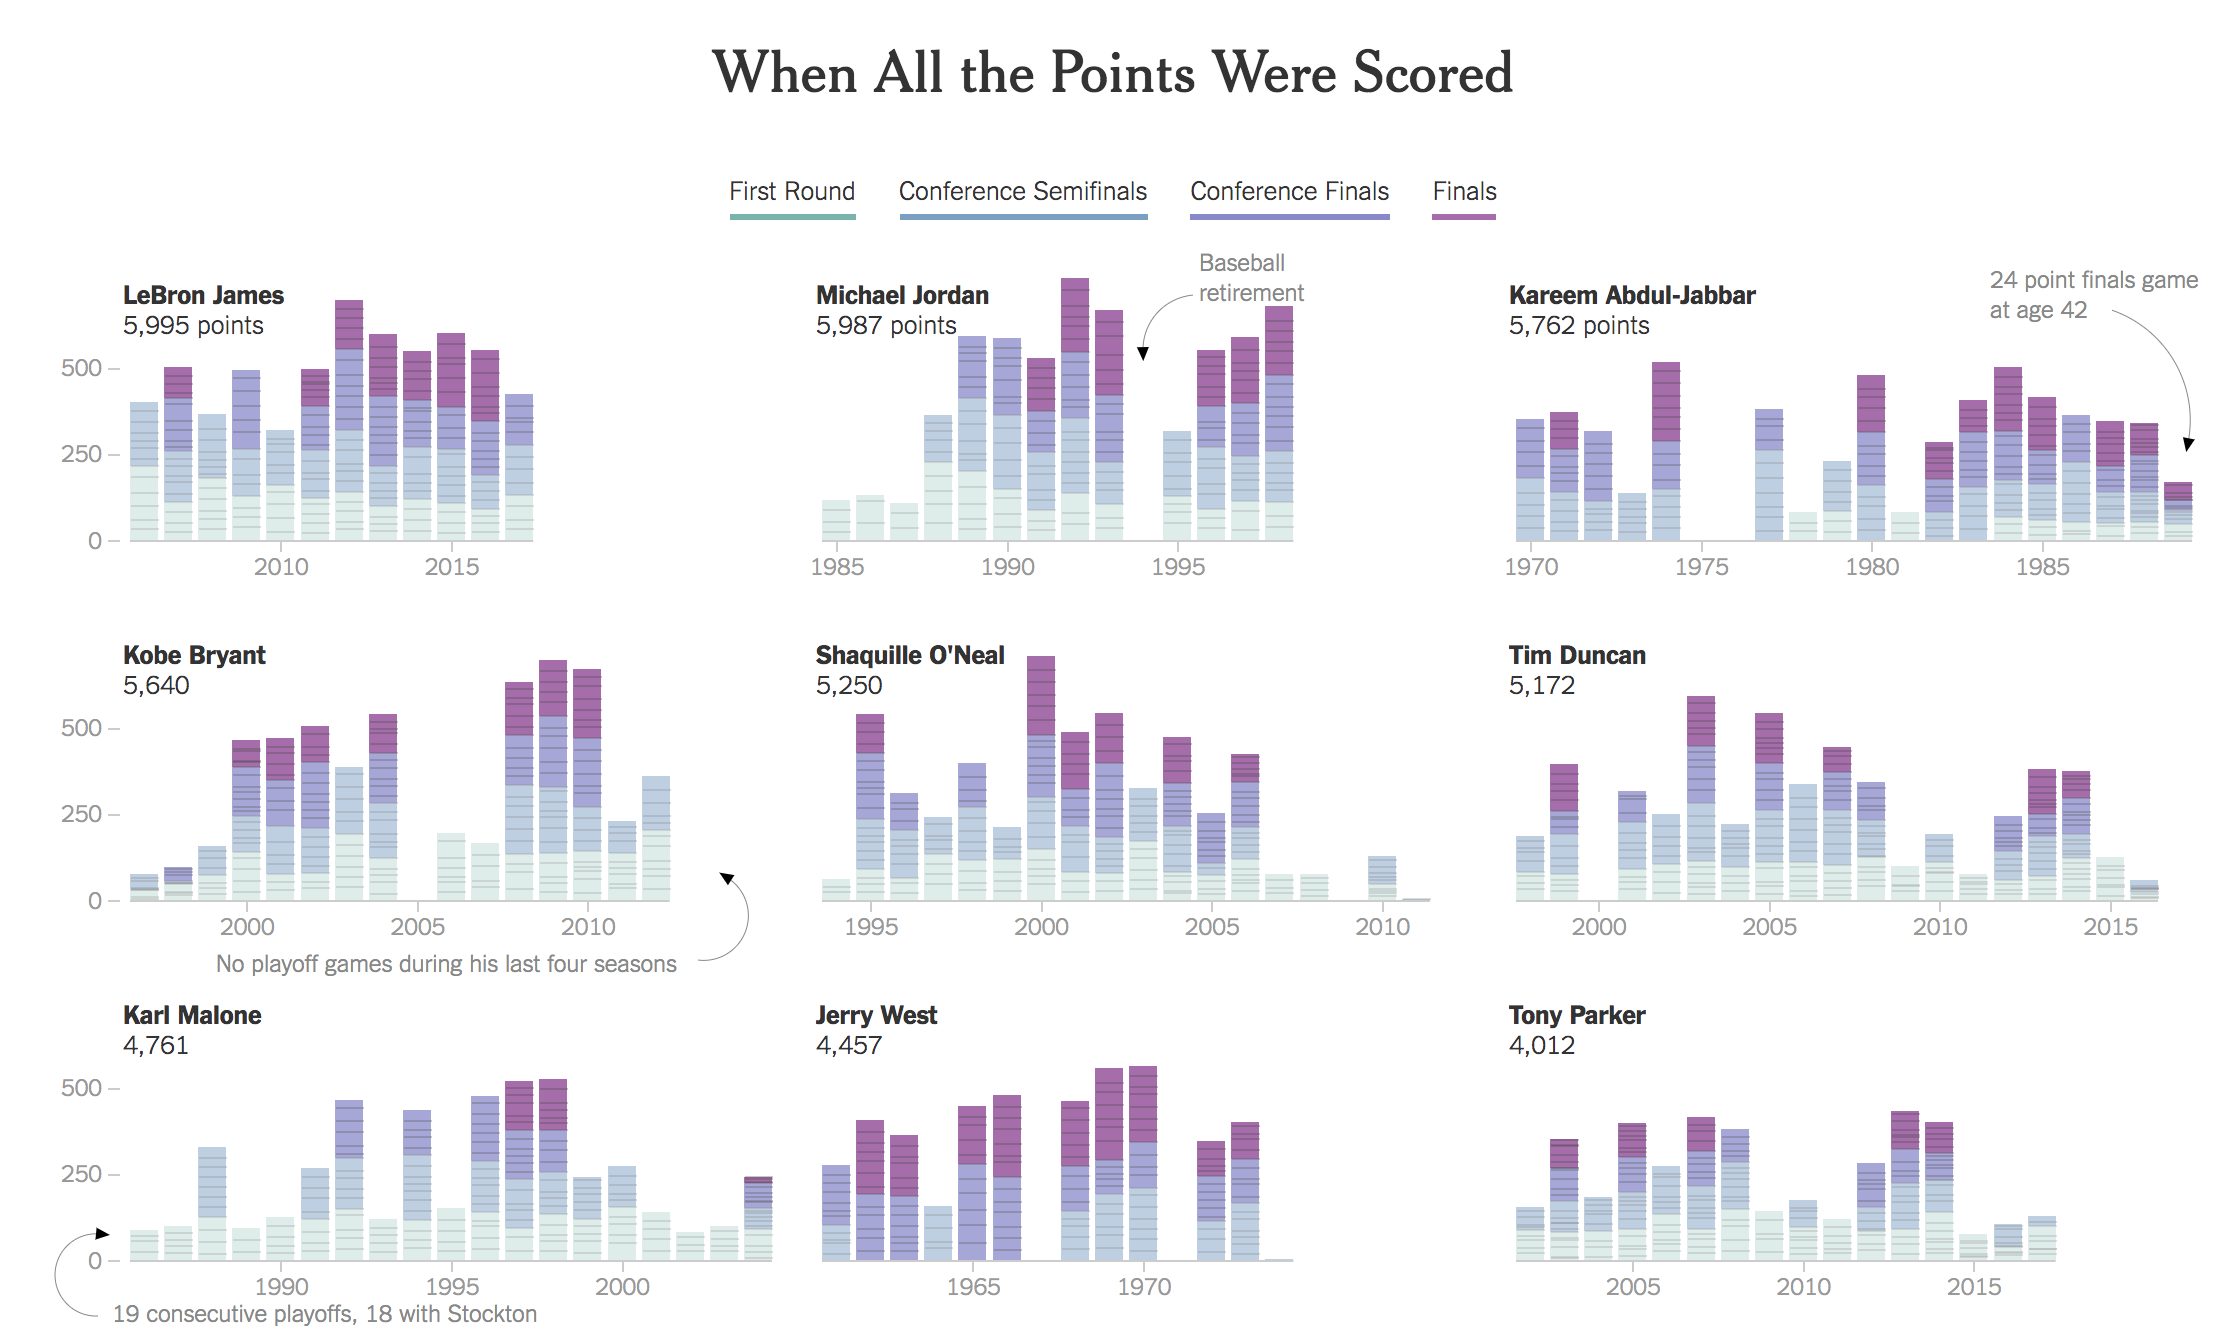
There's more than just bars and lines
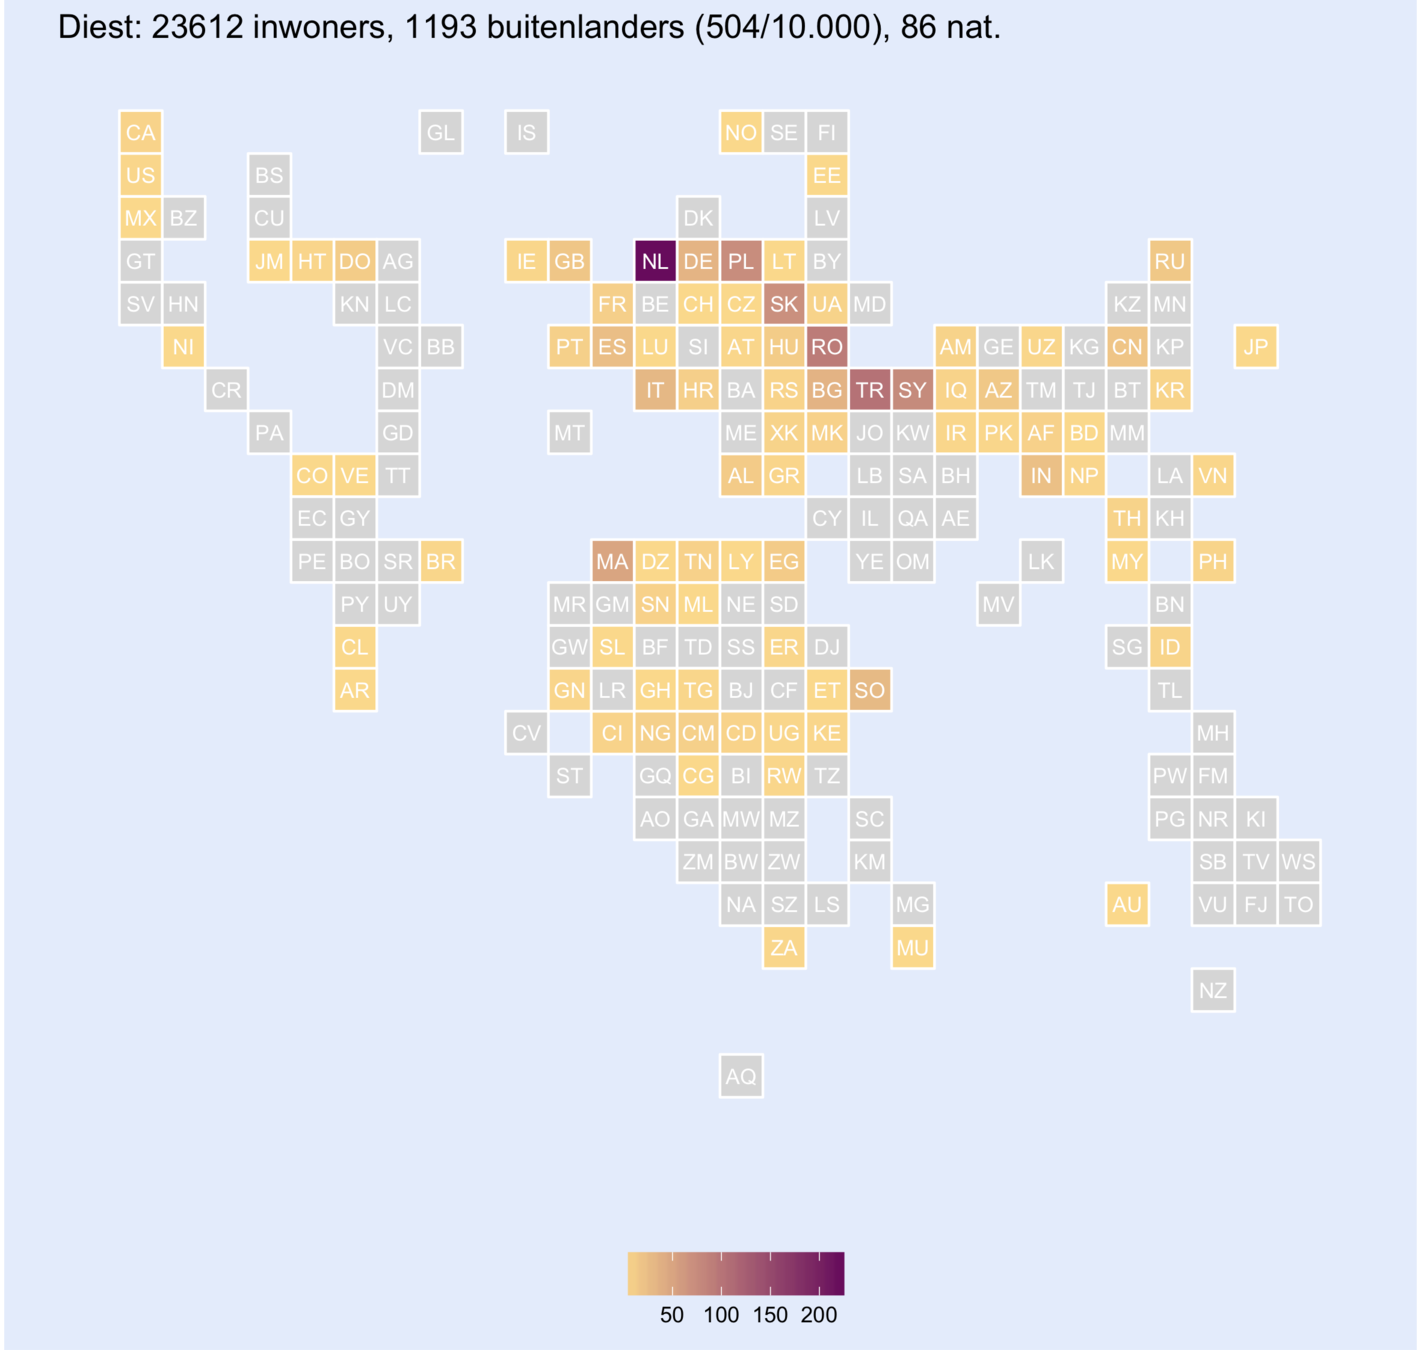
Dutch Dataviz
Data storytelling
Storytelling?
2016
- Globally, 0,99°C warmer than mid-20th century
- Hottest year on record since 1880
- 3 consecutive years set record
- Record low sea ice levels
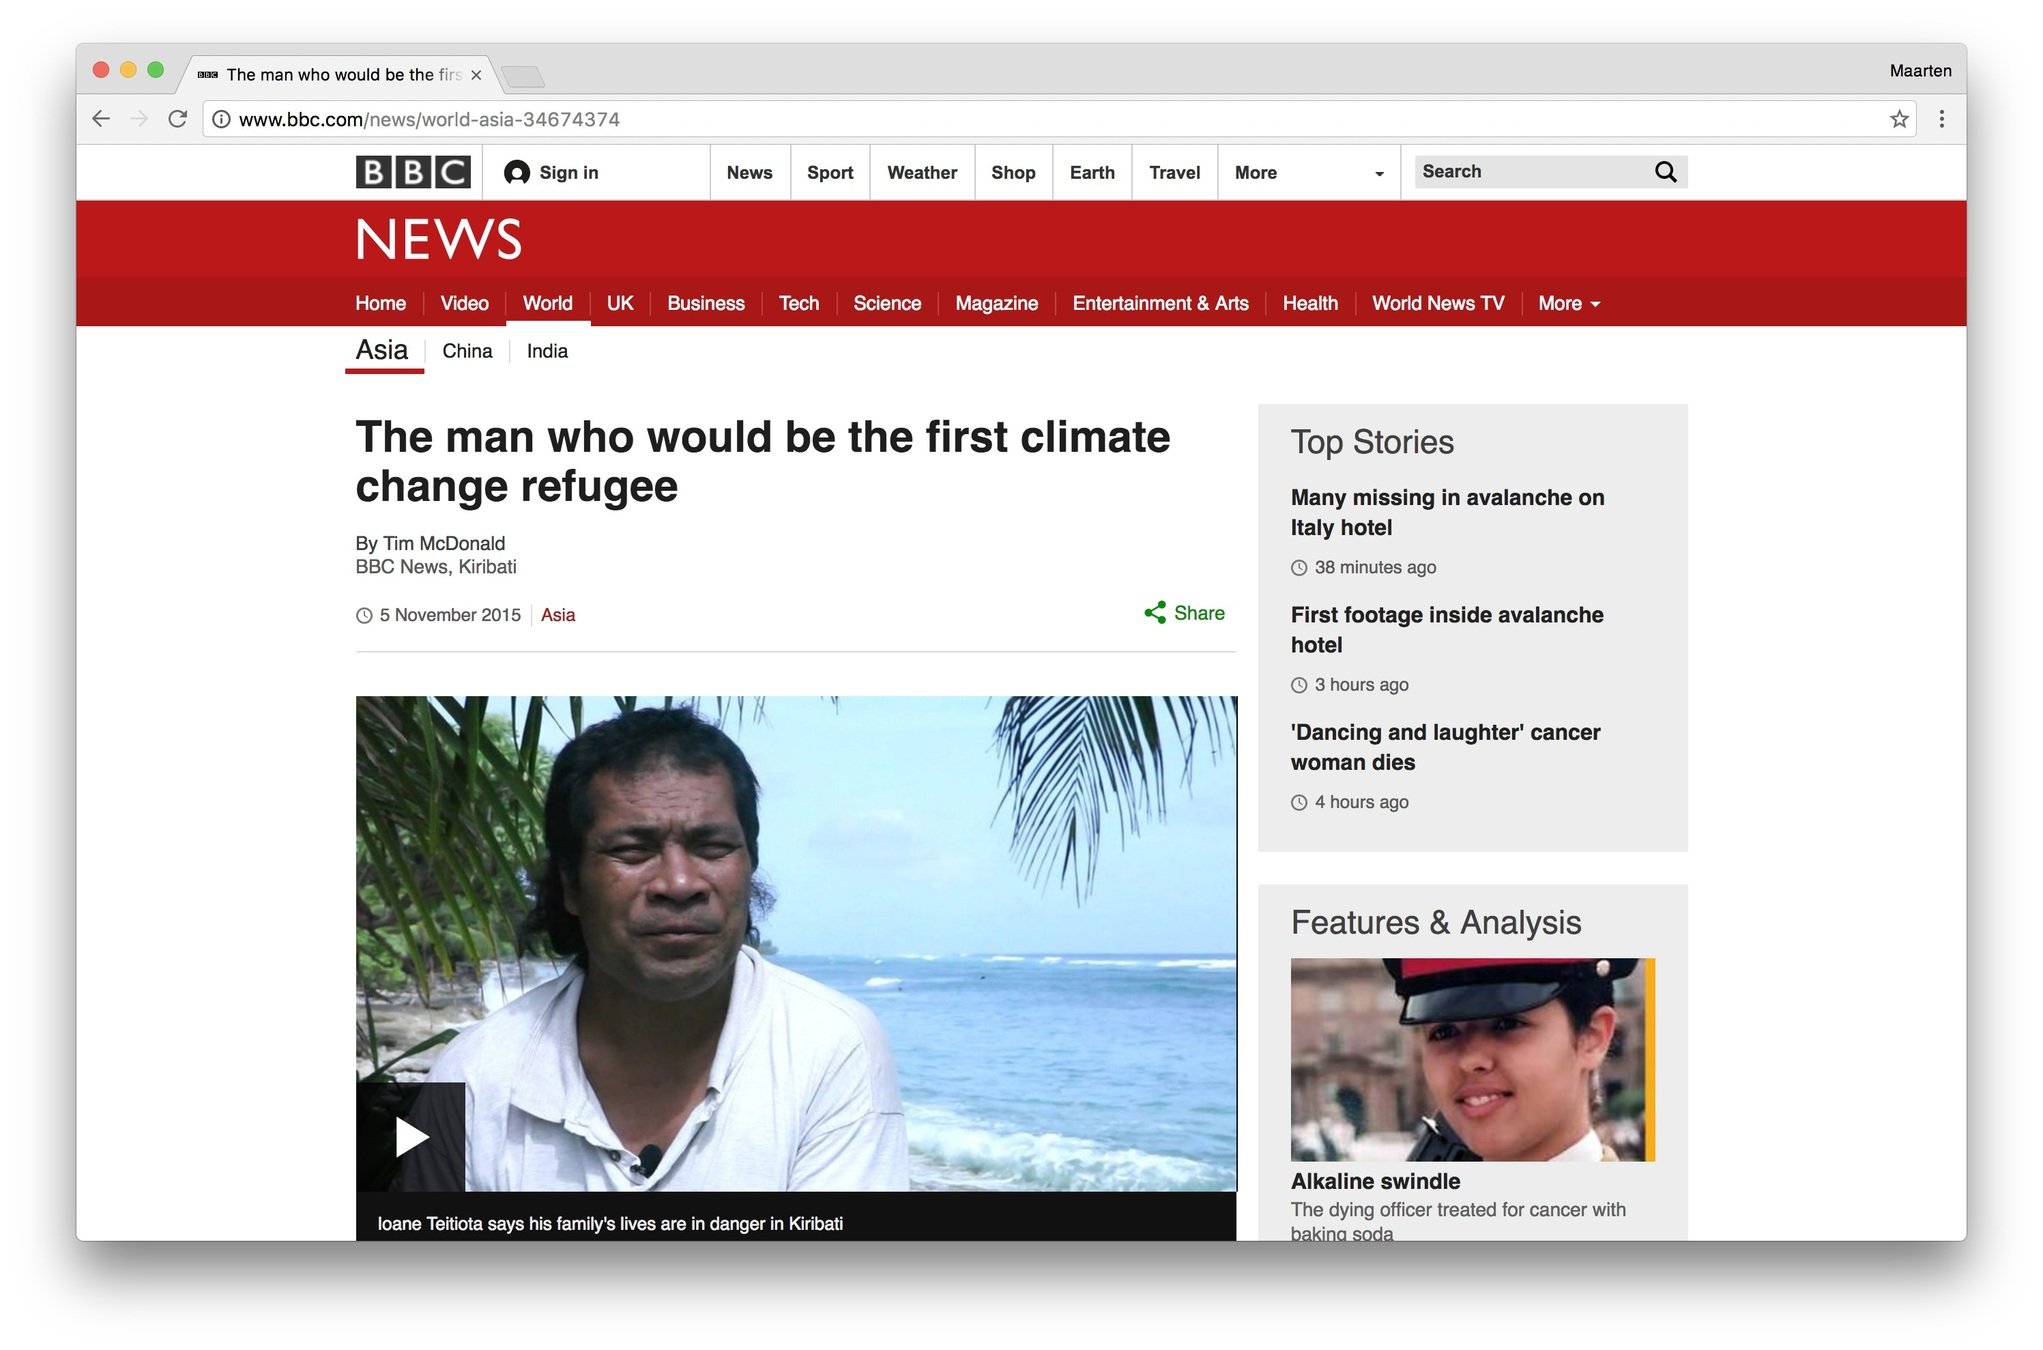
Stories are everywhere
Paintings, newspapers, games, novels, papers, fairytales, television, sports, religion, advertisement, theater, politics, science, poetry, manuals, ...
Through stories, we
Learn
Understand
Remember
Convey ideas
How?
Setting
Character
Event: cause and effect
Sensemaking
Connect with the audience


Take aways: storytelling
What is the story in your data?
Connect with your audience
Build it up:
Context, character, cause & effect
Sensemaking
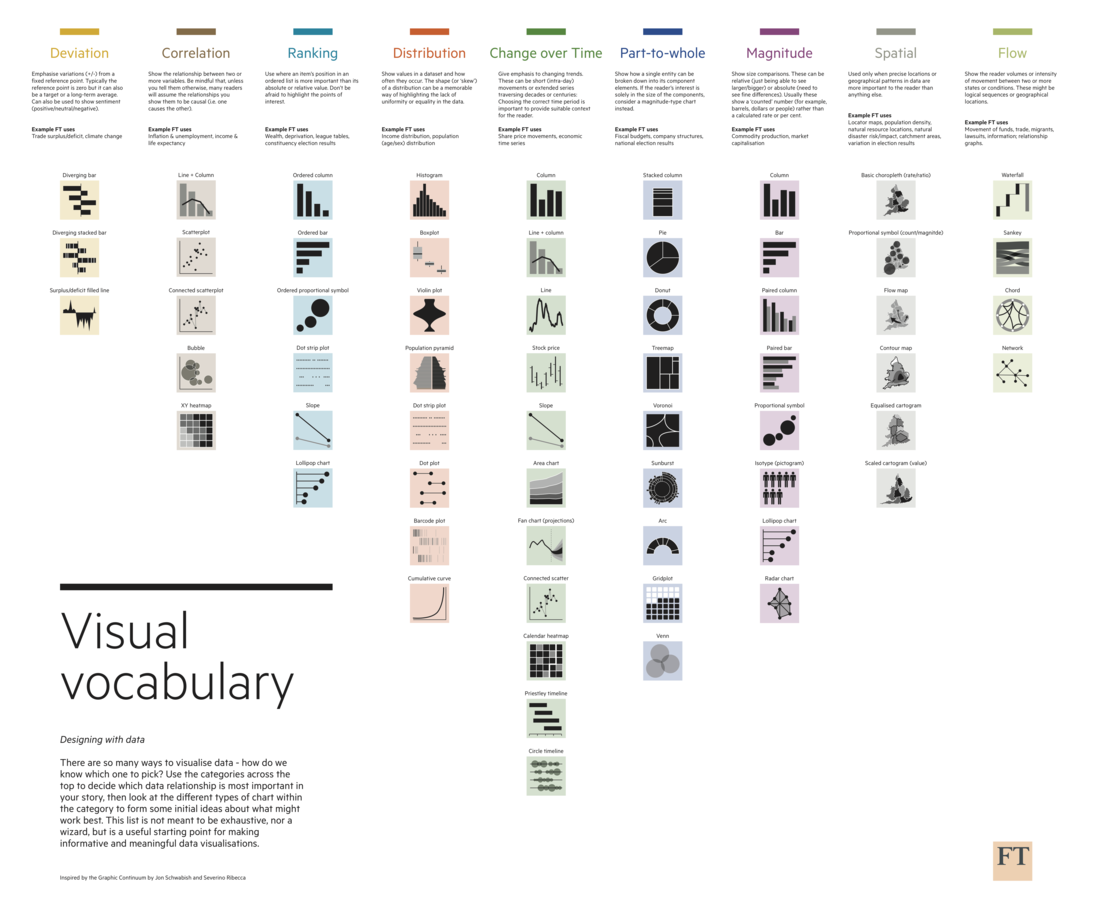
Take aways: visualization
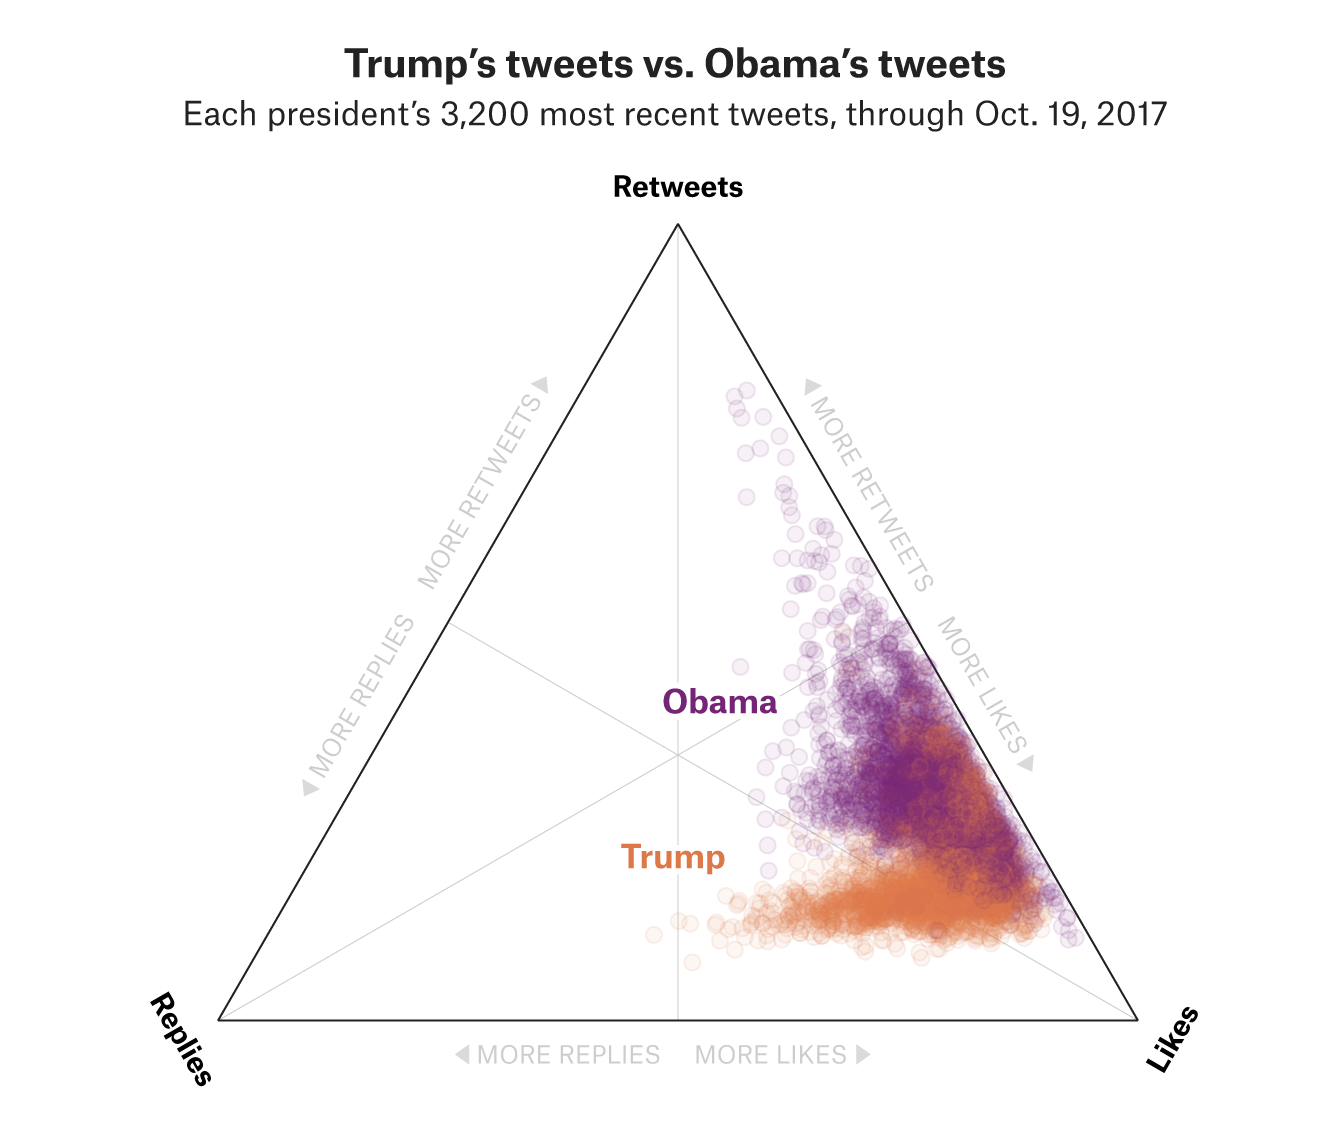
Go further than bars and lines
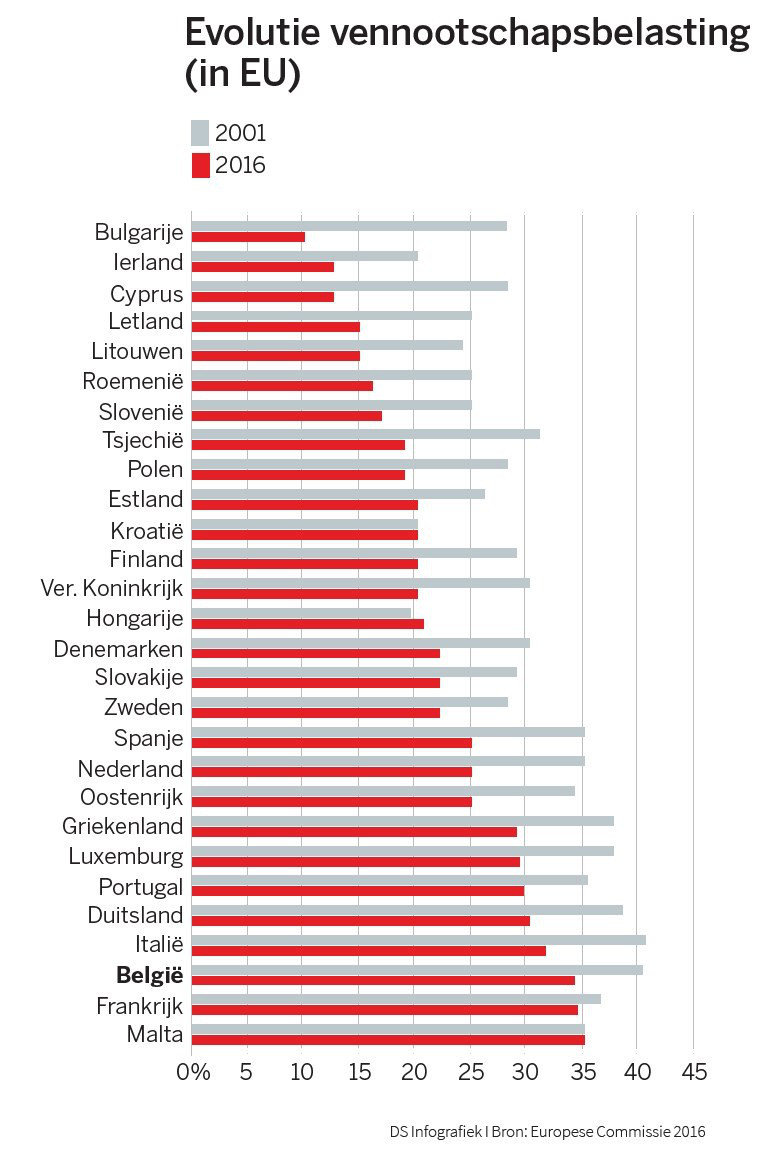
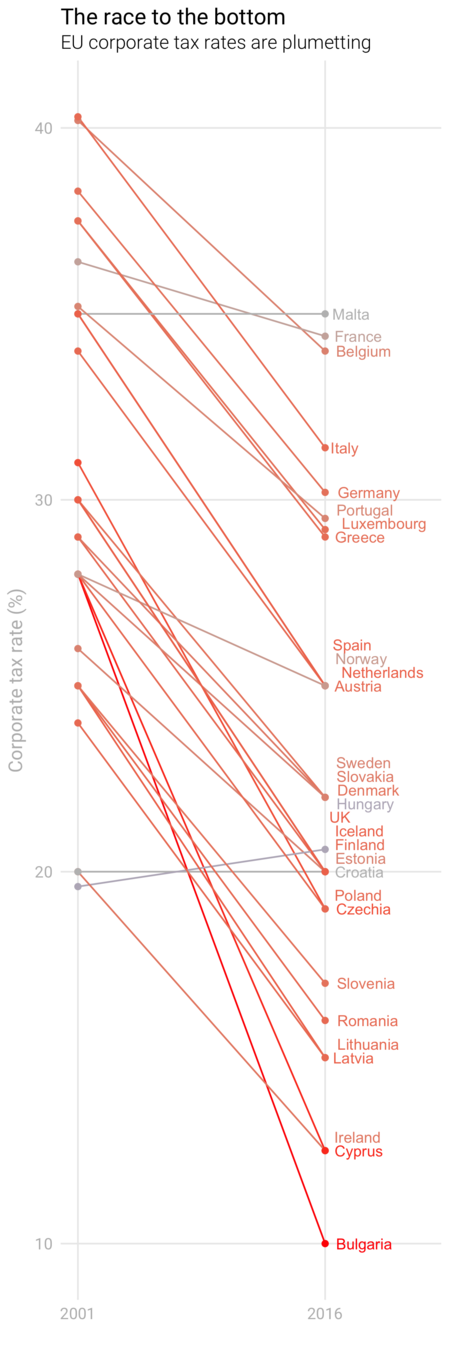
Choose charts appropriately
Guide your readers:
Annotate your charts
Use color wisely
Start telling the story with the title
Thanks!
Eyeon Inspiration Lunch
By maartenzam


