Datavisualisatie en datastorytelling
15 maart 2017
@maartenzam
Intracto
Dataviz 101
Data stories Galore
Datavisualisatie
I
"As knowledge increases amongst mankind, and transactions multiply, it becomes more and more desirable to abbreviate and facilitate the modes of conveying information from one person to another, and from one individual to the many."
William Playfair, 1786
"Everything that can be expressed in numbers can be represented by lines."
John Playfair


Waarom visualiseren?


Het Geheim
De vroege waarneming
868888609462834719714449648
122286651978794222484779908
939340243123007392183390116
351684124962334339709749742
            868888609462834719714449648
122286651978794222484779908
939340243123007392183390116
351684124962334339709749742


10 valkuilen
en hoe ze te ontwijken


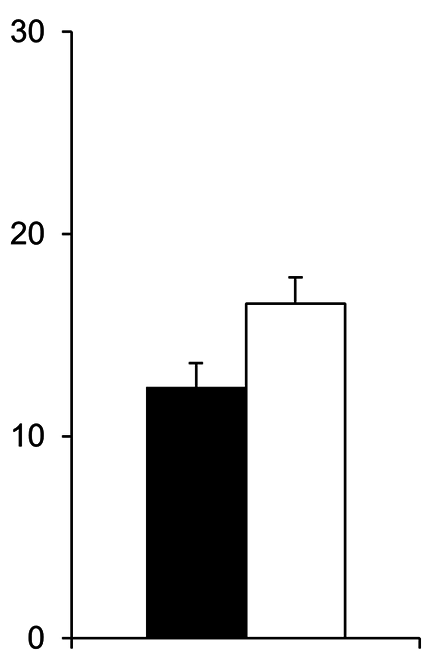
1. Don't cut bars


2. Don't cut time


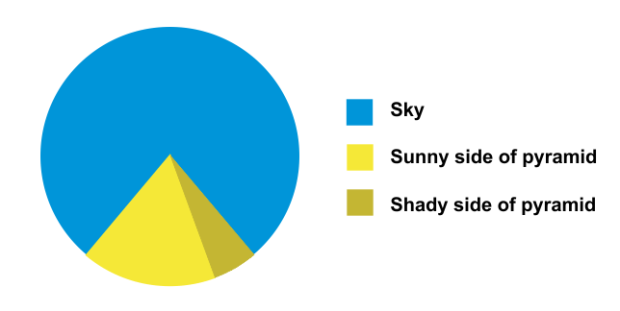


4. Don't square the pies


5. Label directly


6. Deliberate colors


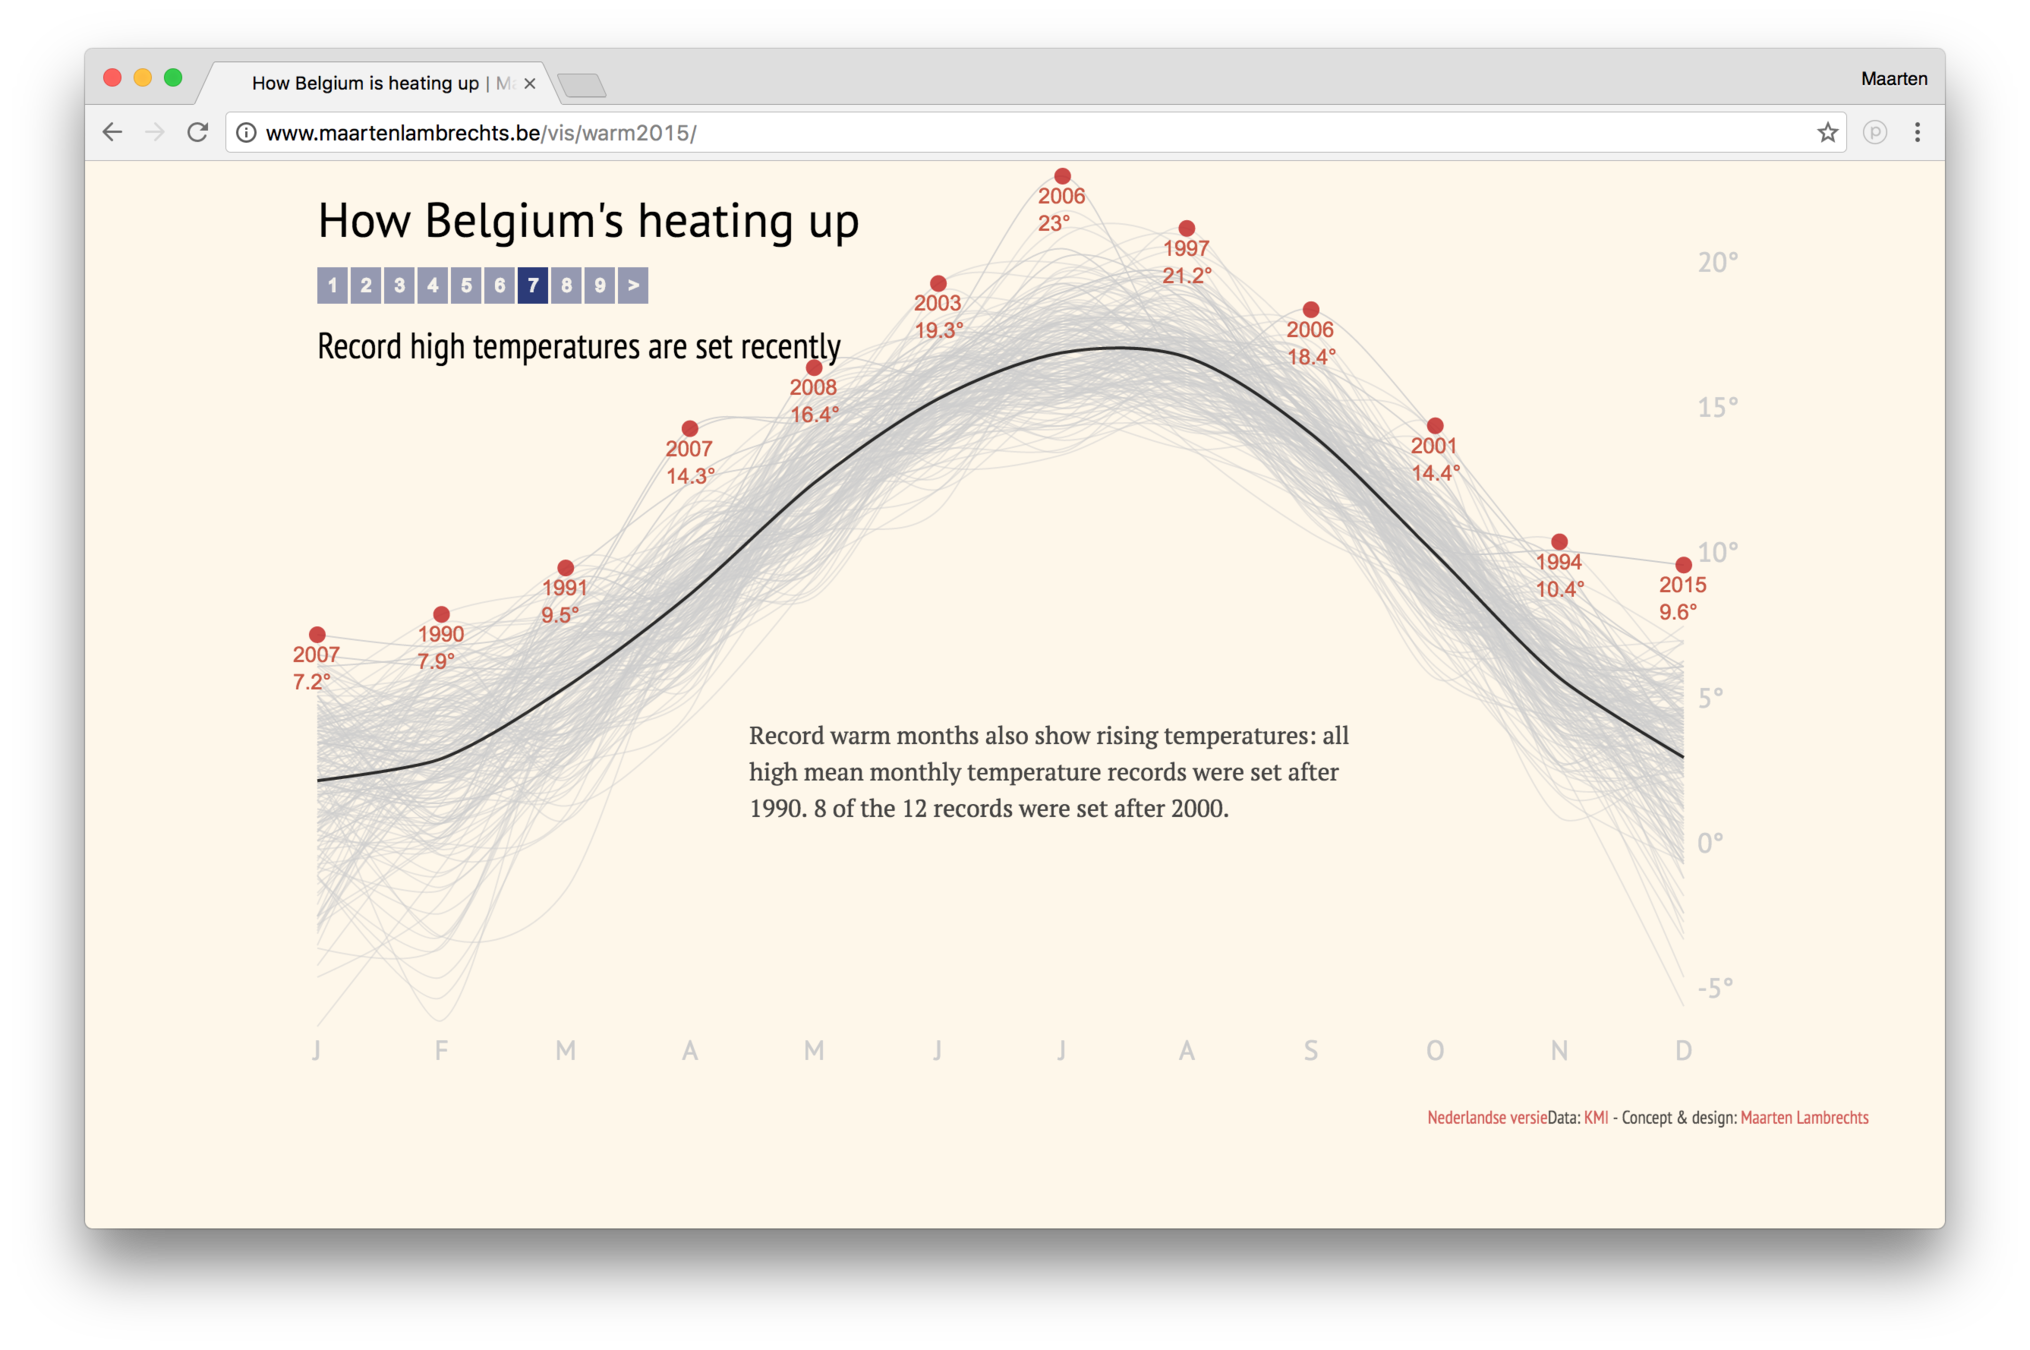
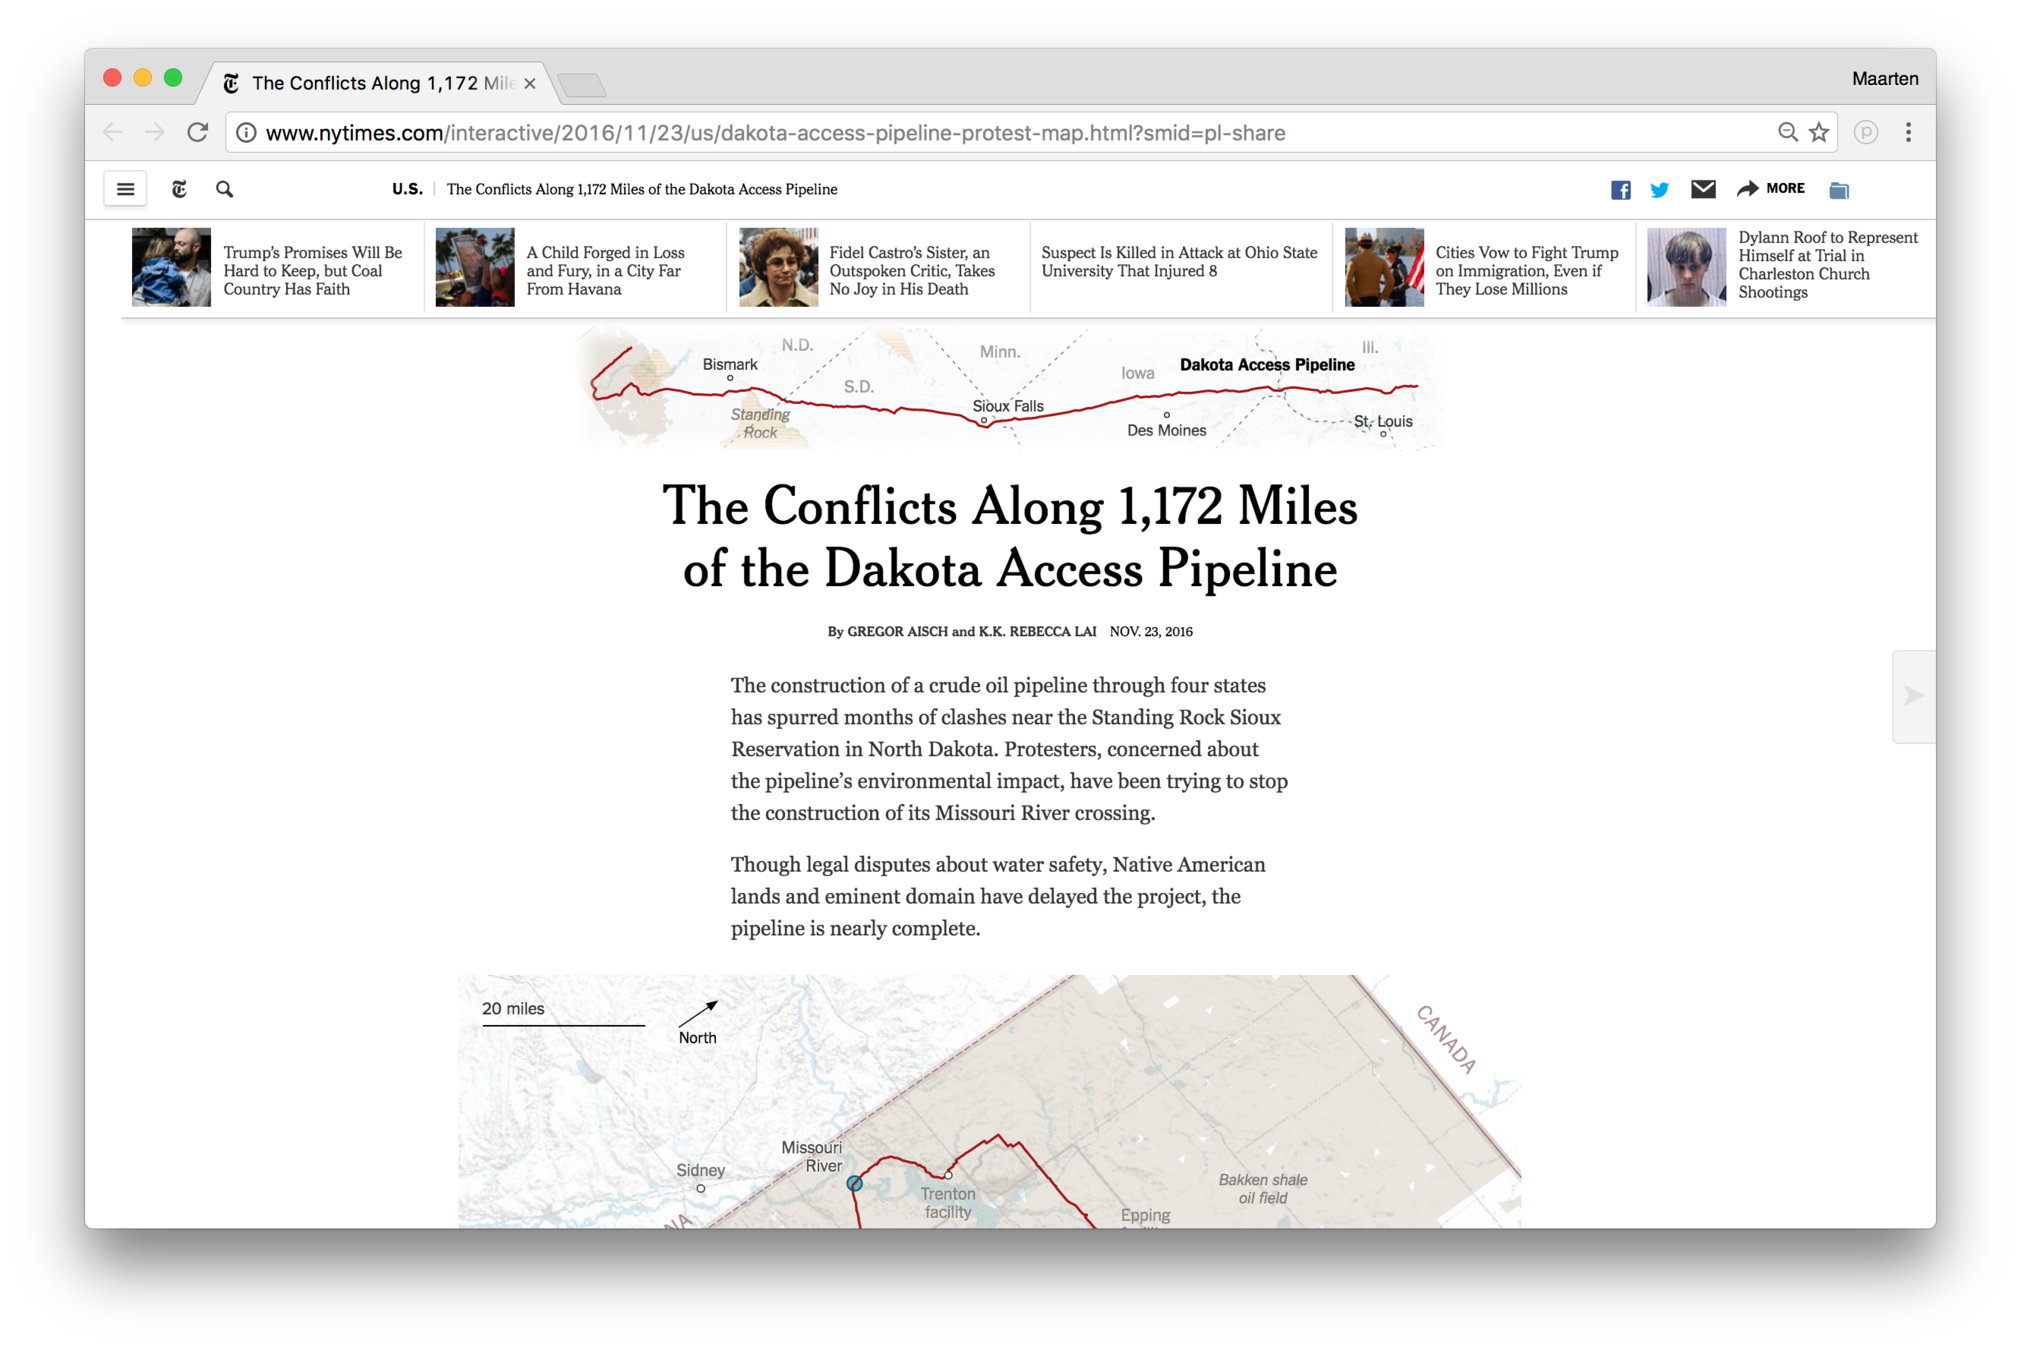
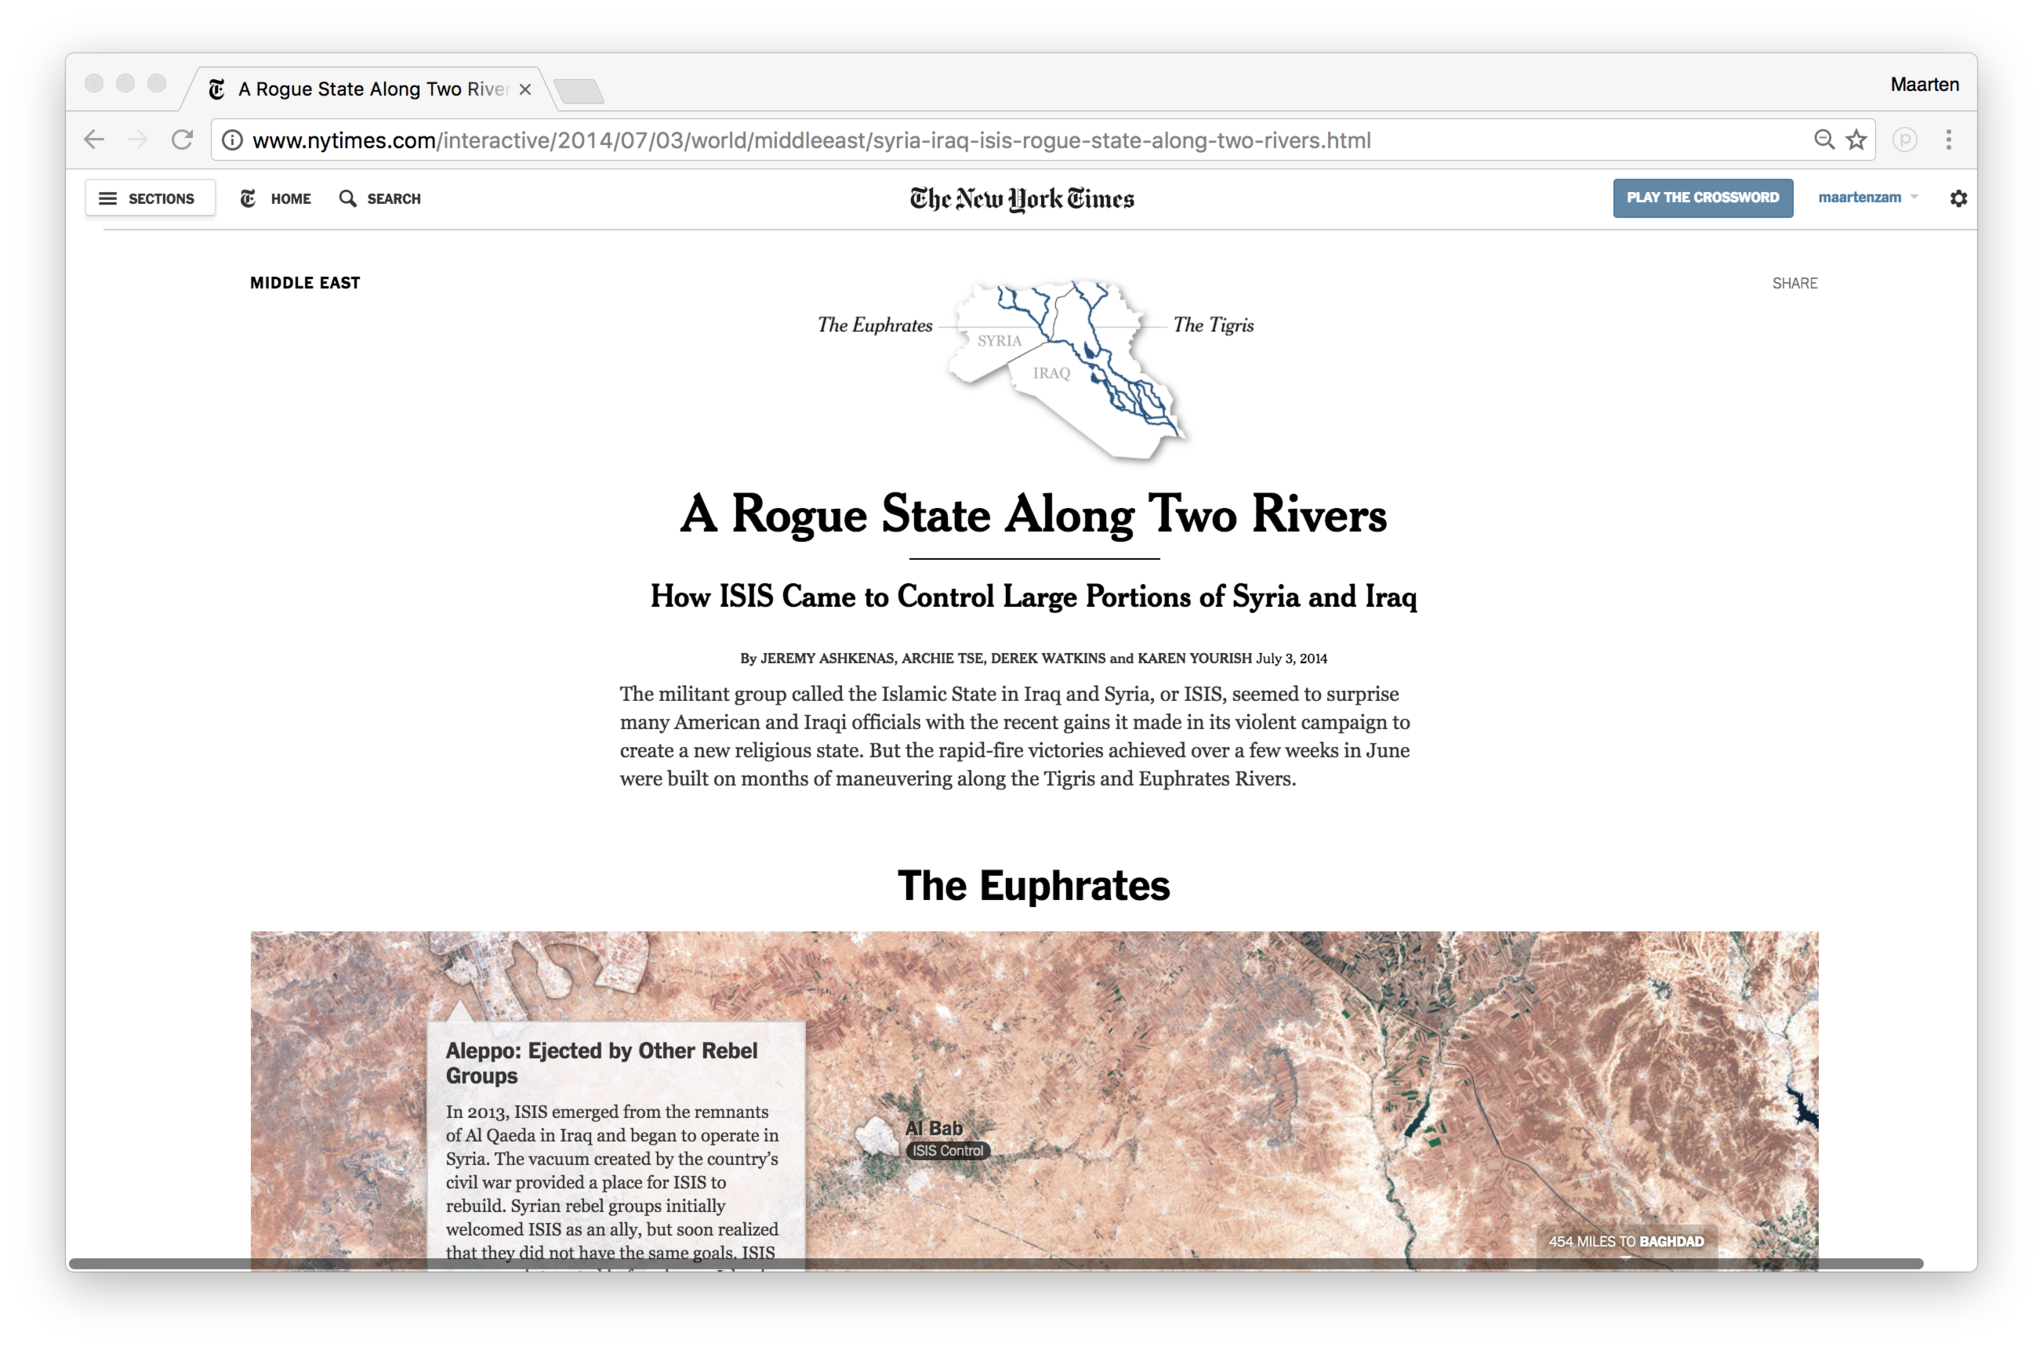
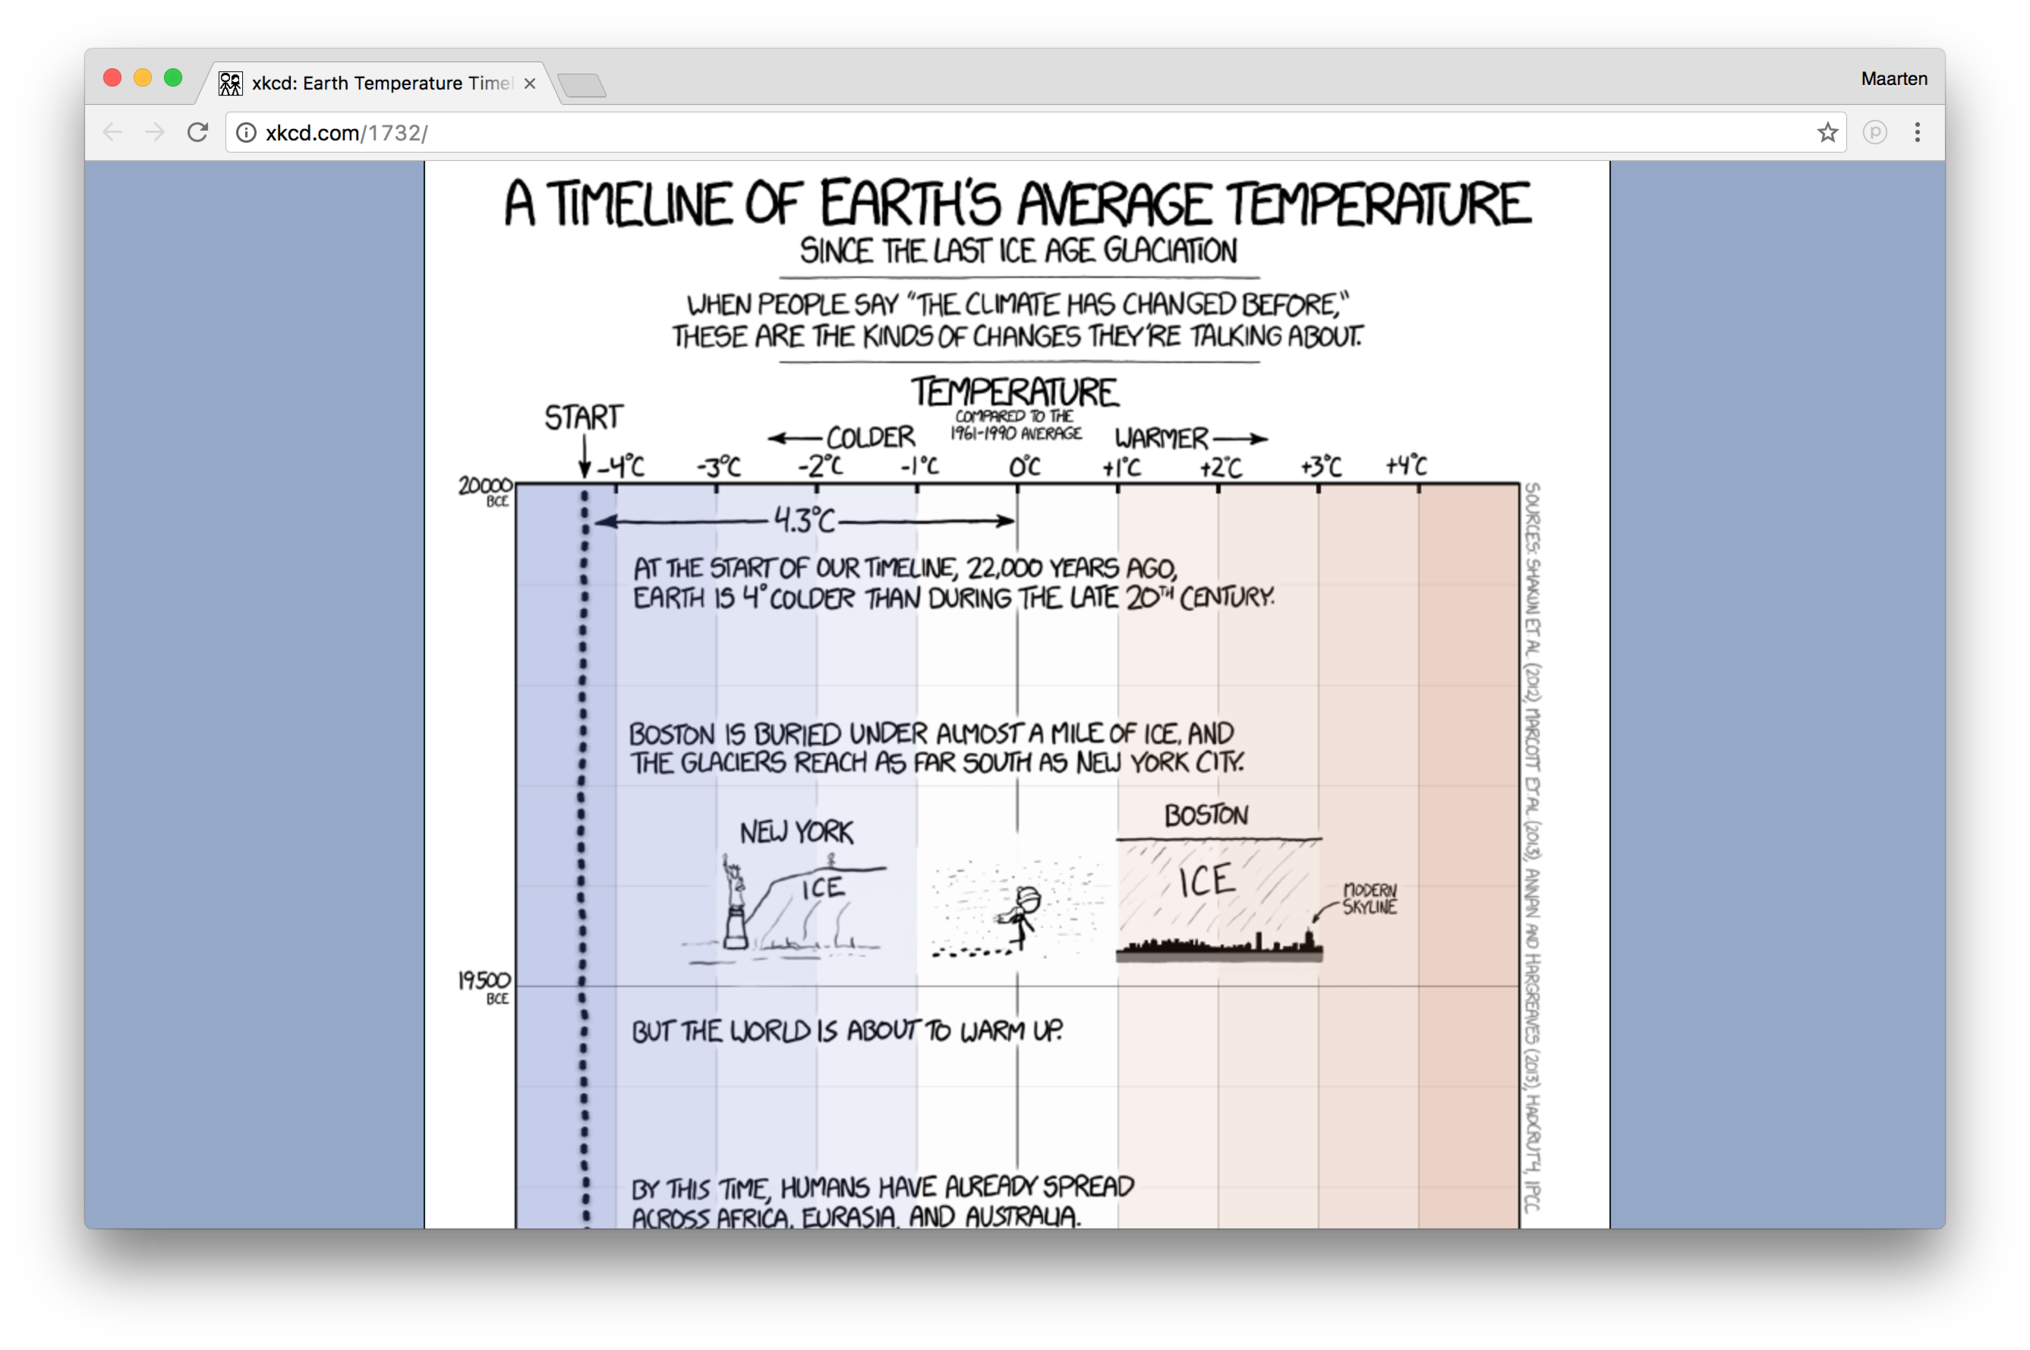
7. Tell the story


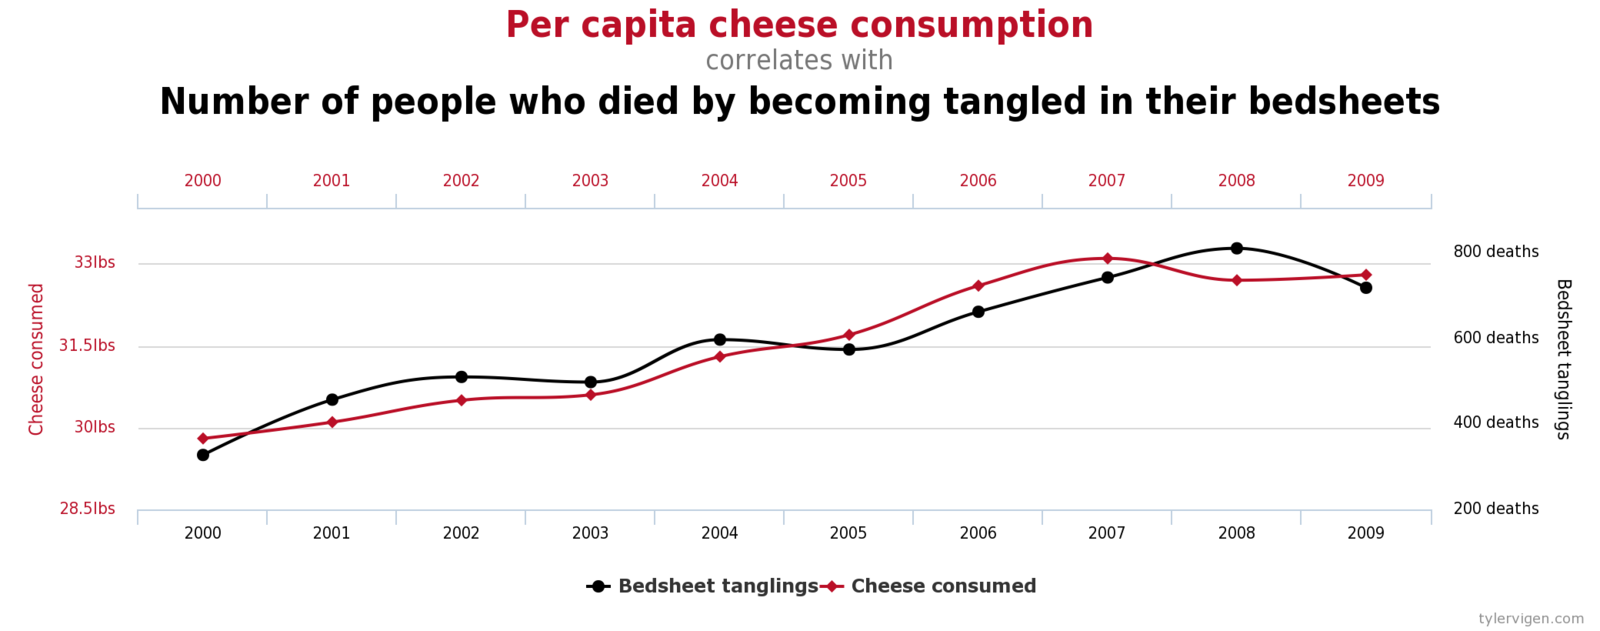
8. Double the axes, double the mischief
And correlation is not causation


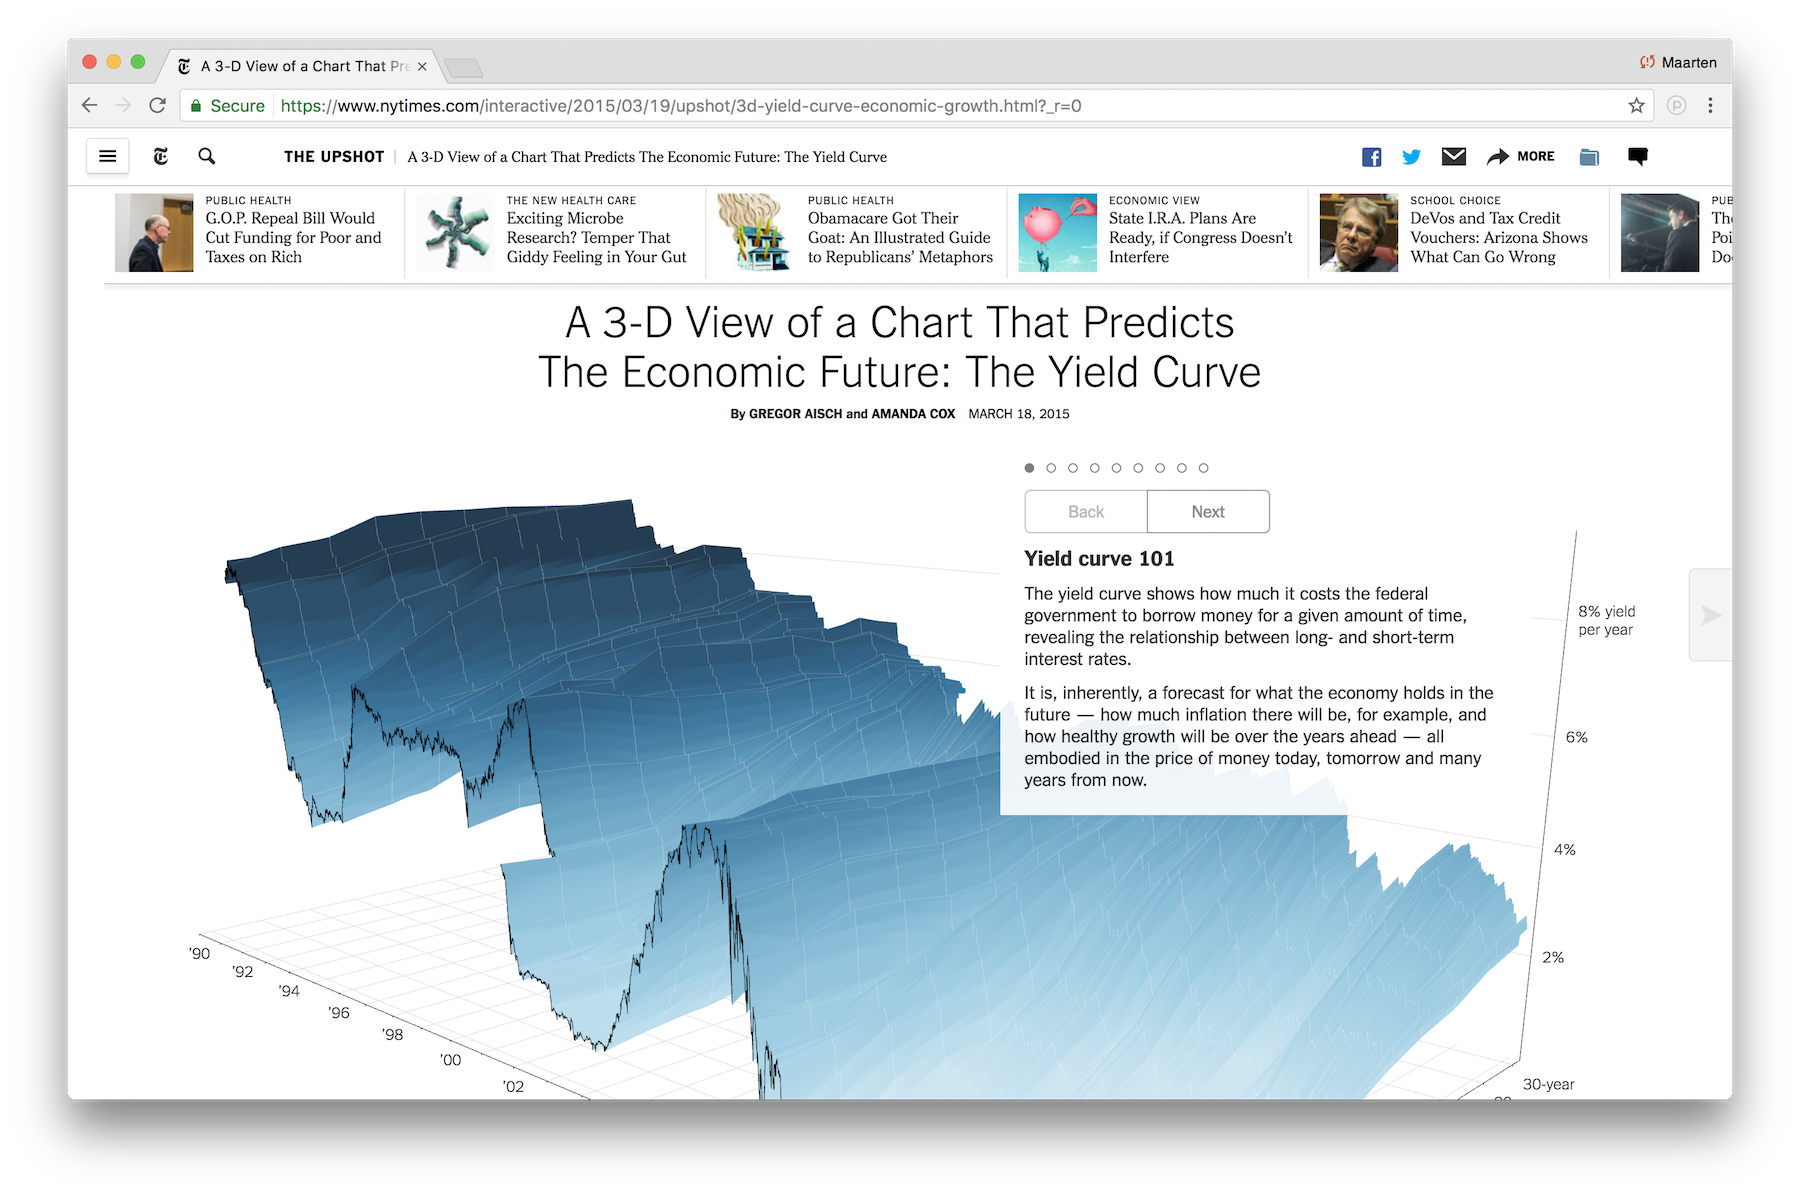
9. Don't do 3D
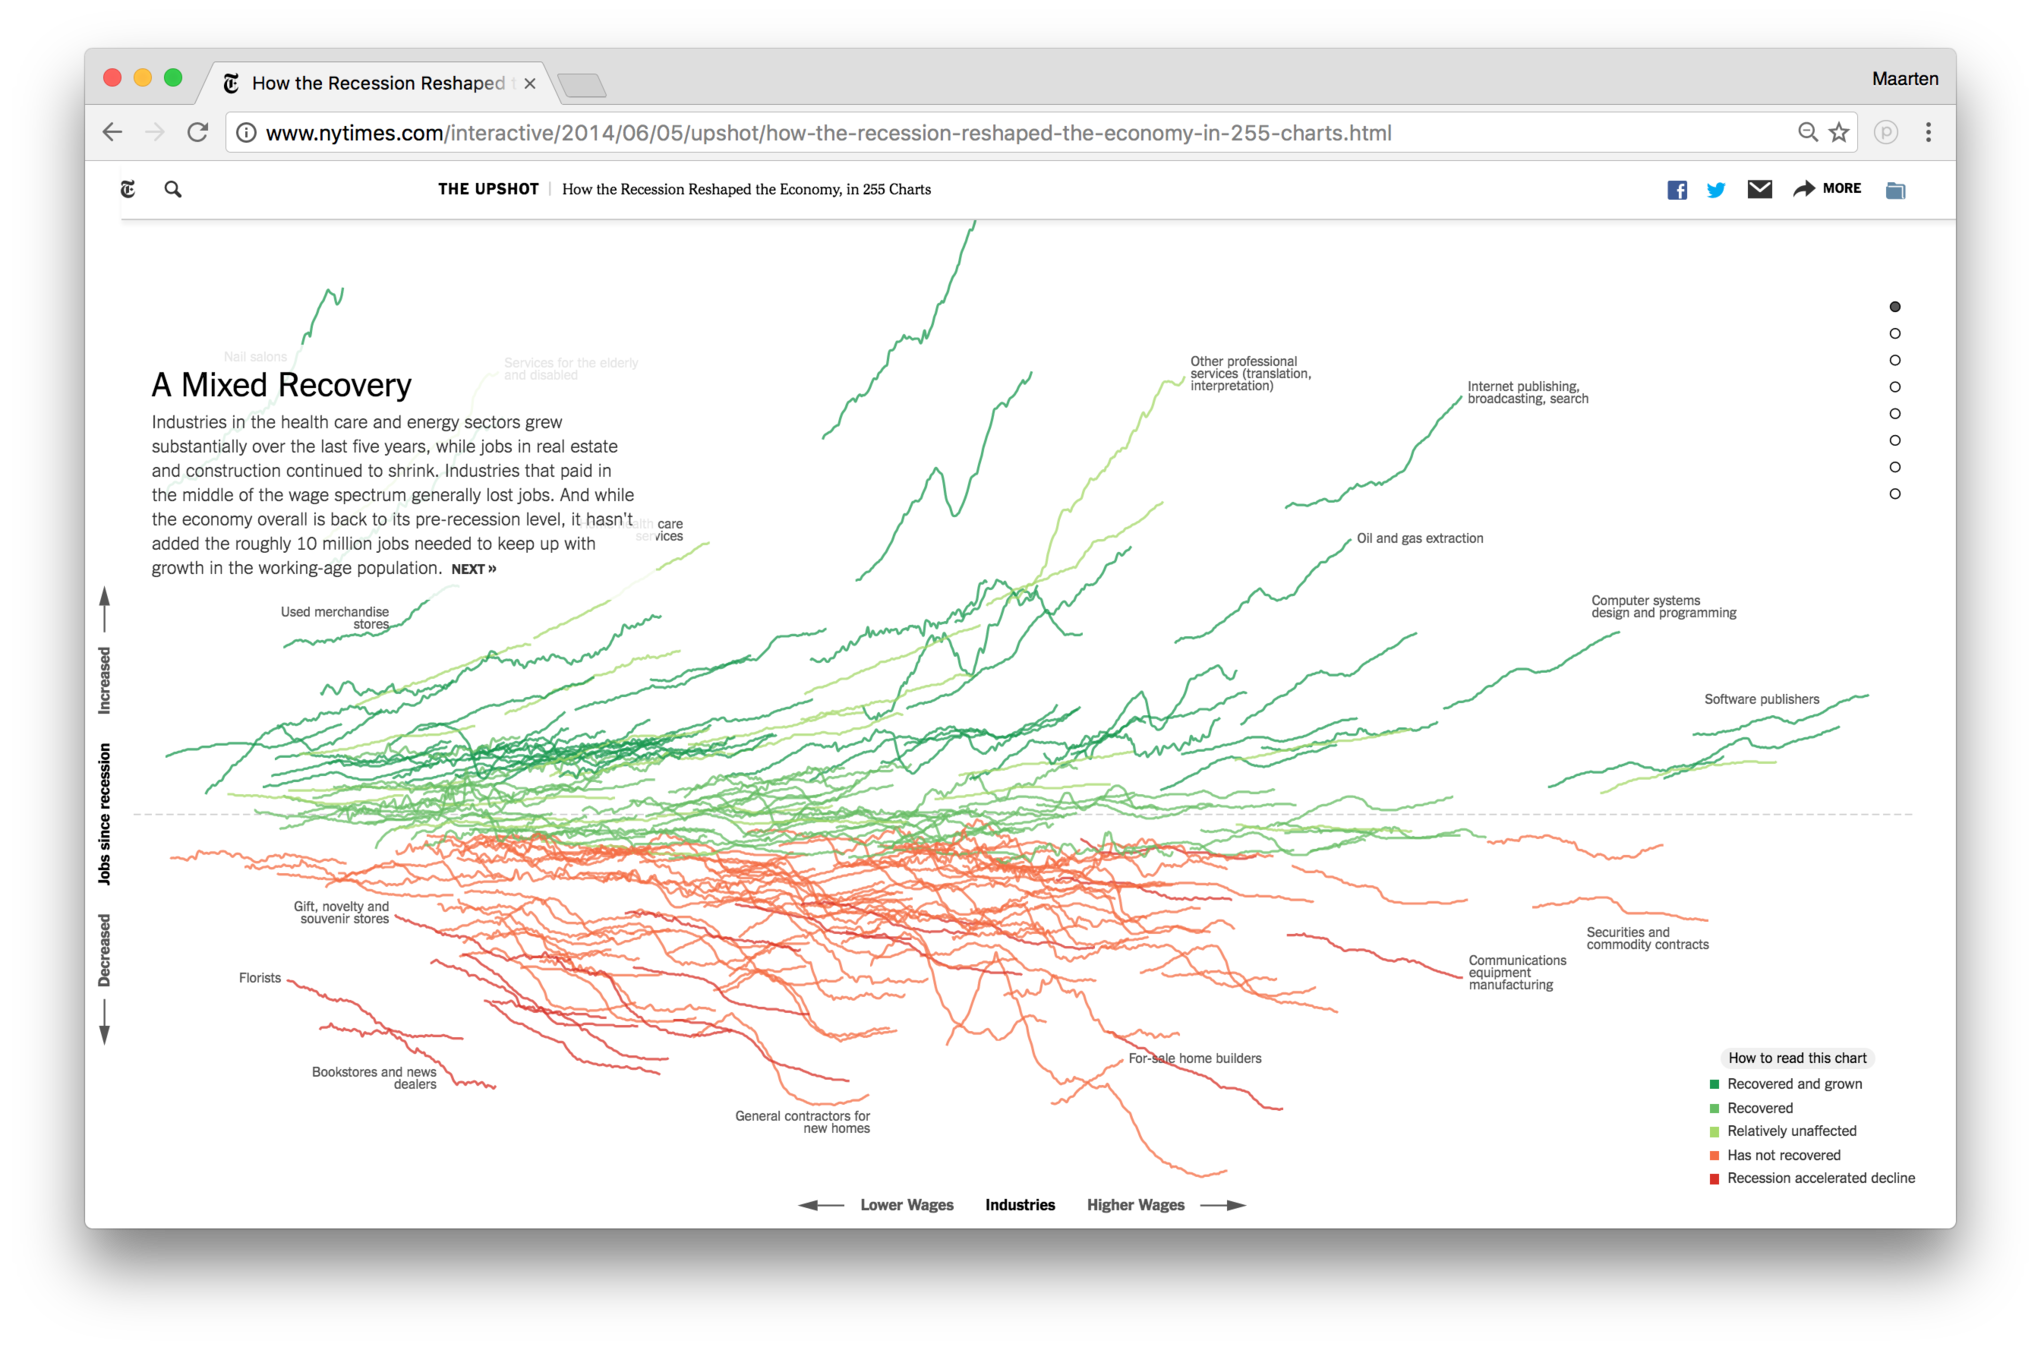
Except when you're the New York Times
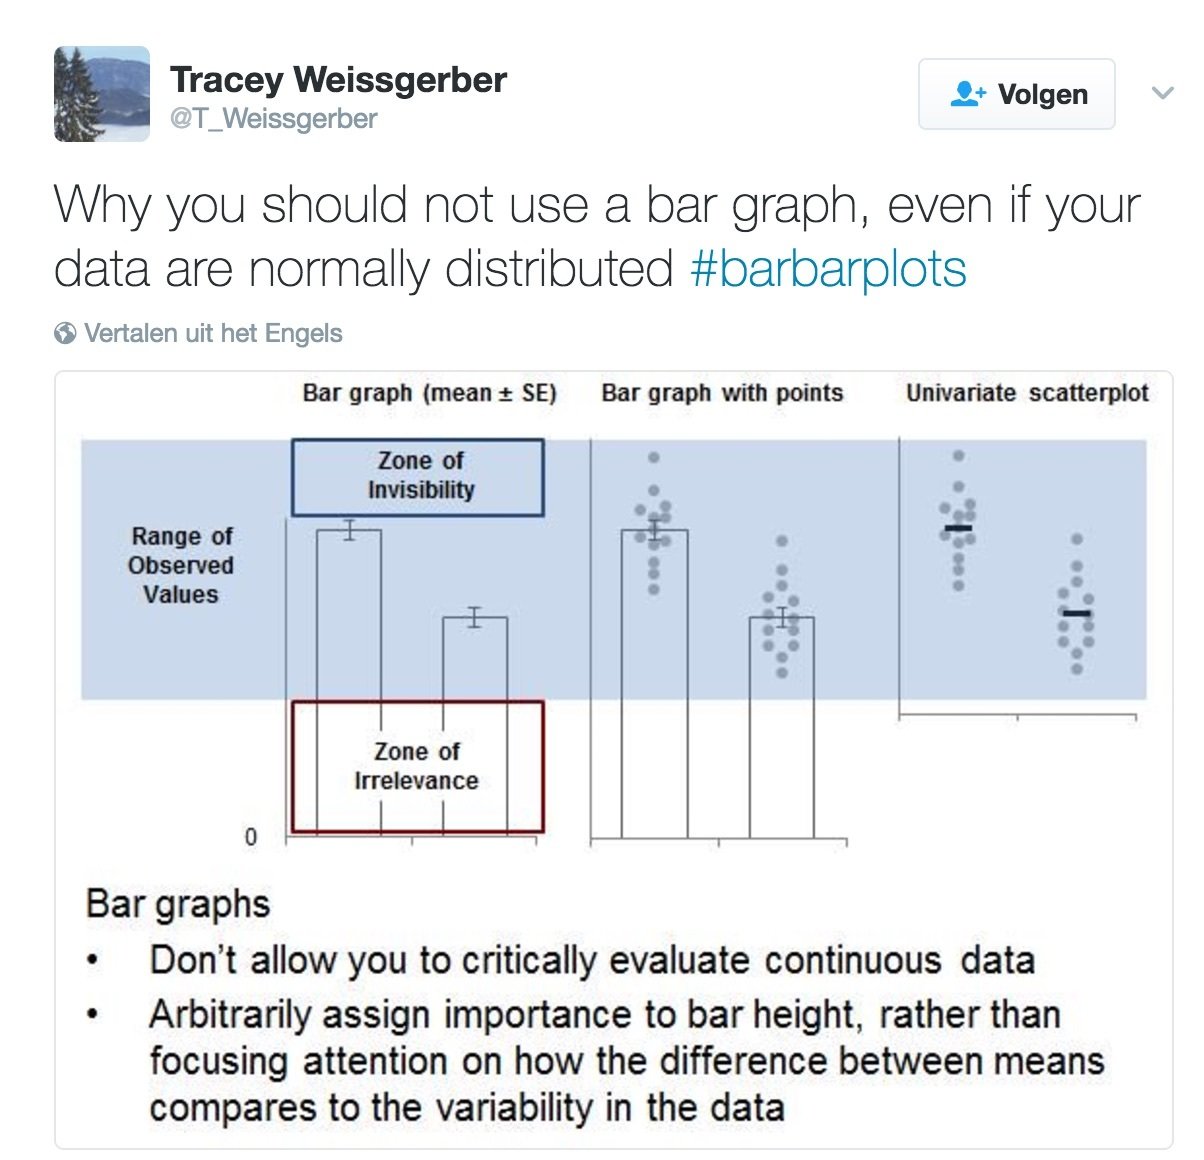
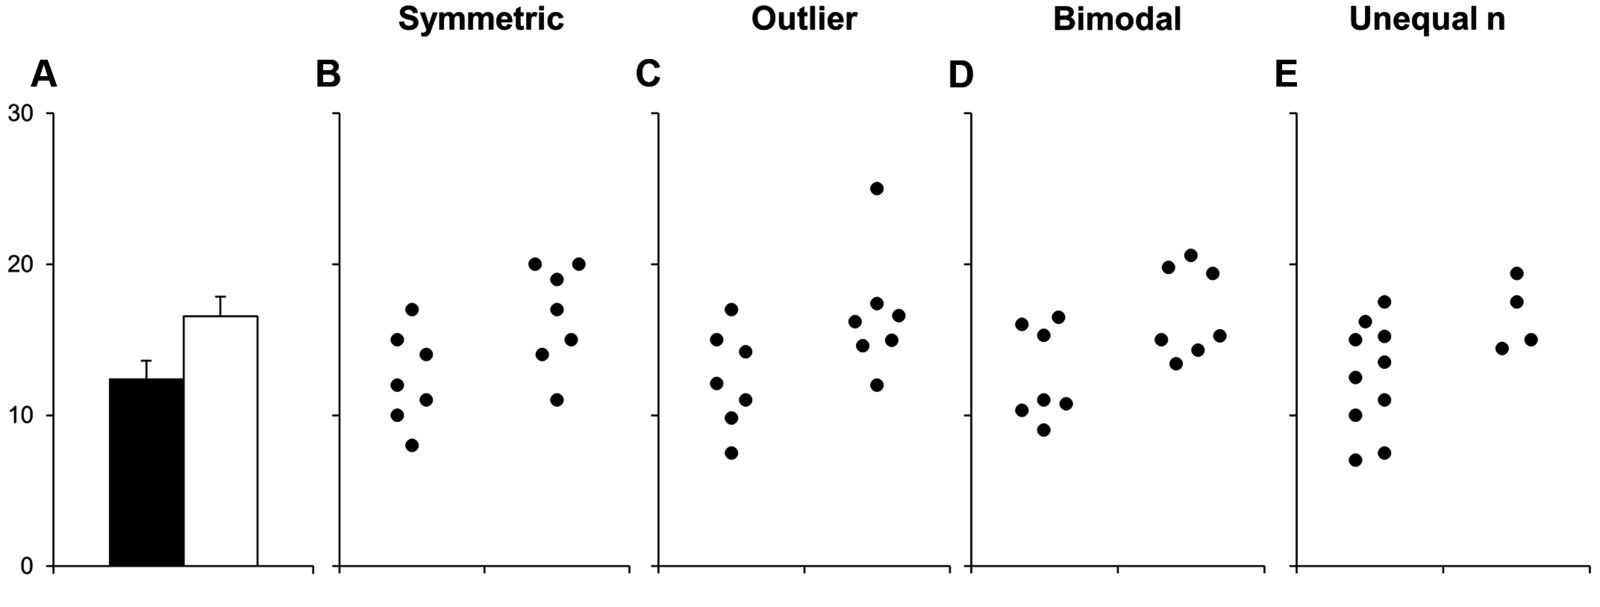
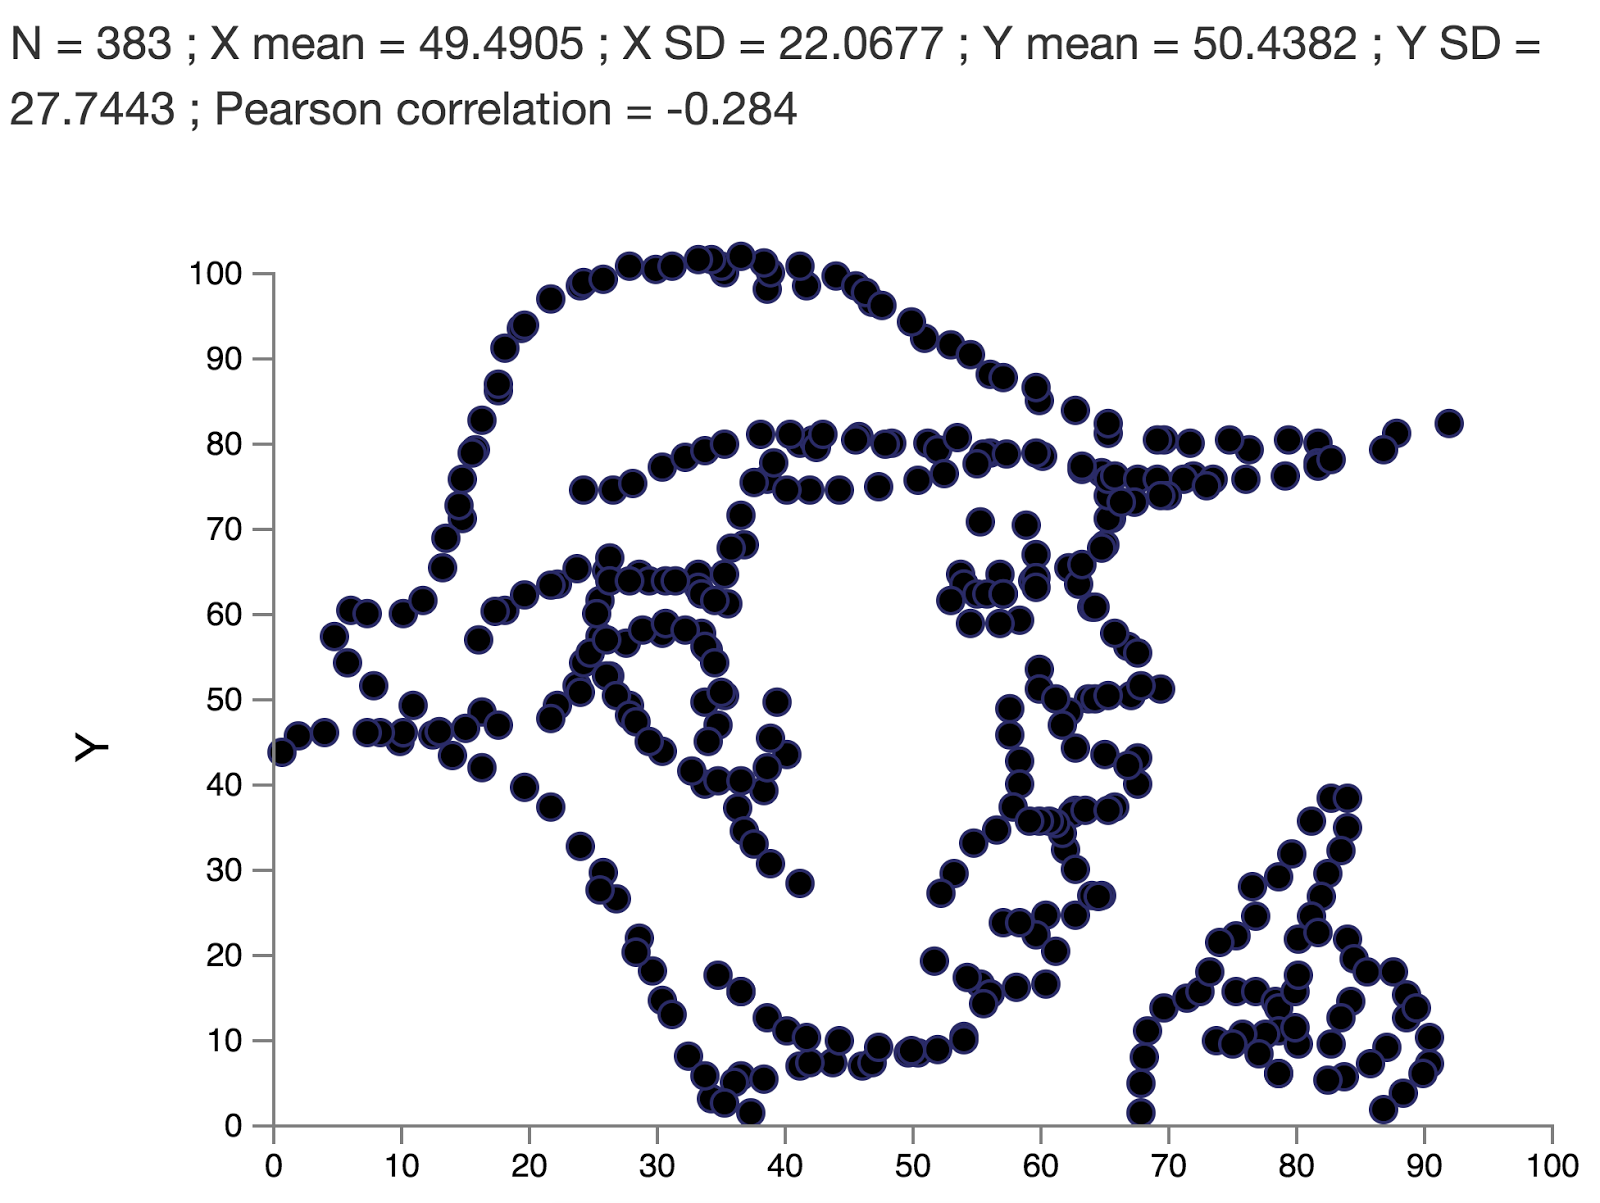
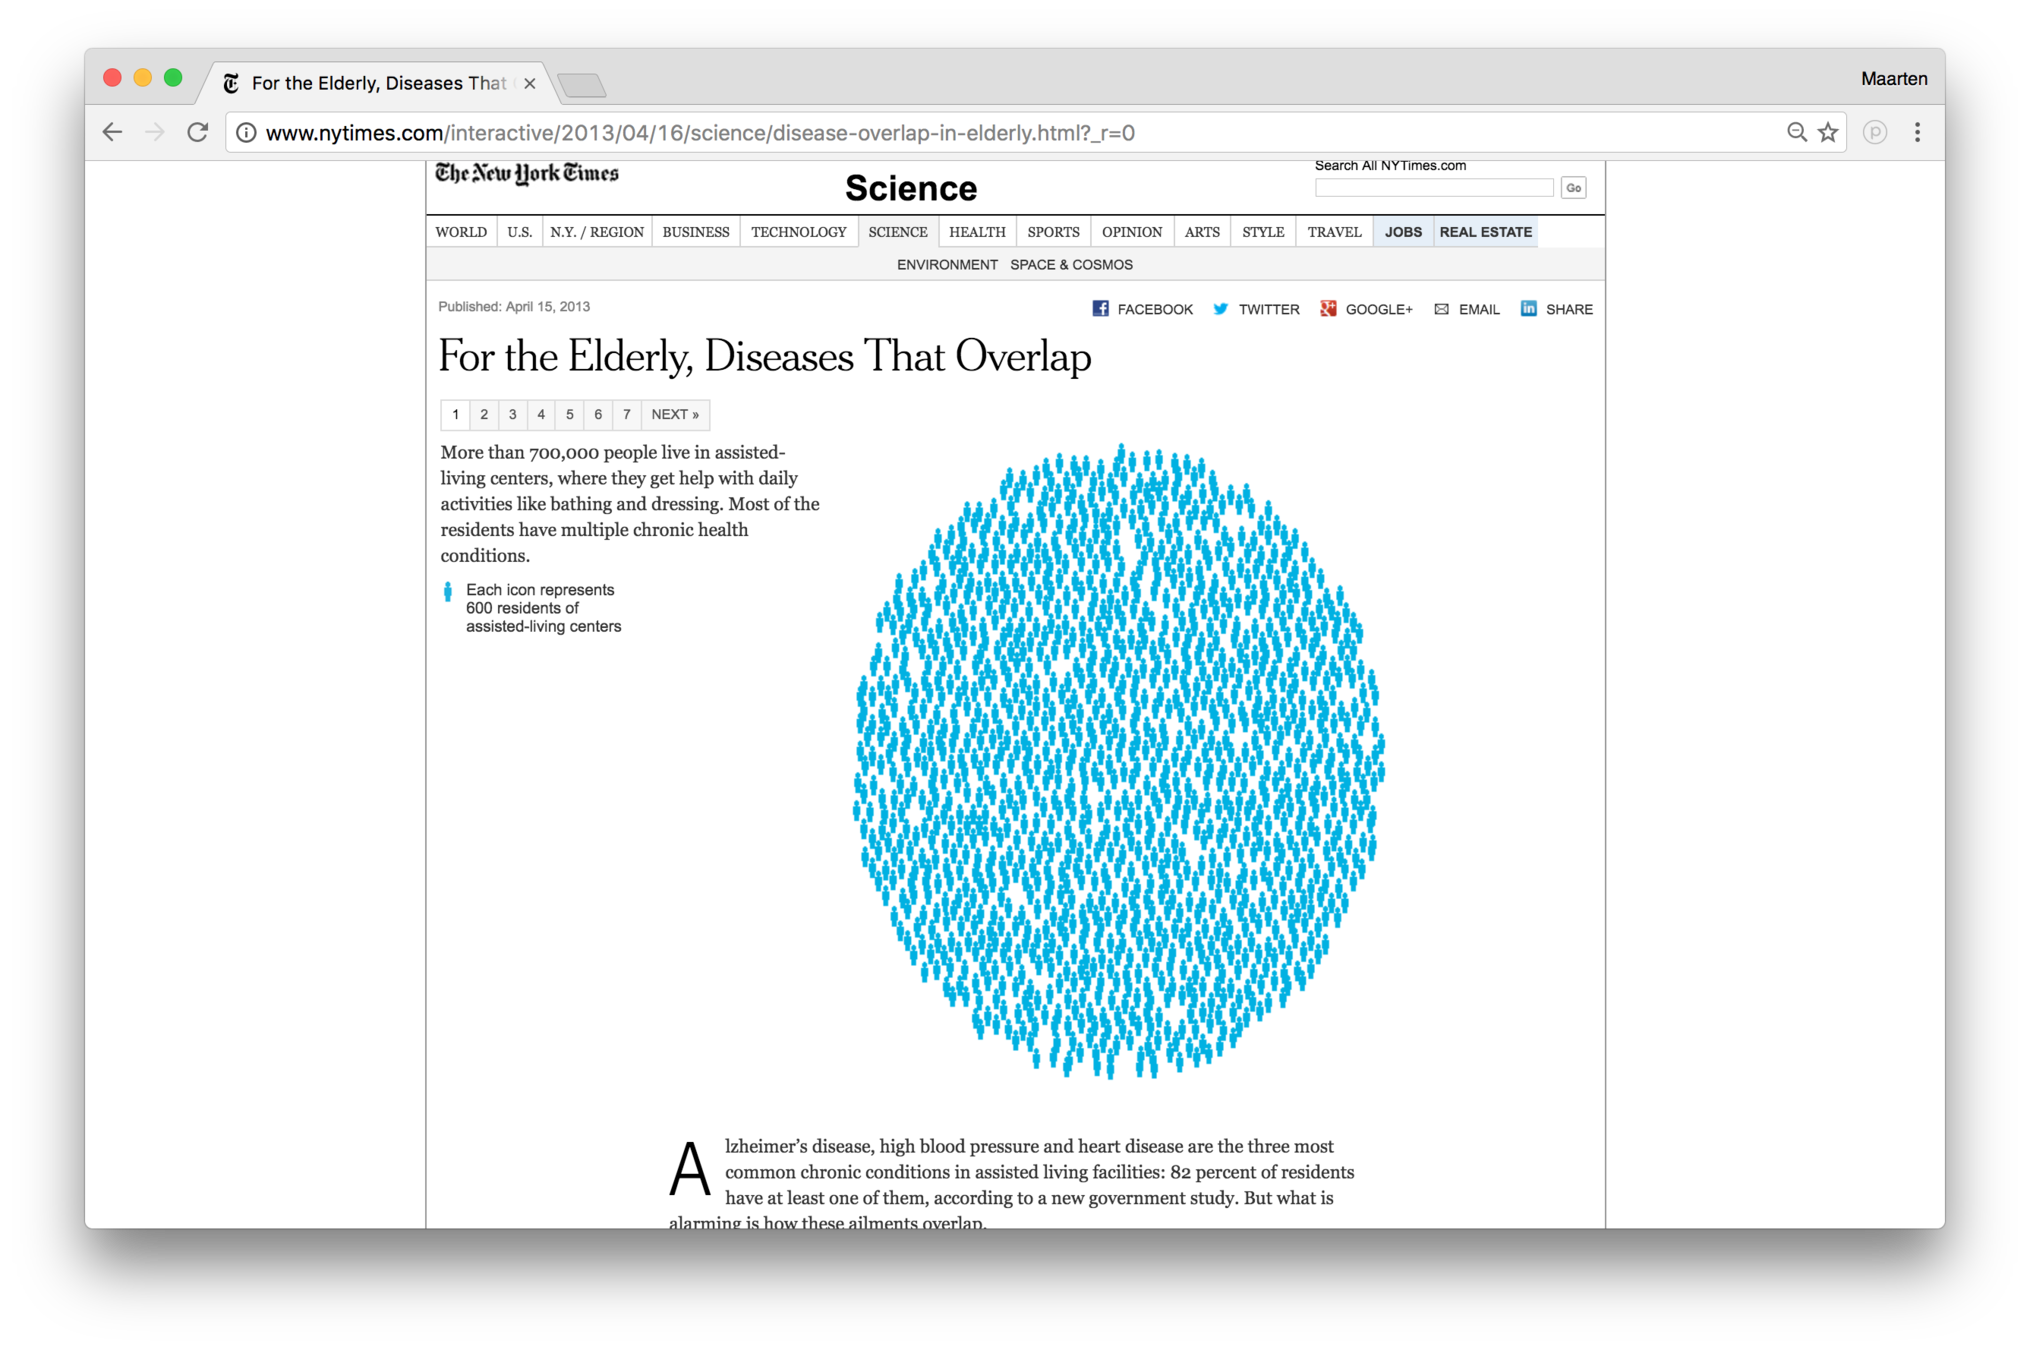
10. Show the data
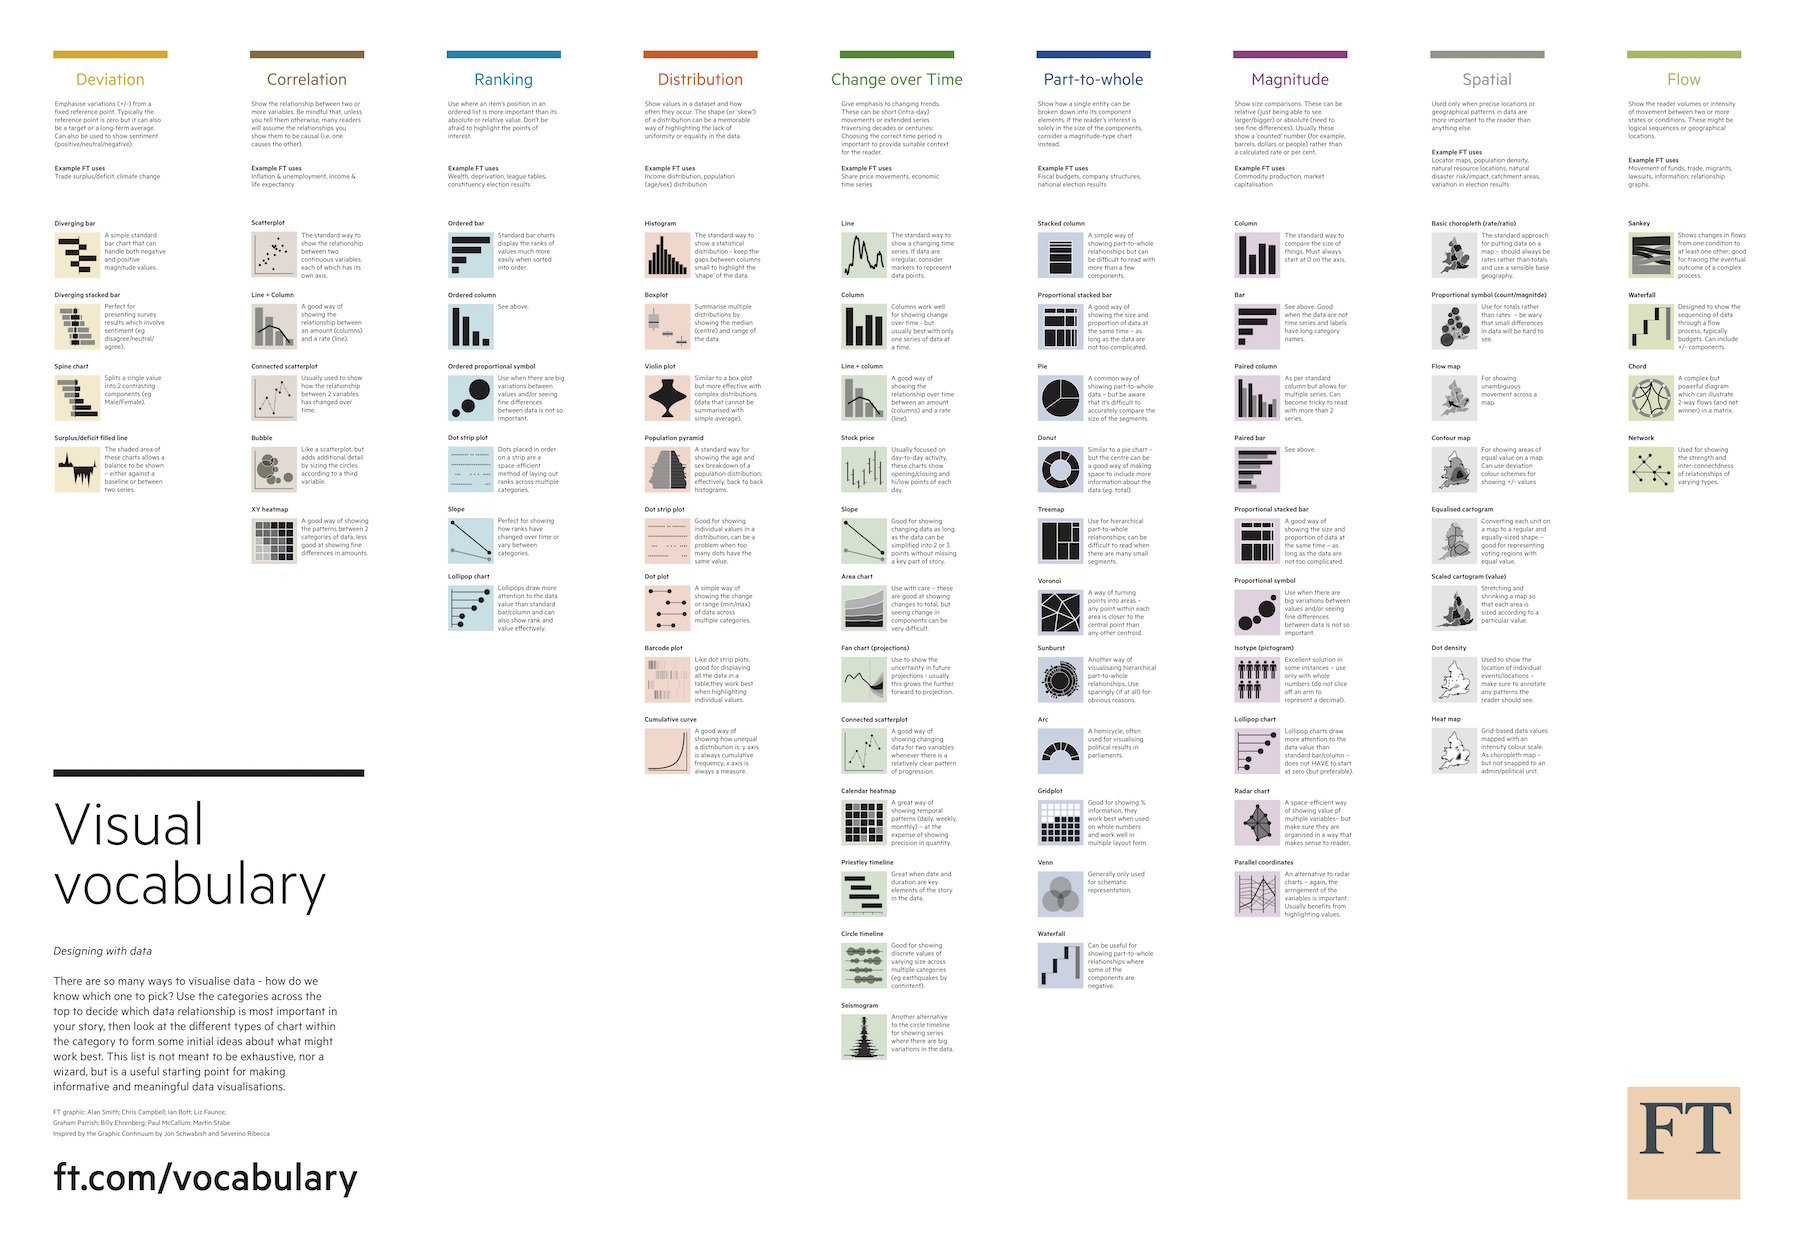
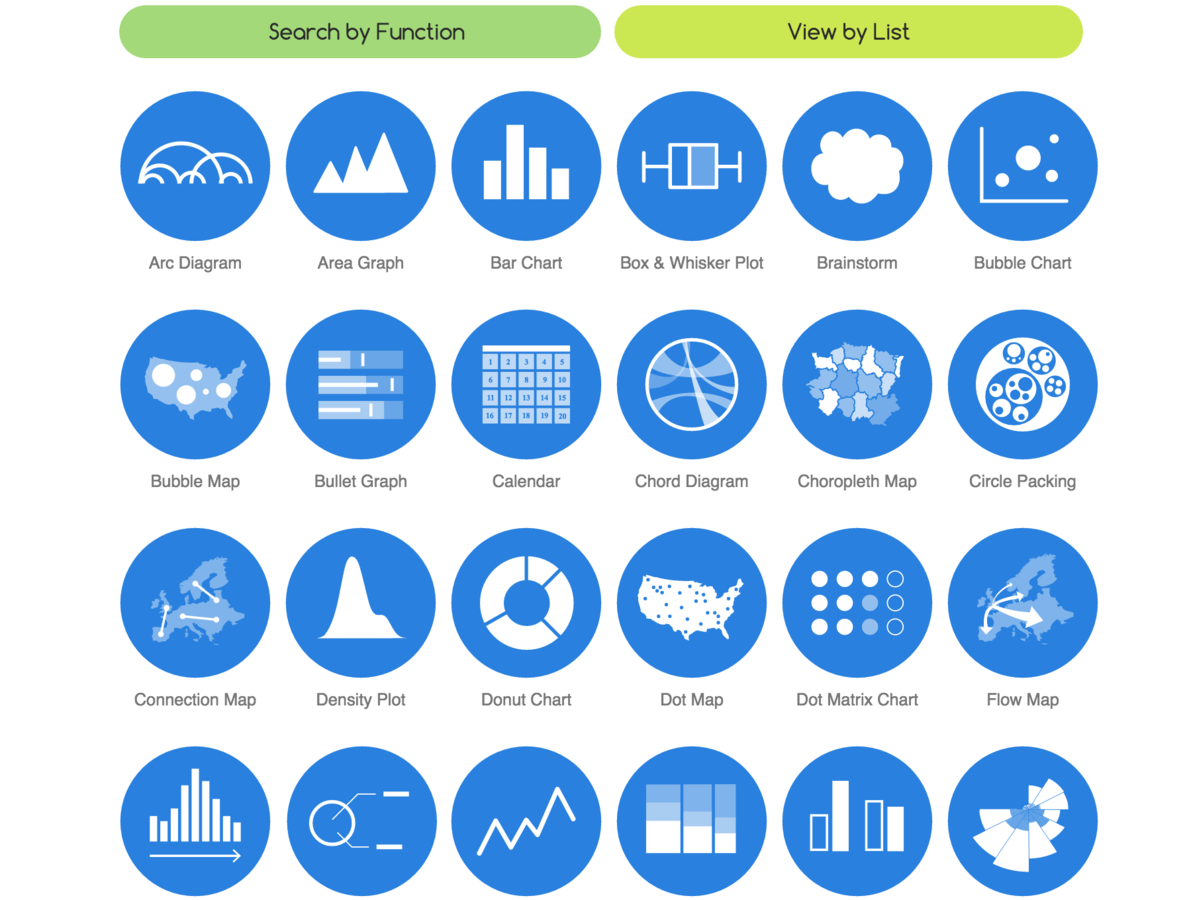
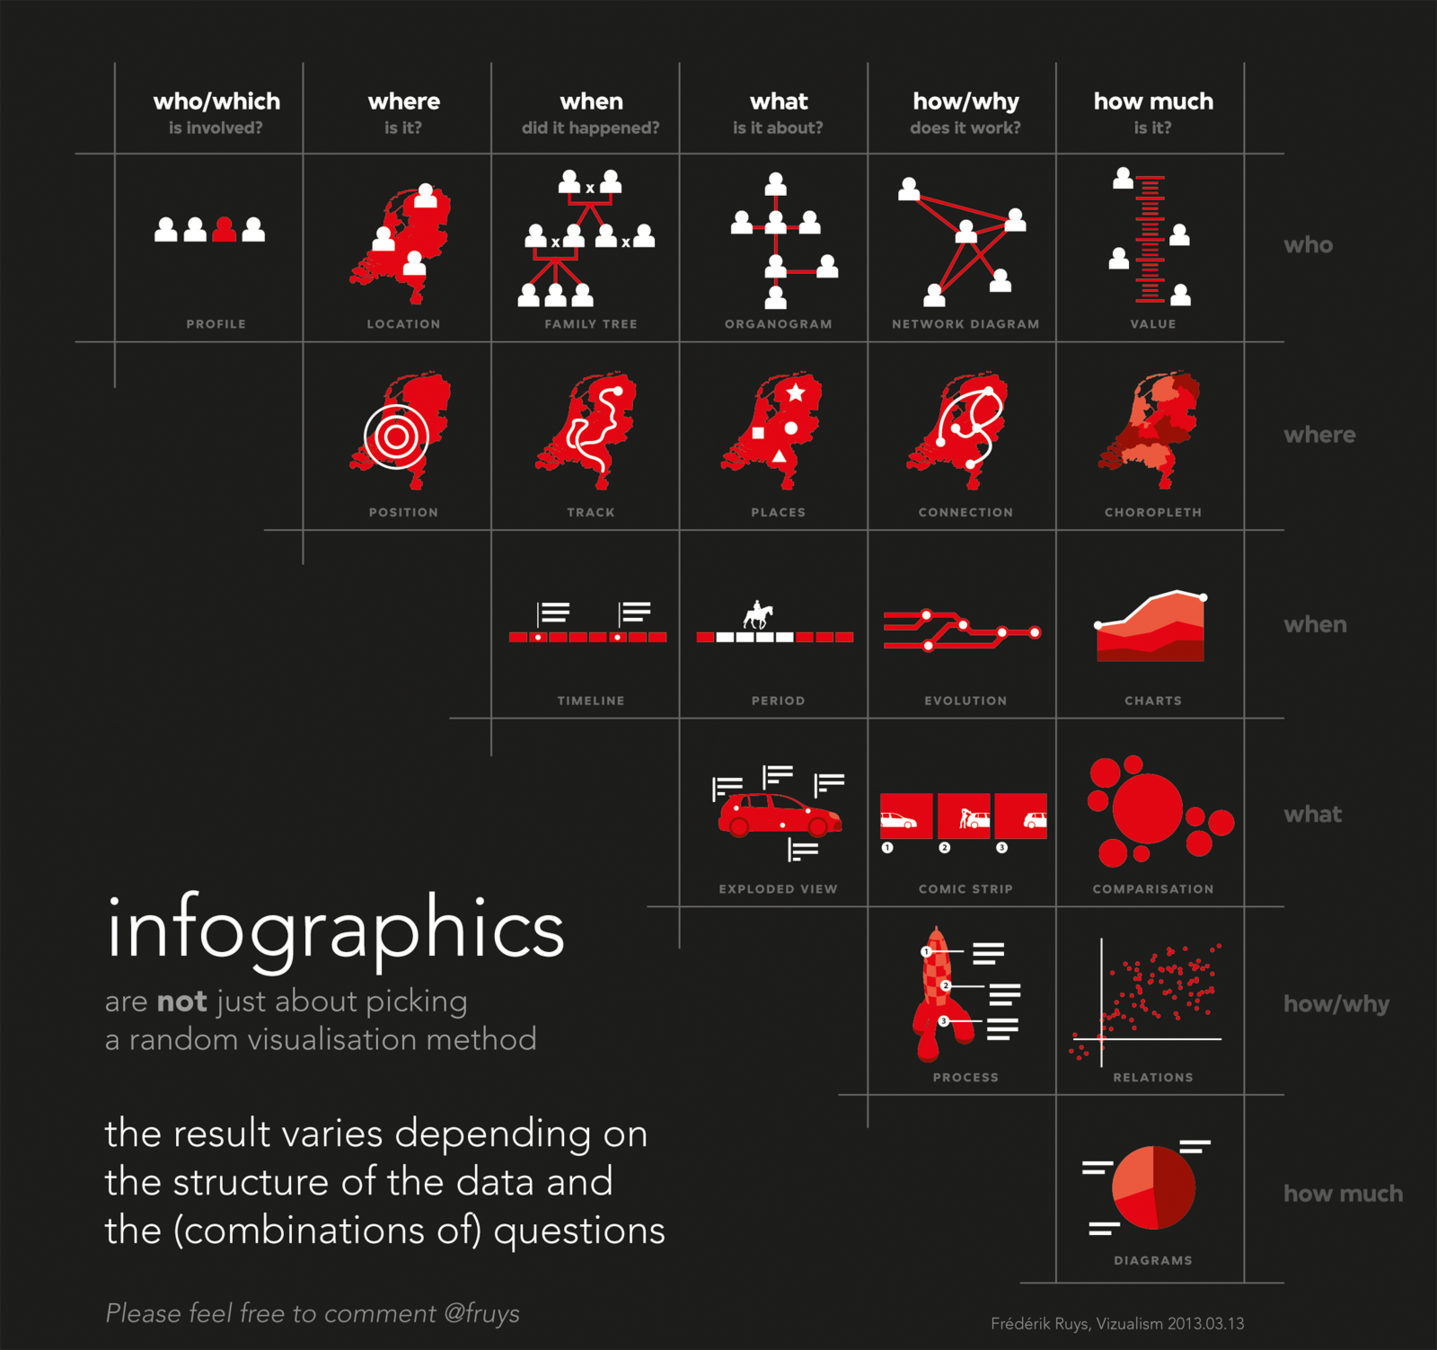
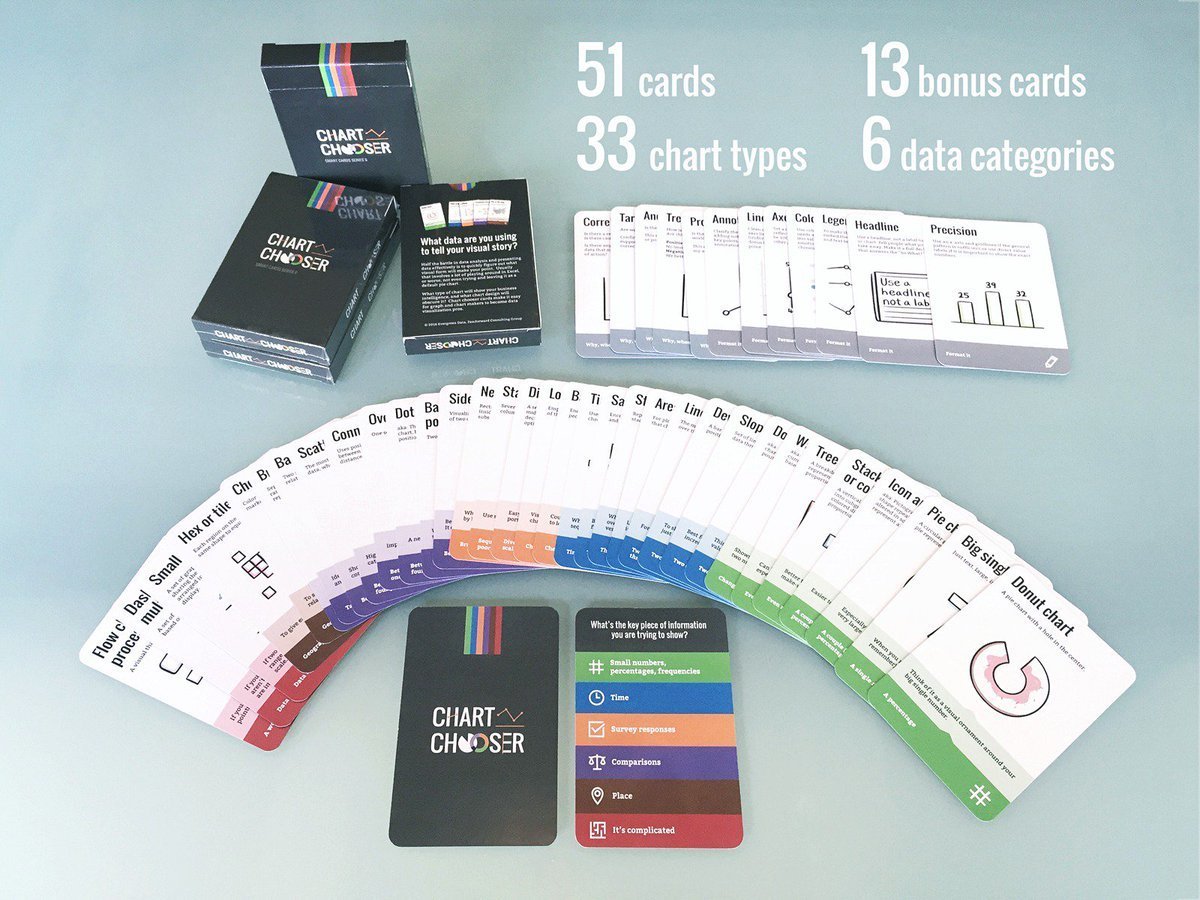
Chart Choosers

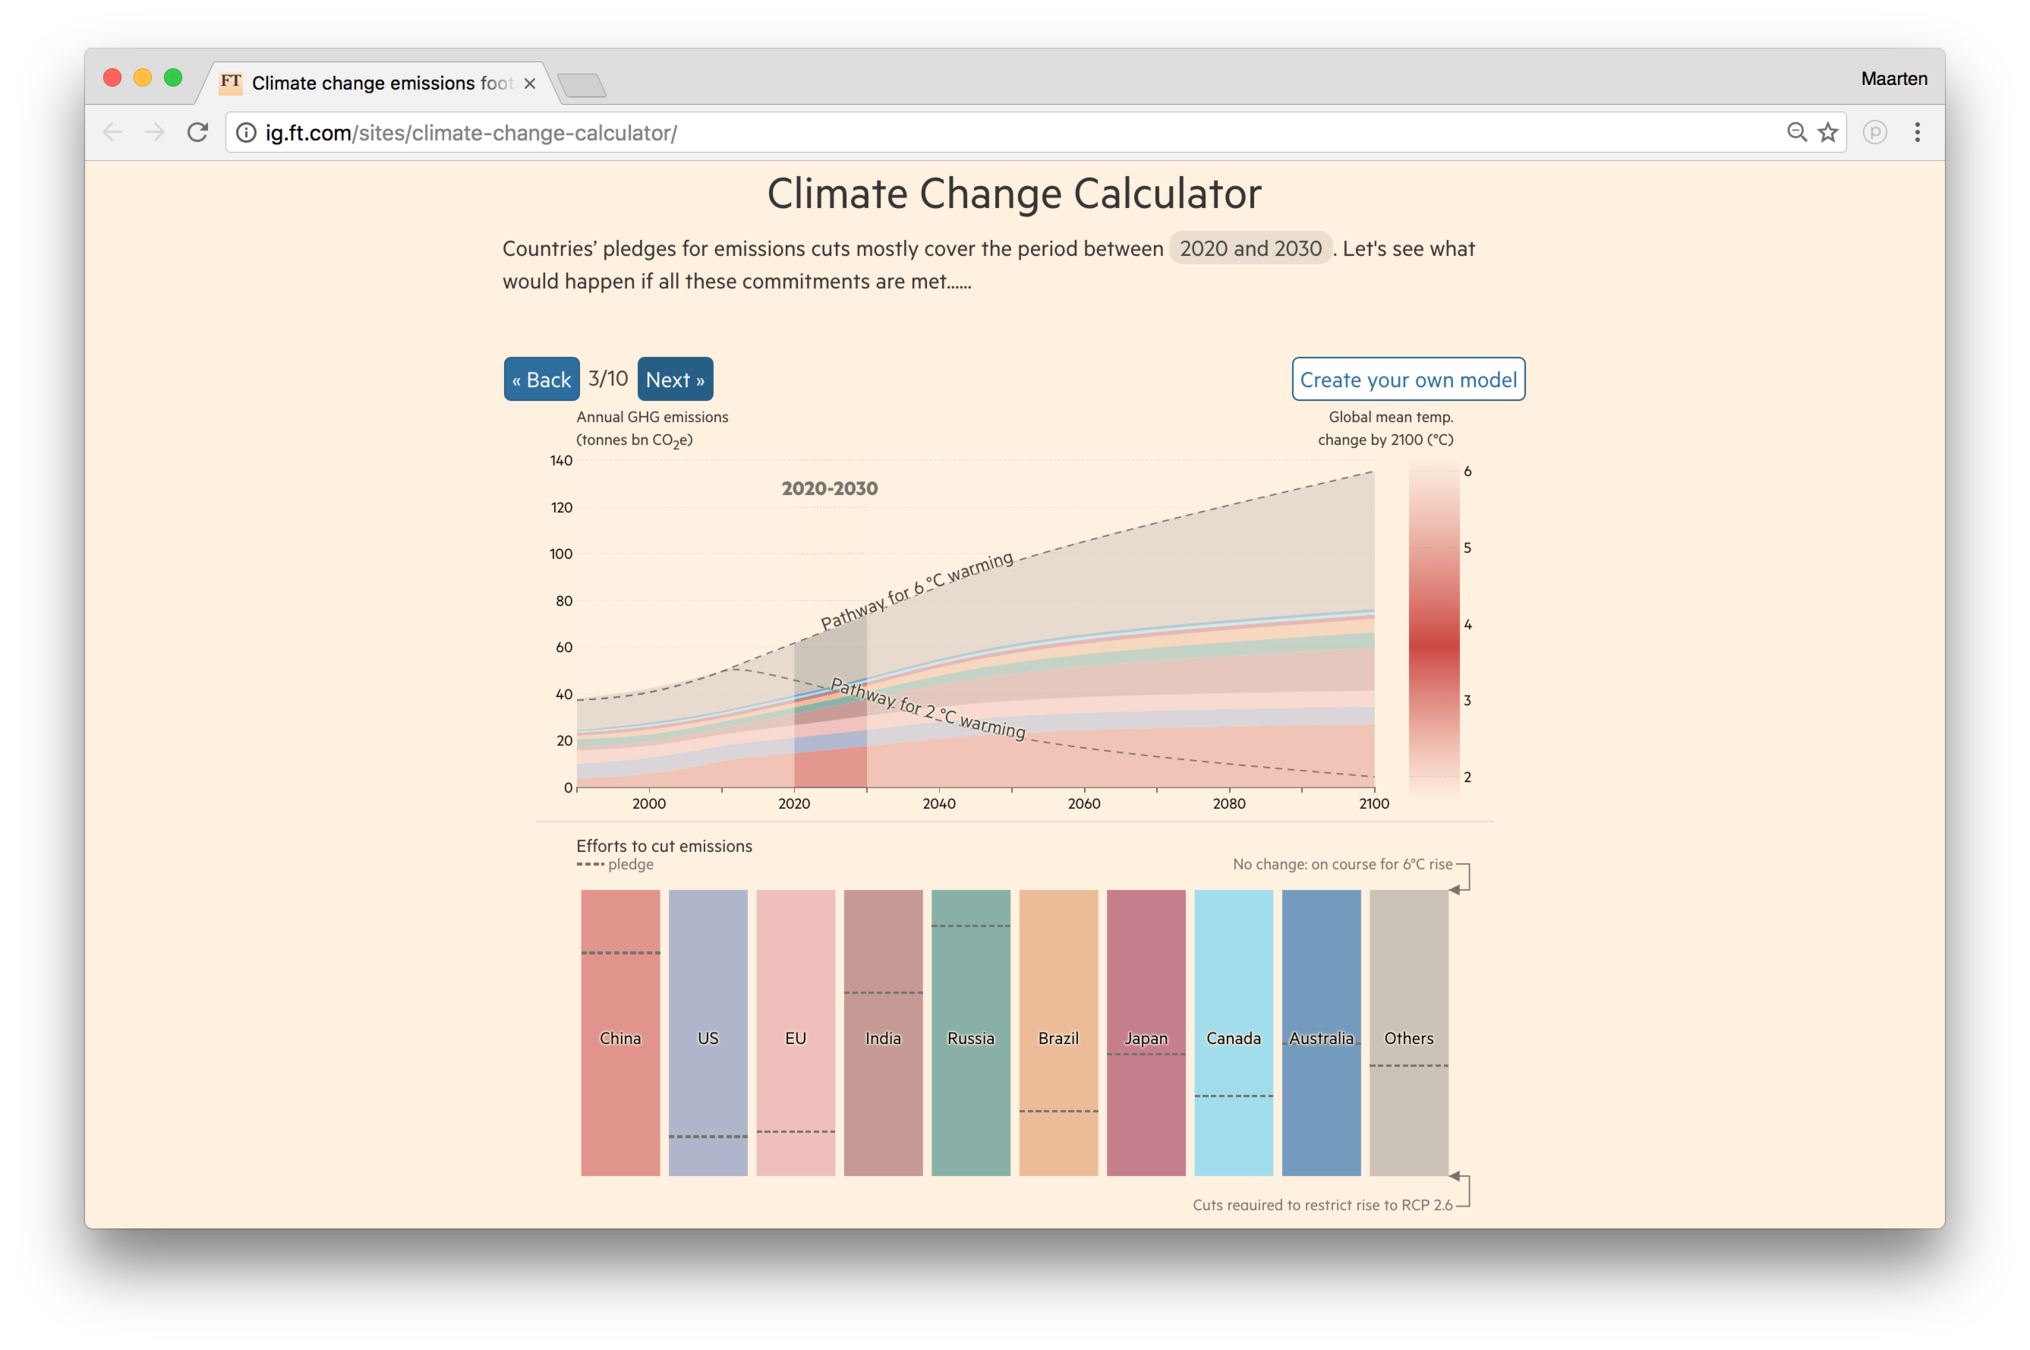
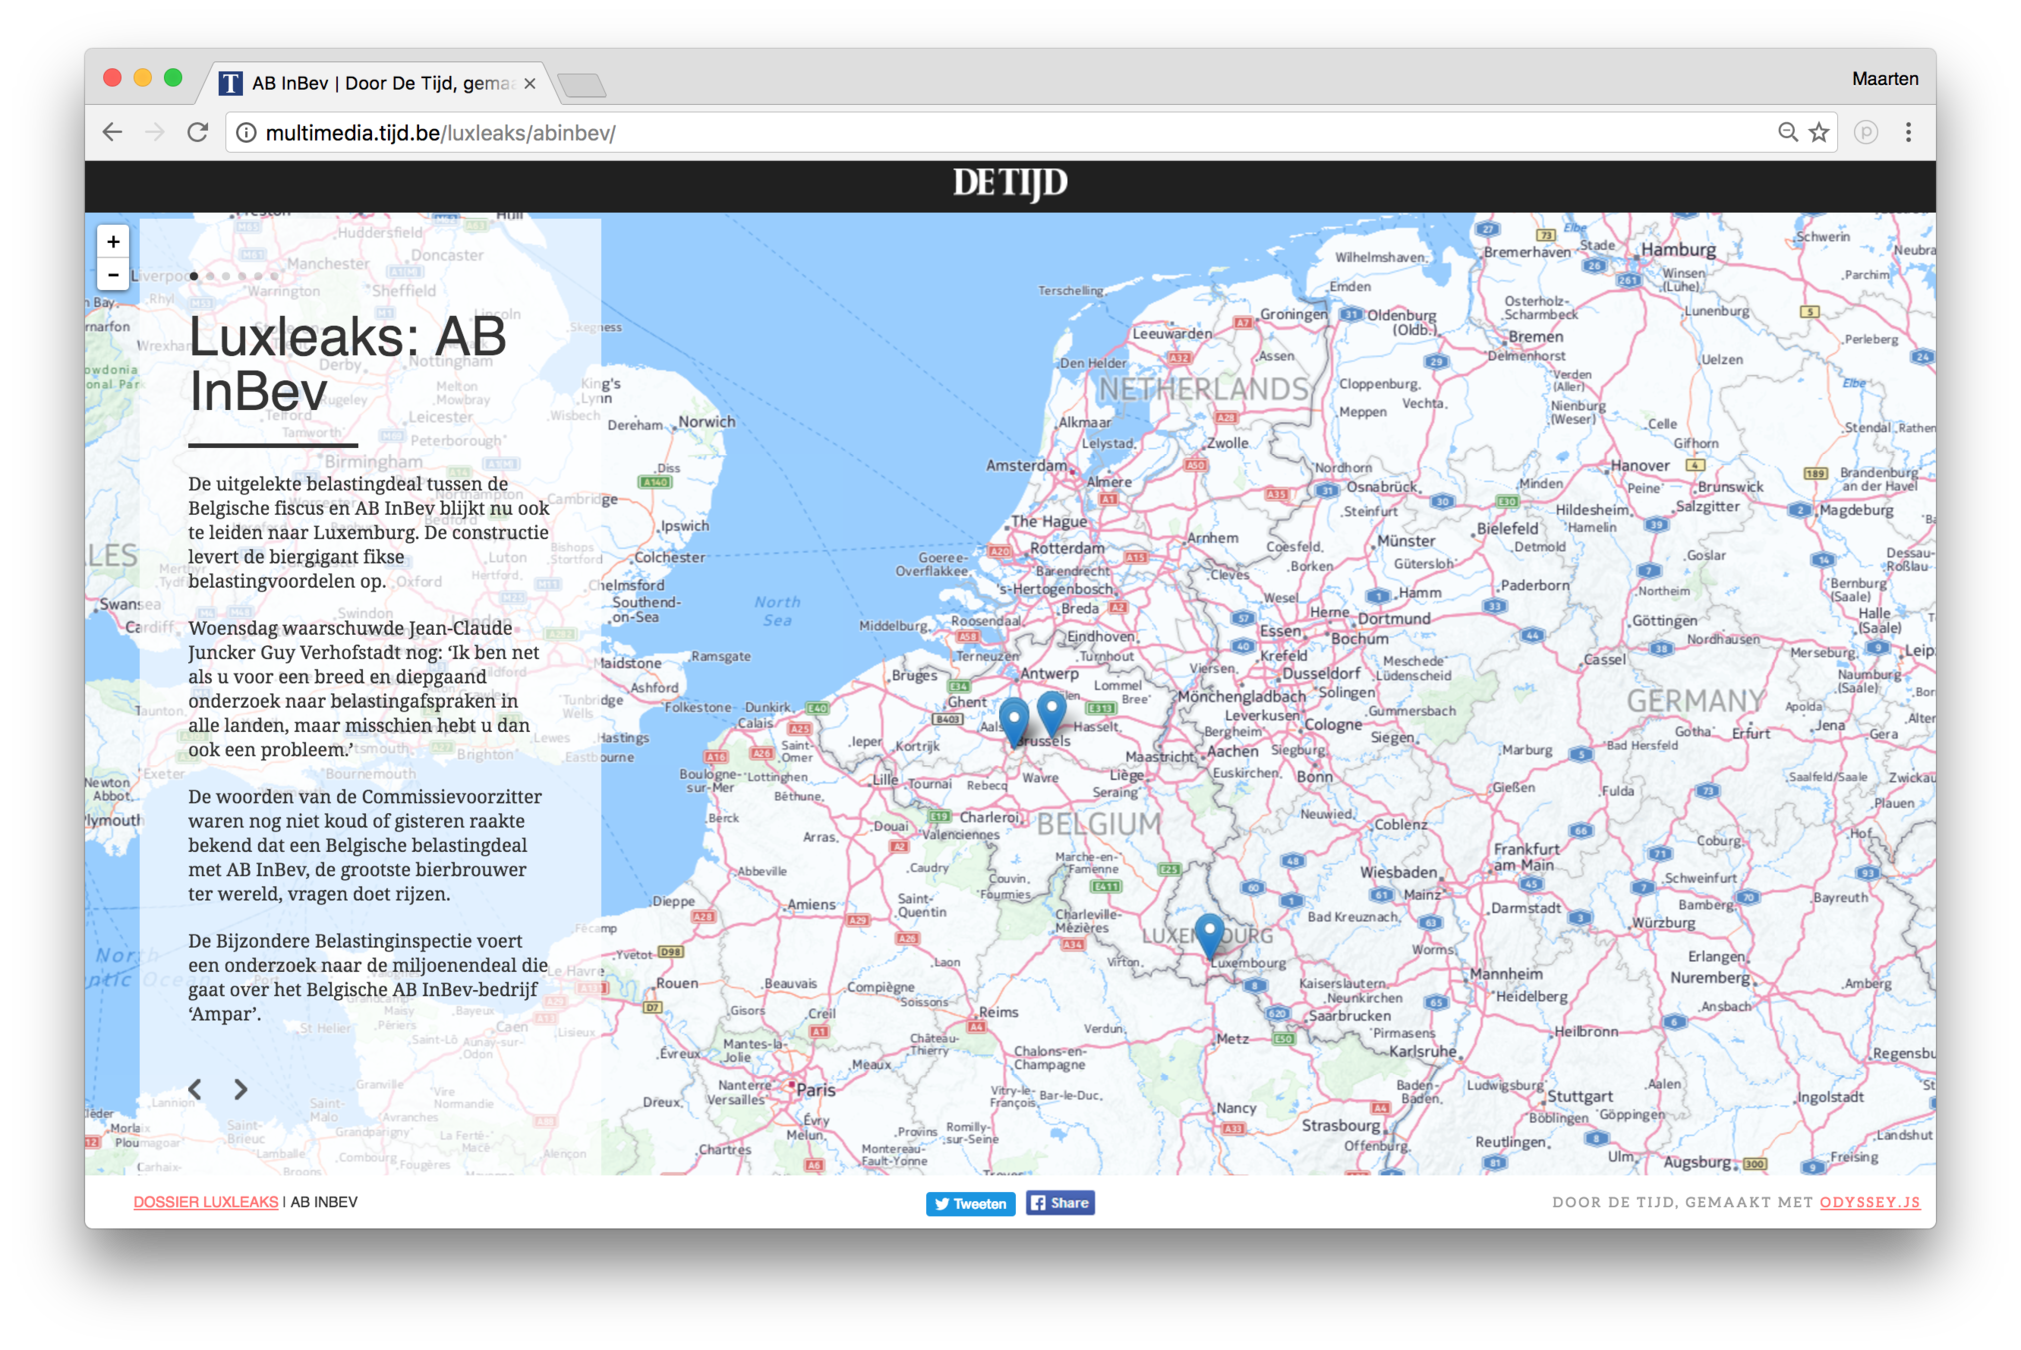
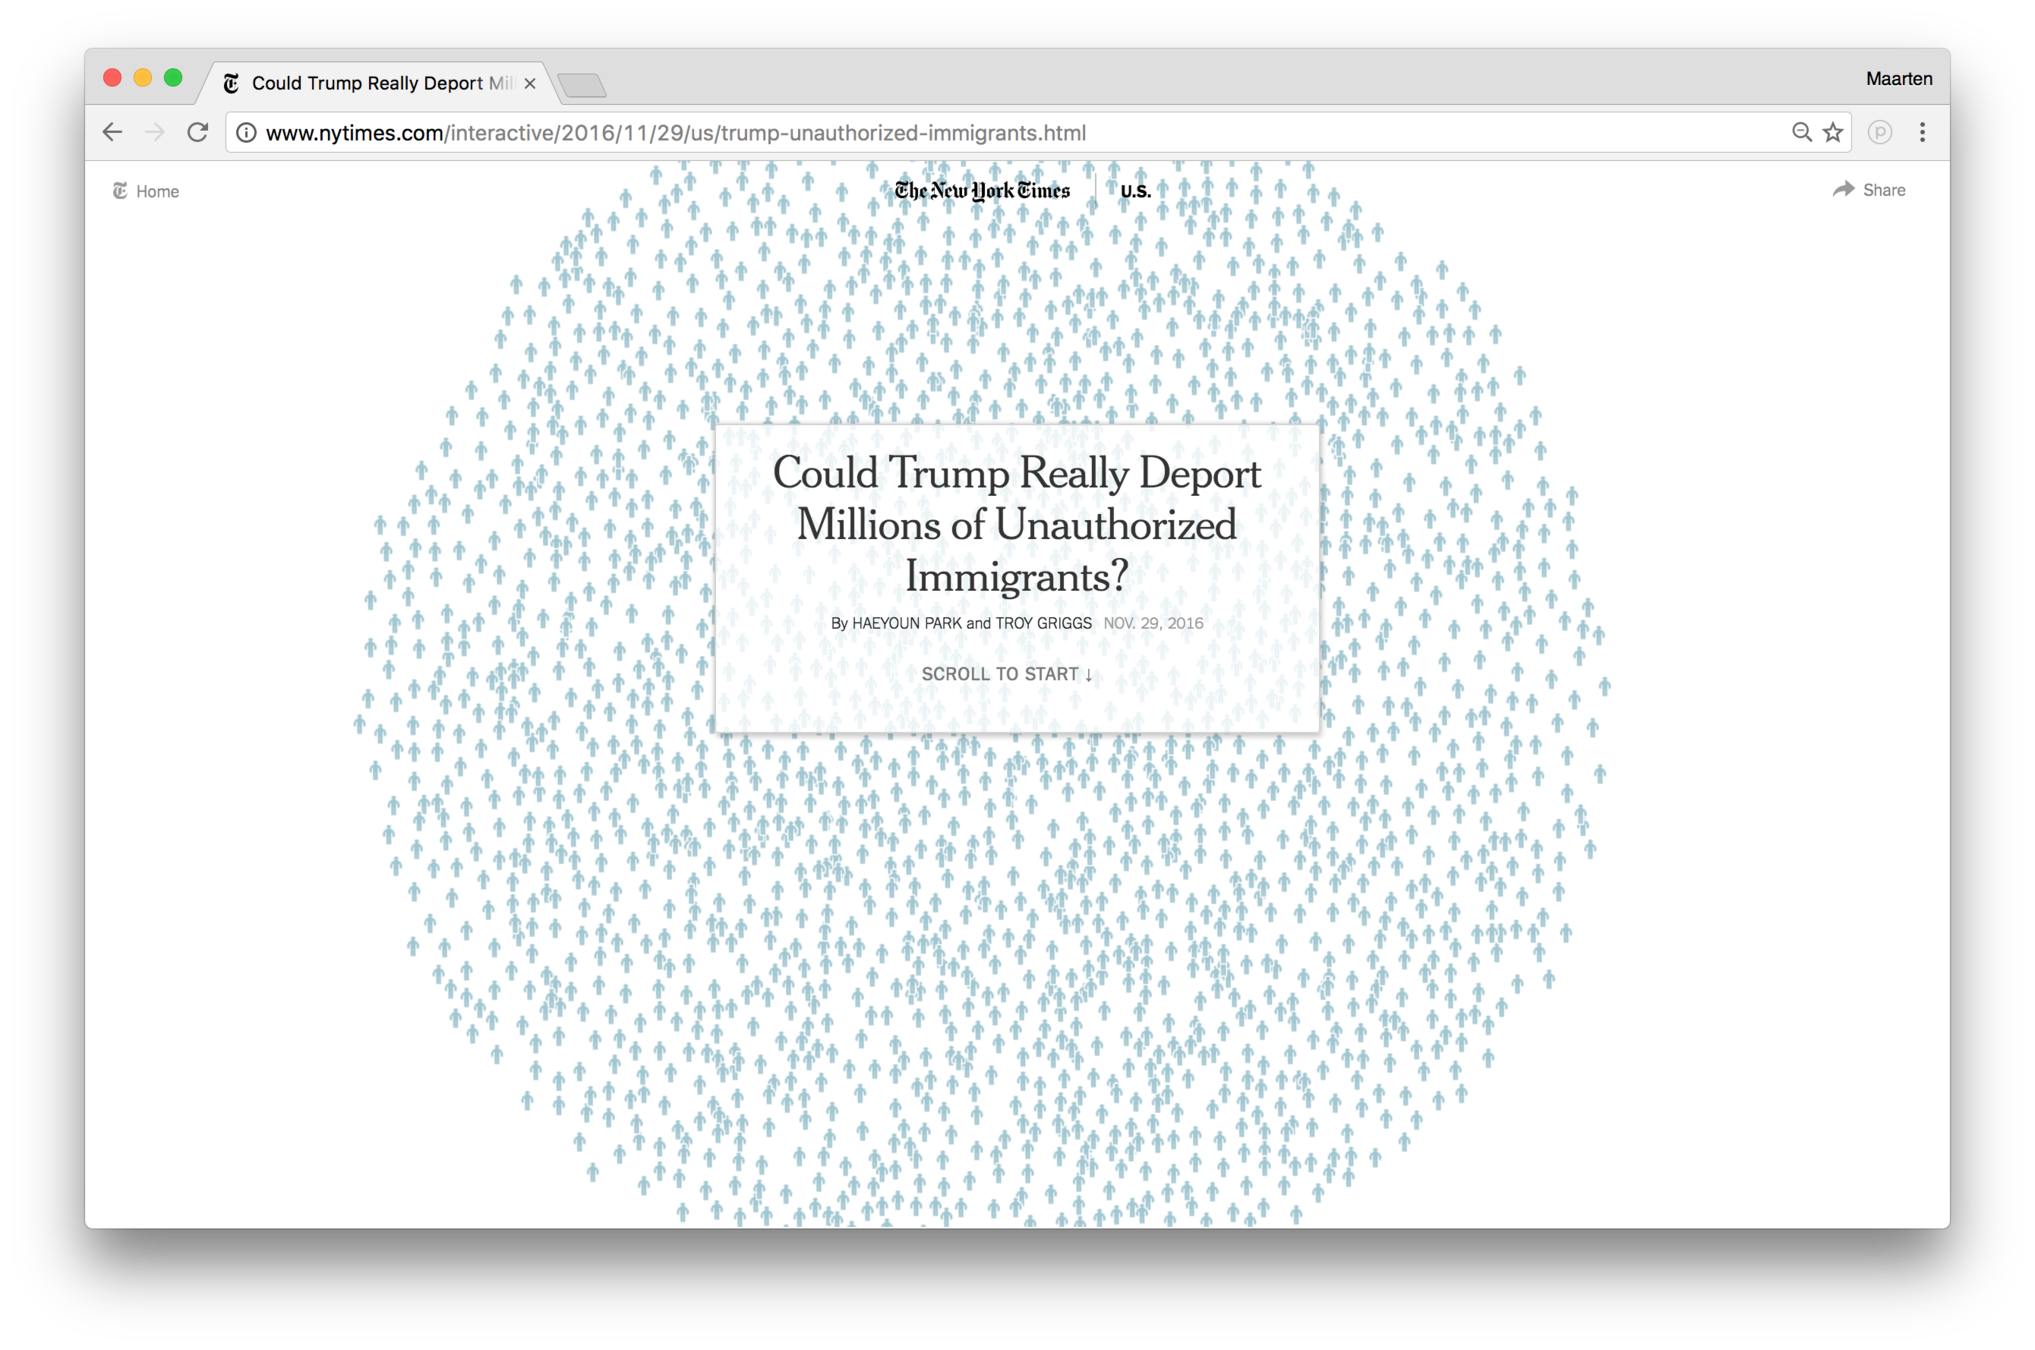
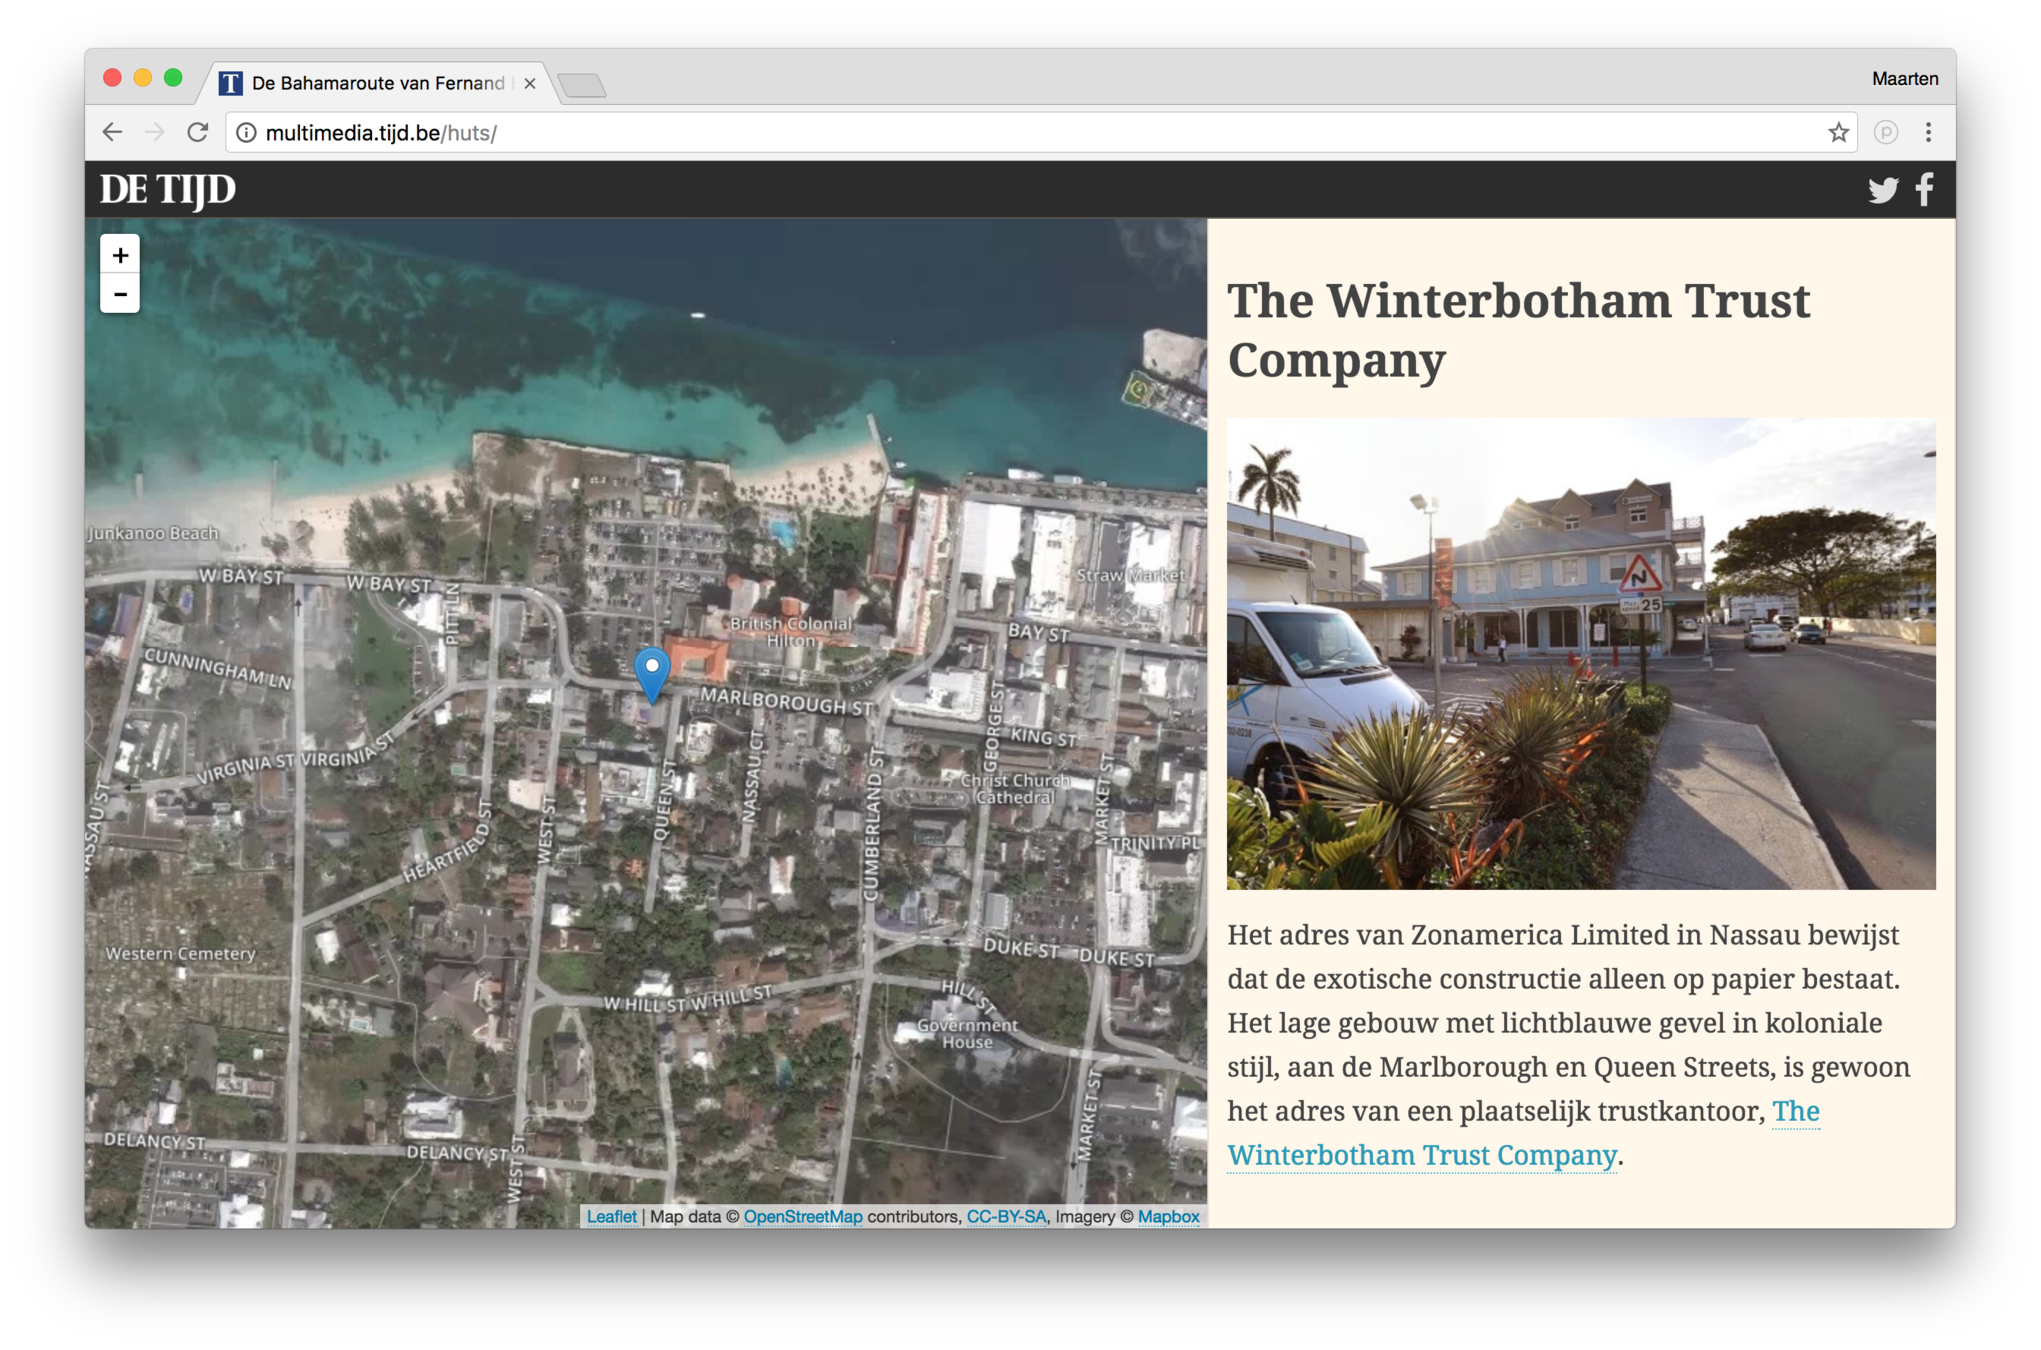
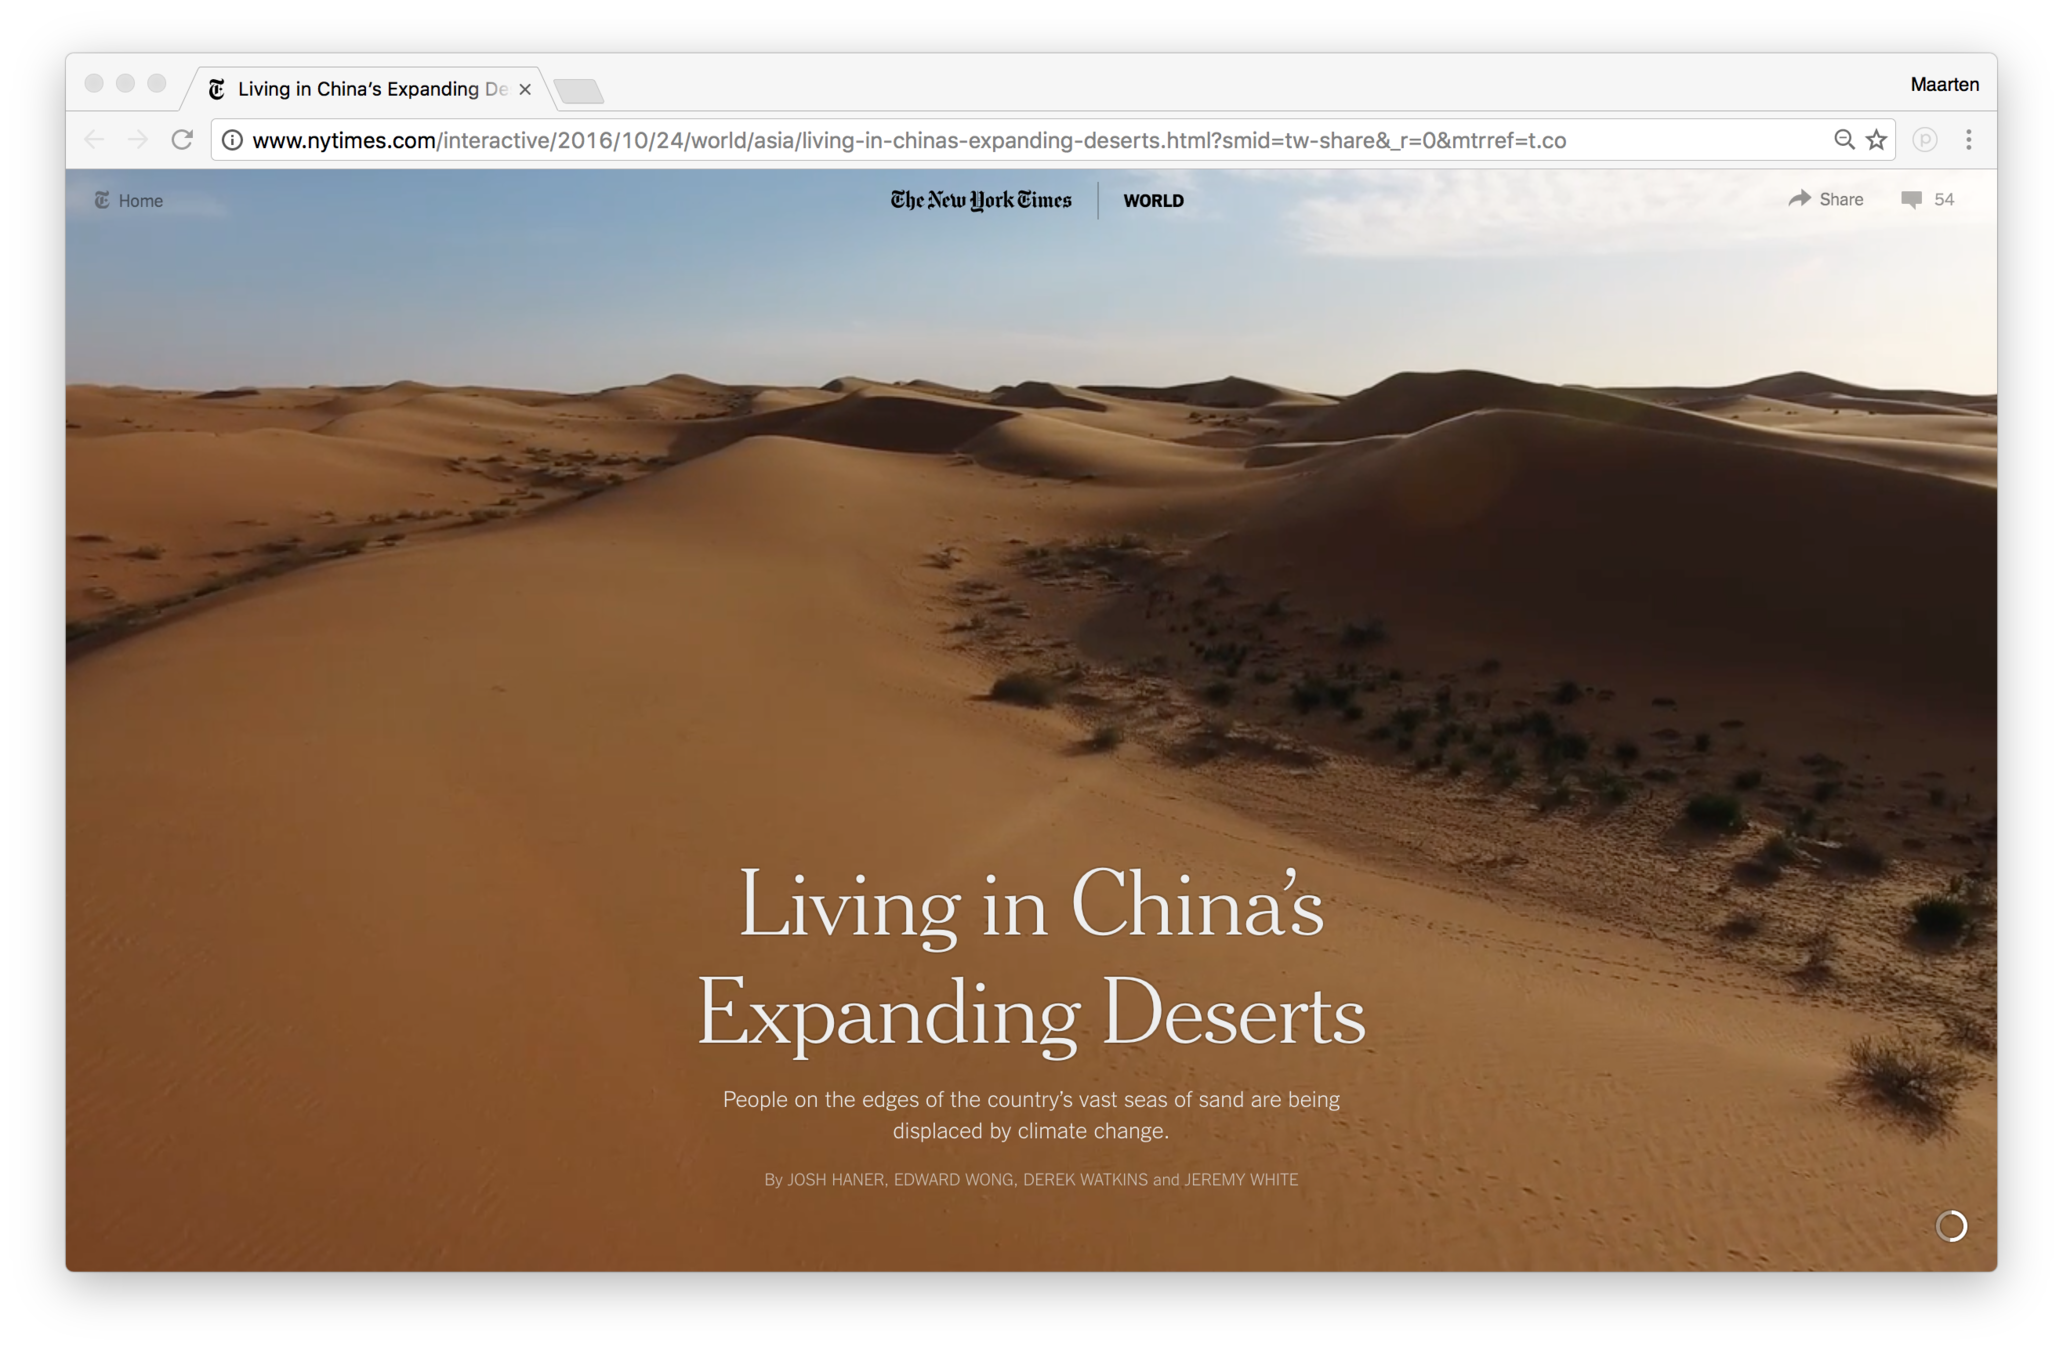
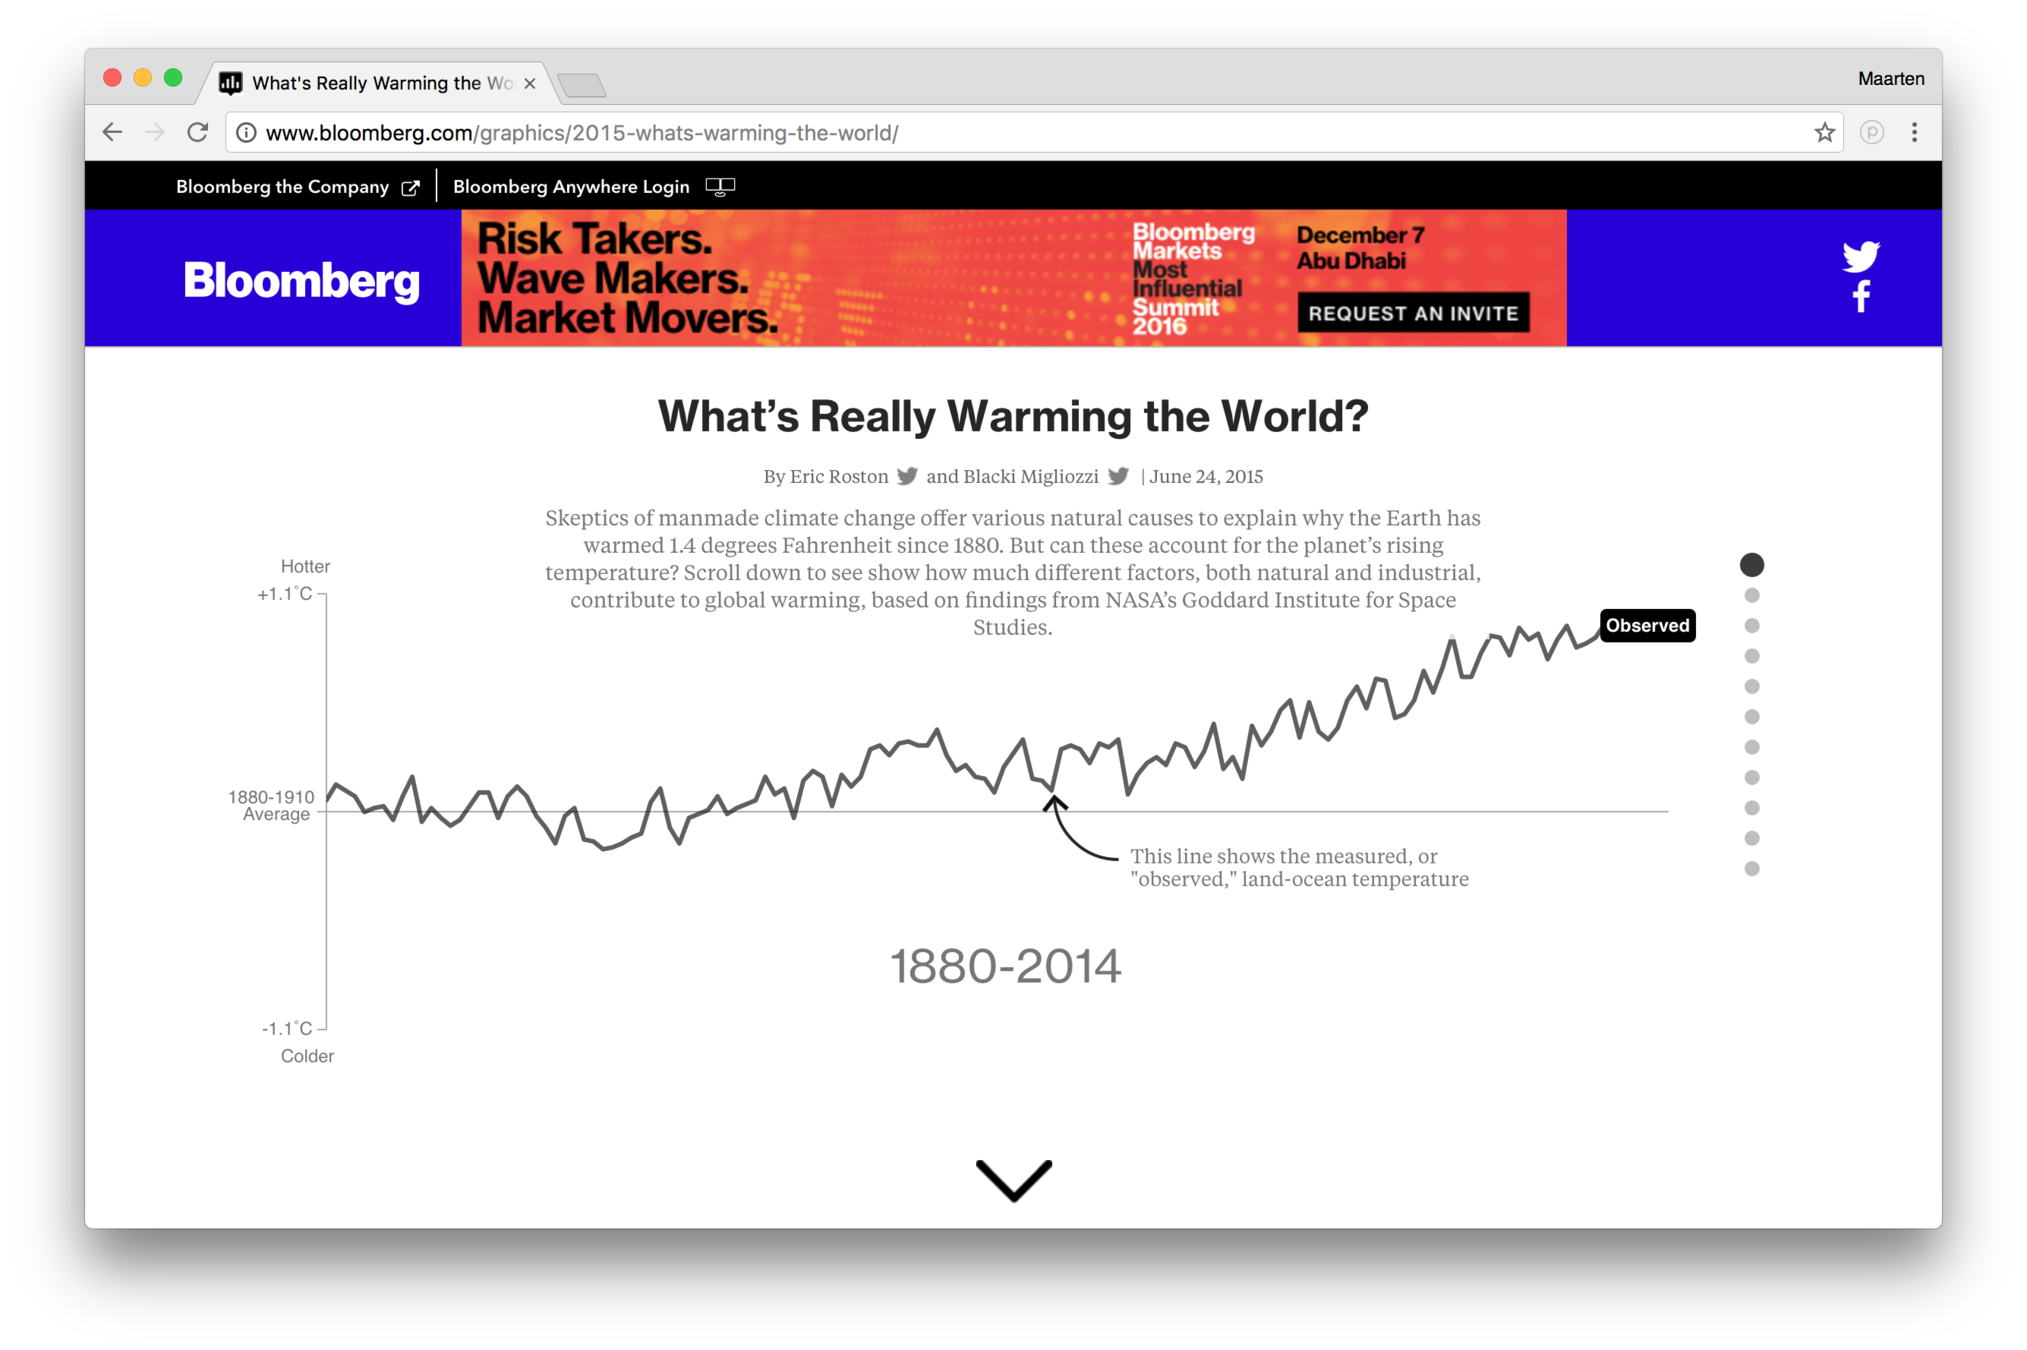
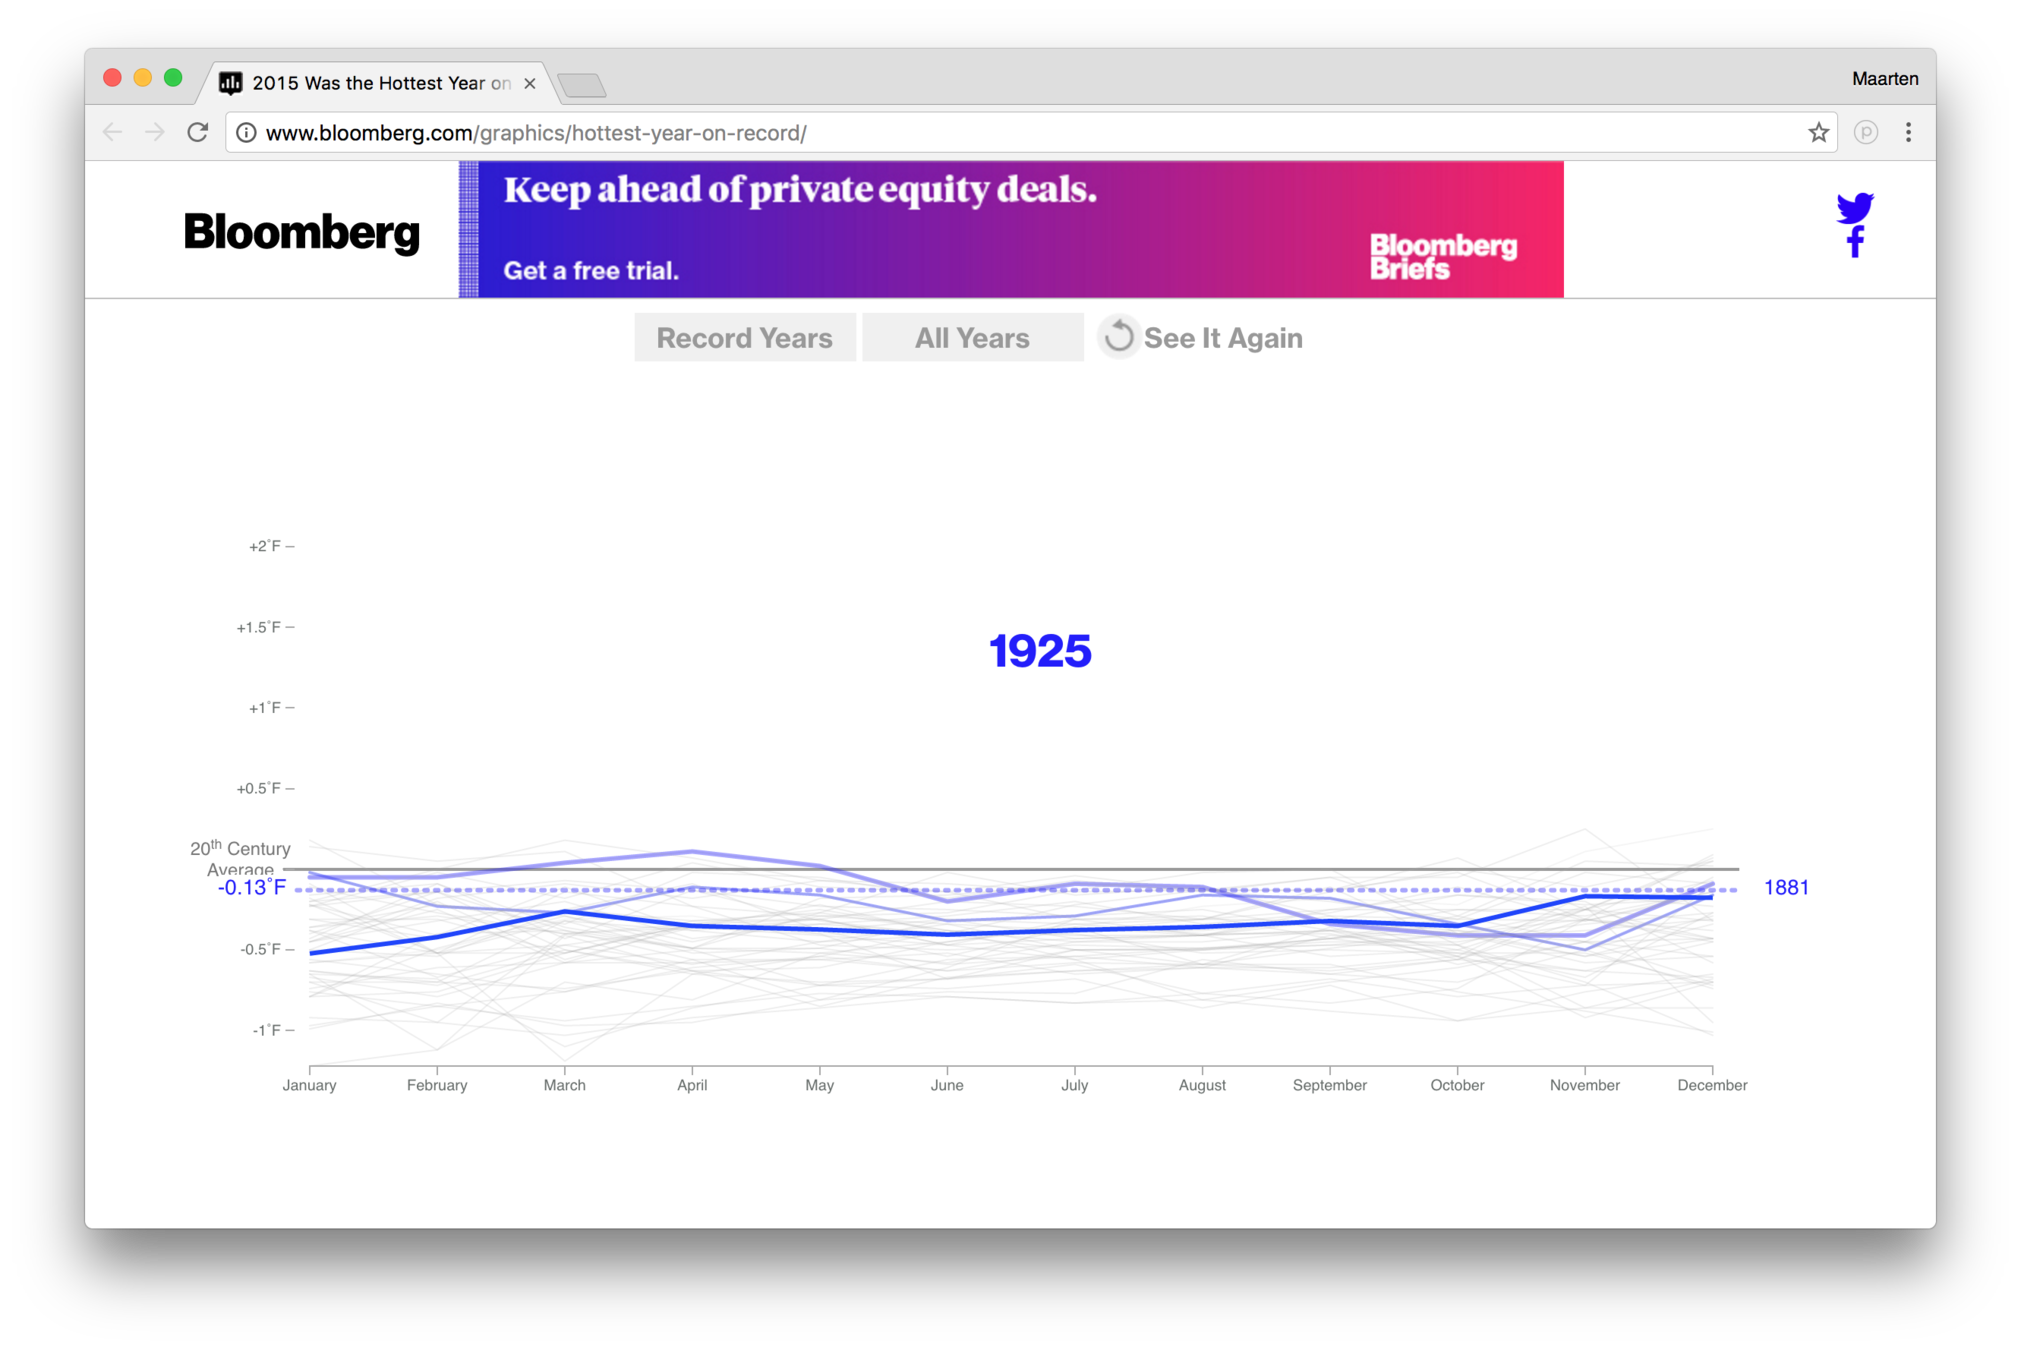
Datastorytelling
II
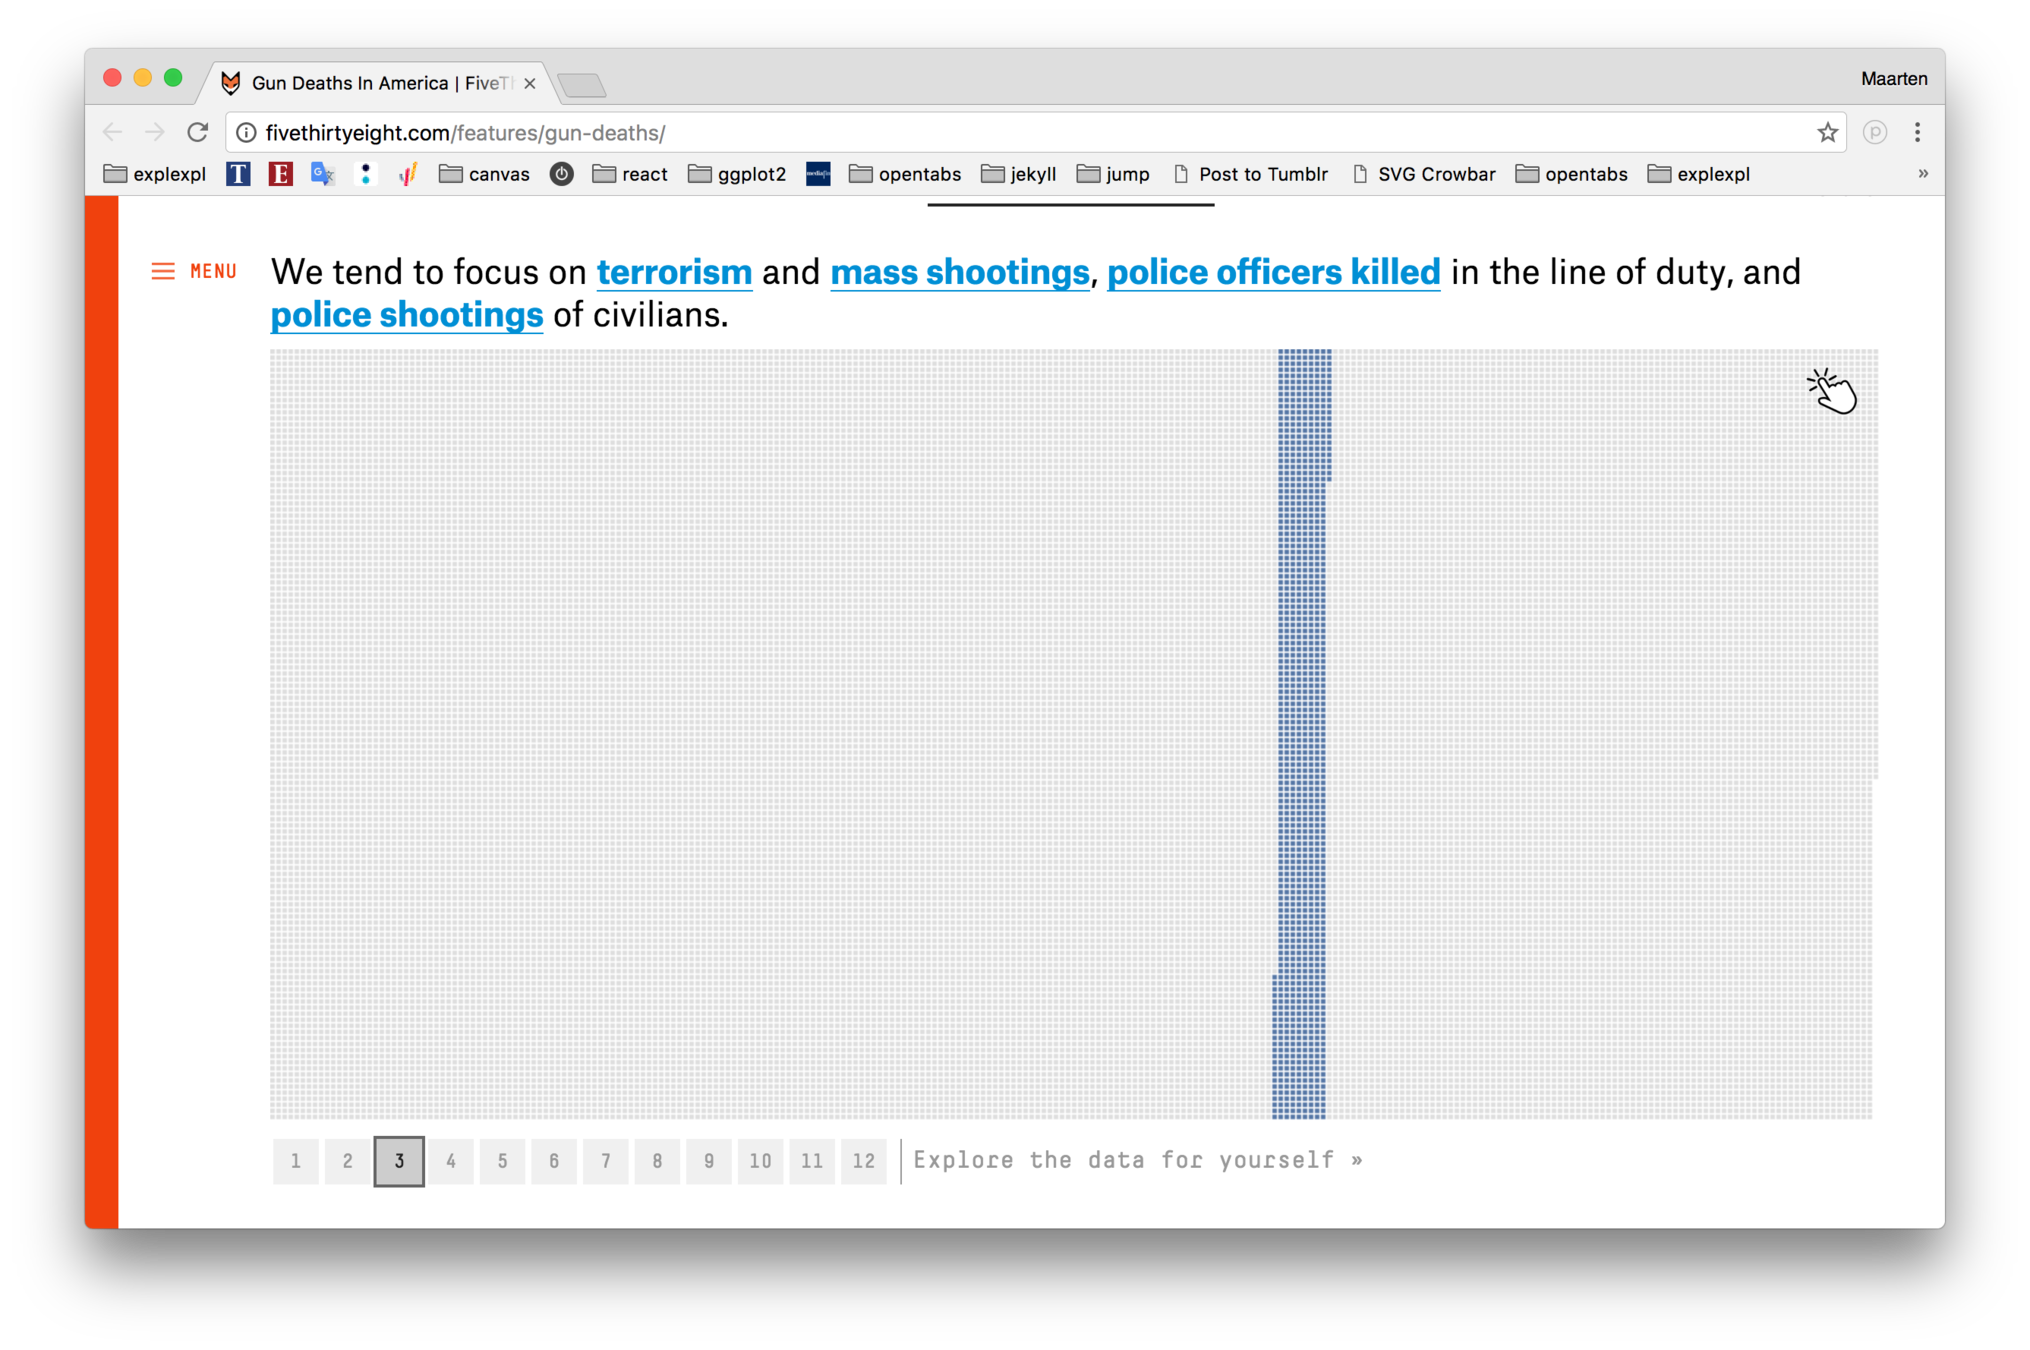
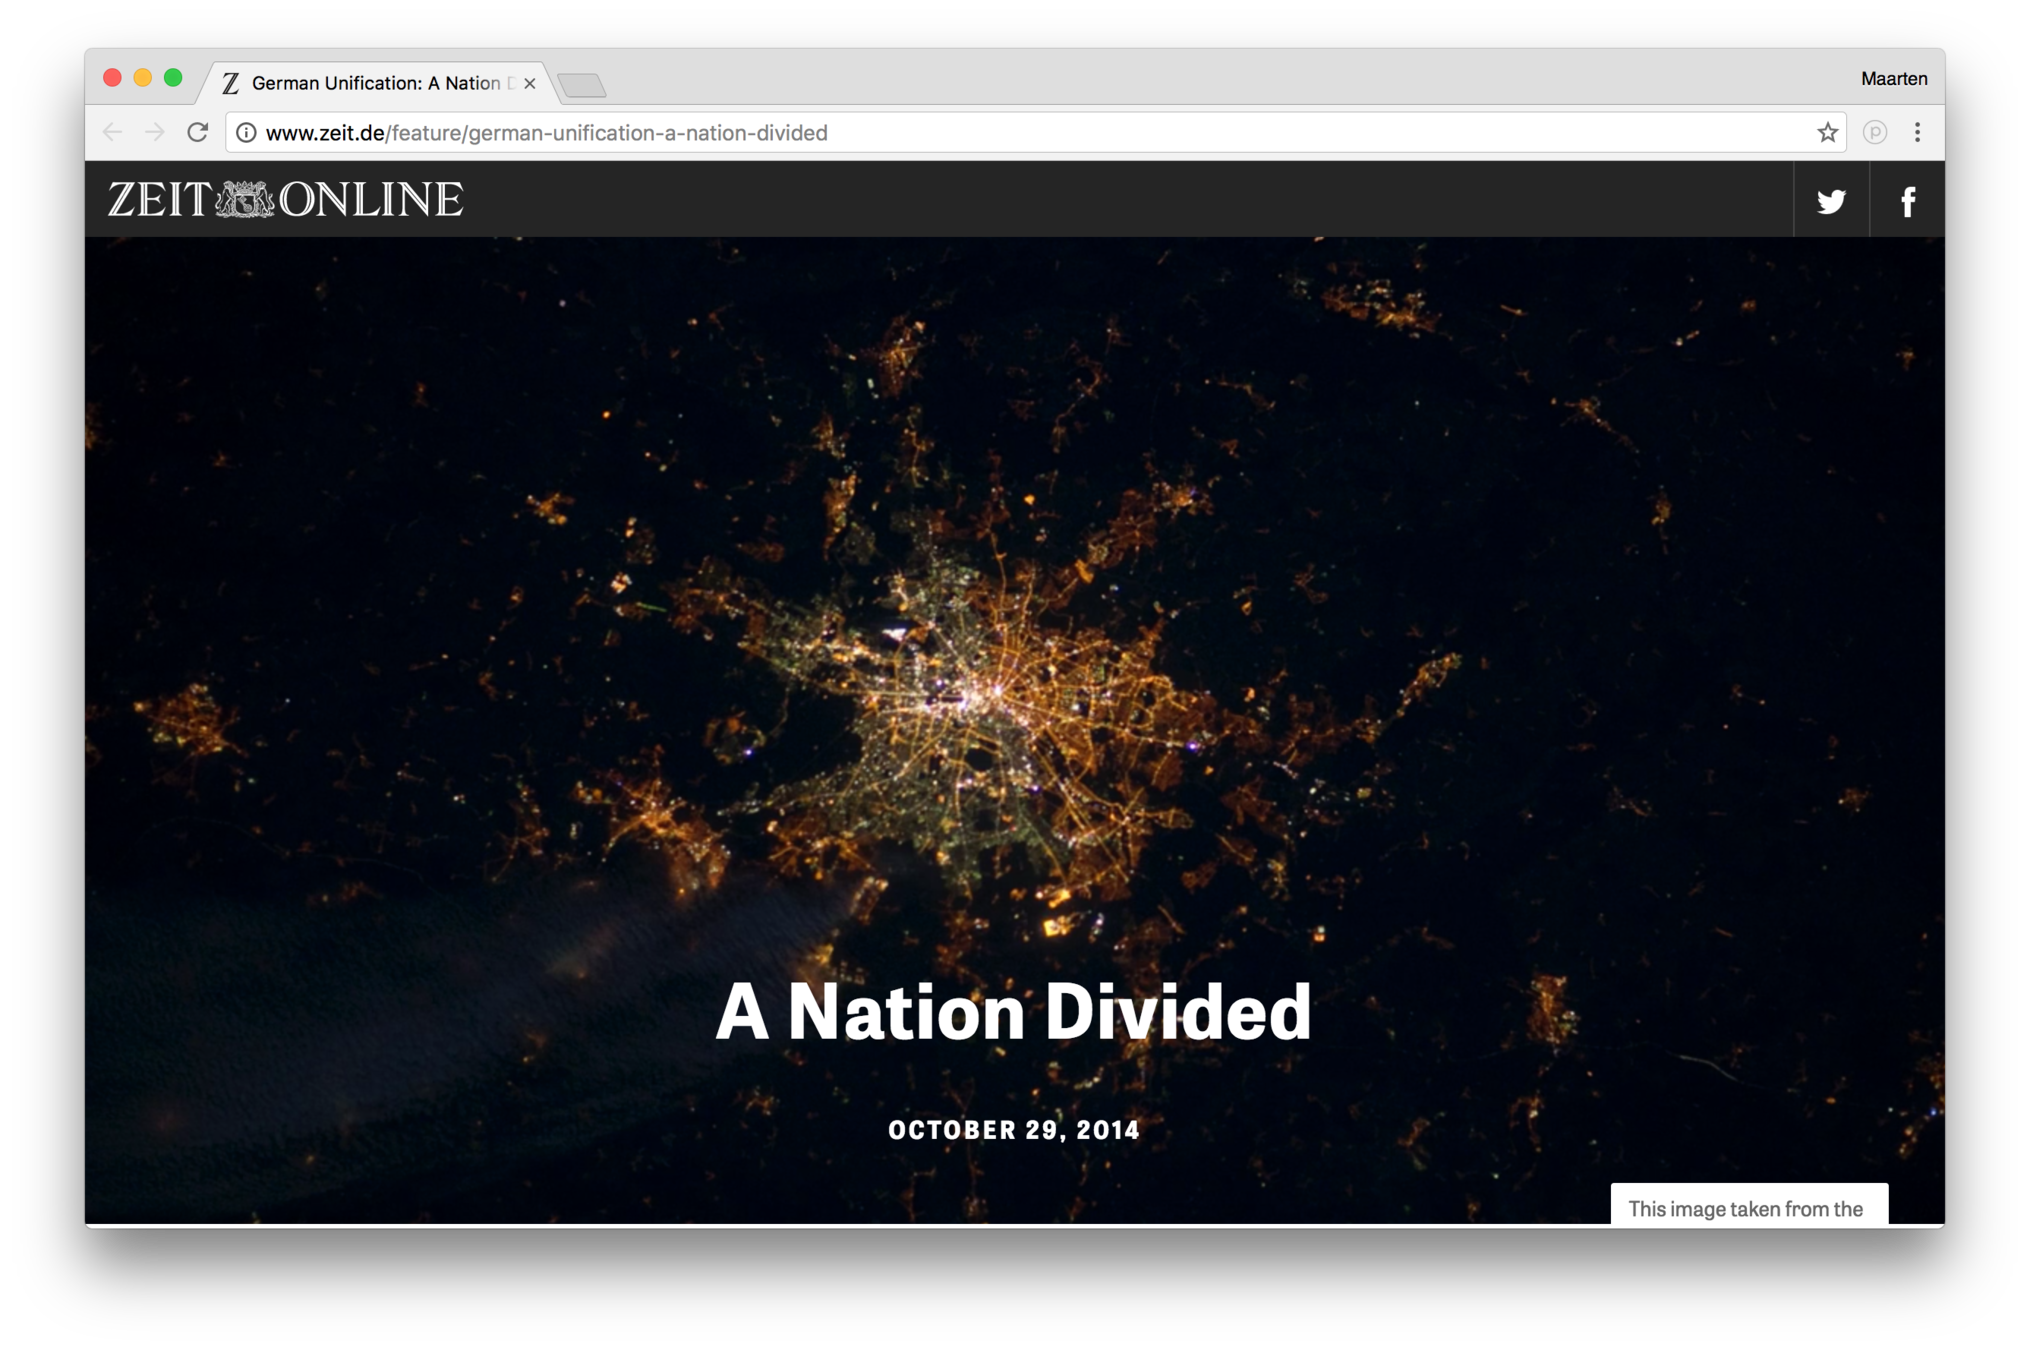
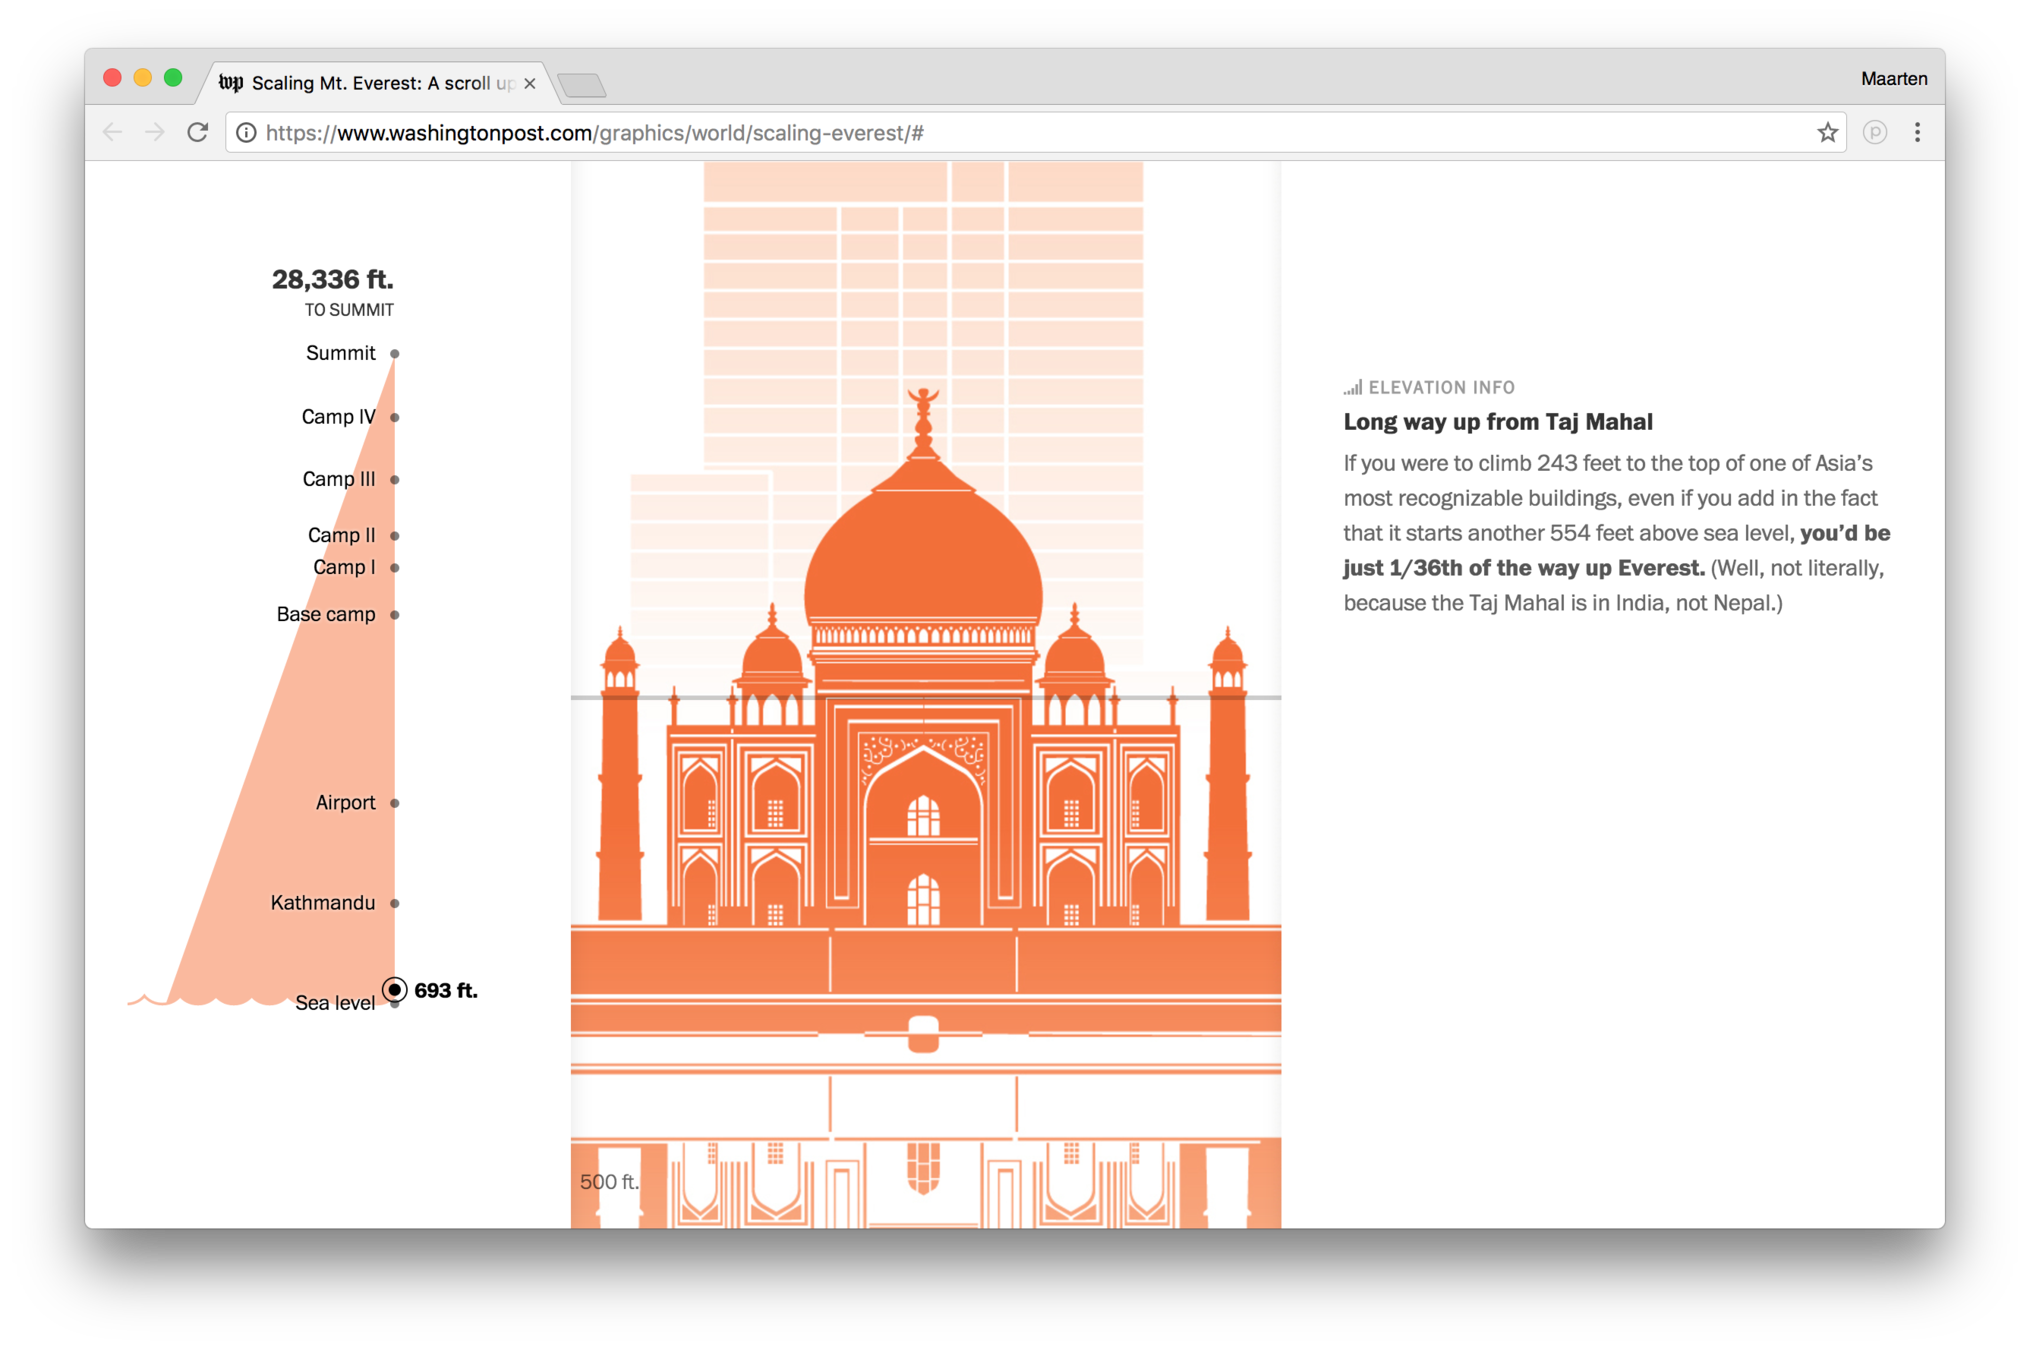
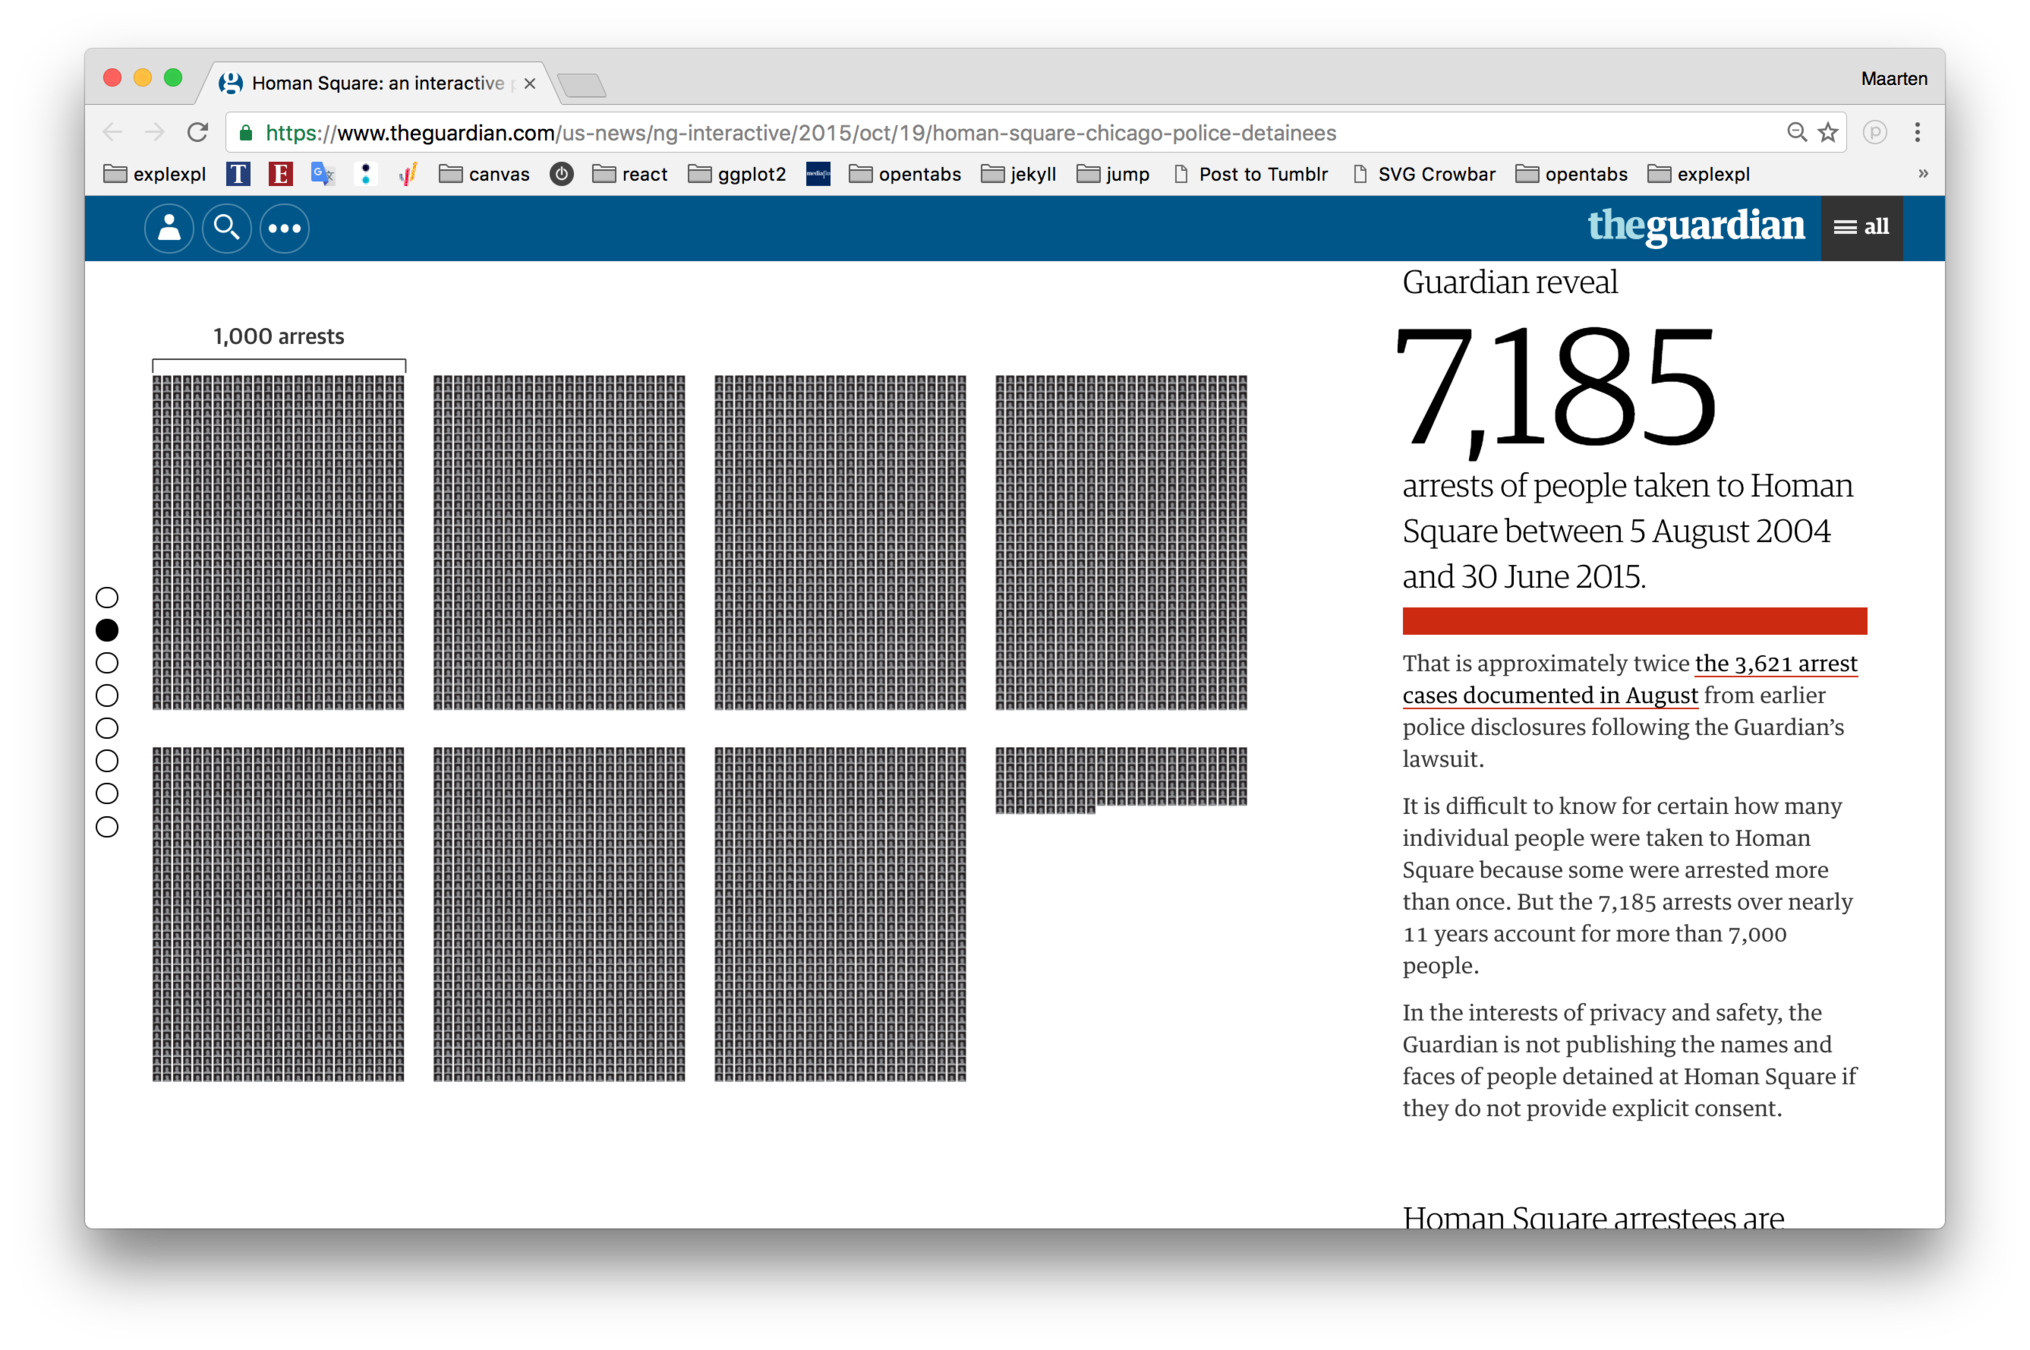
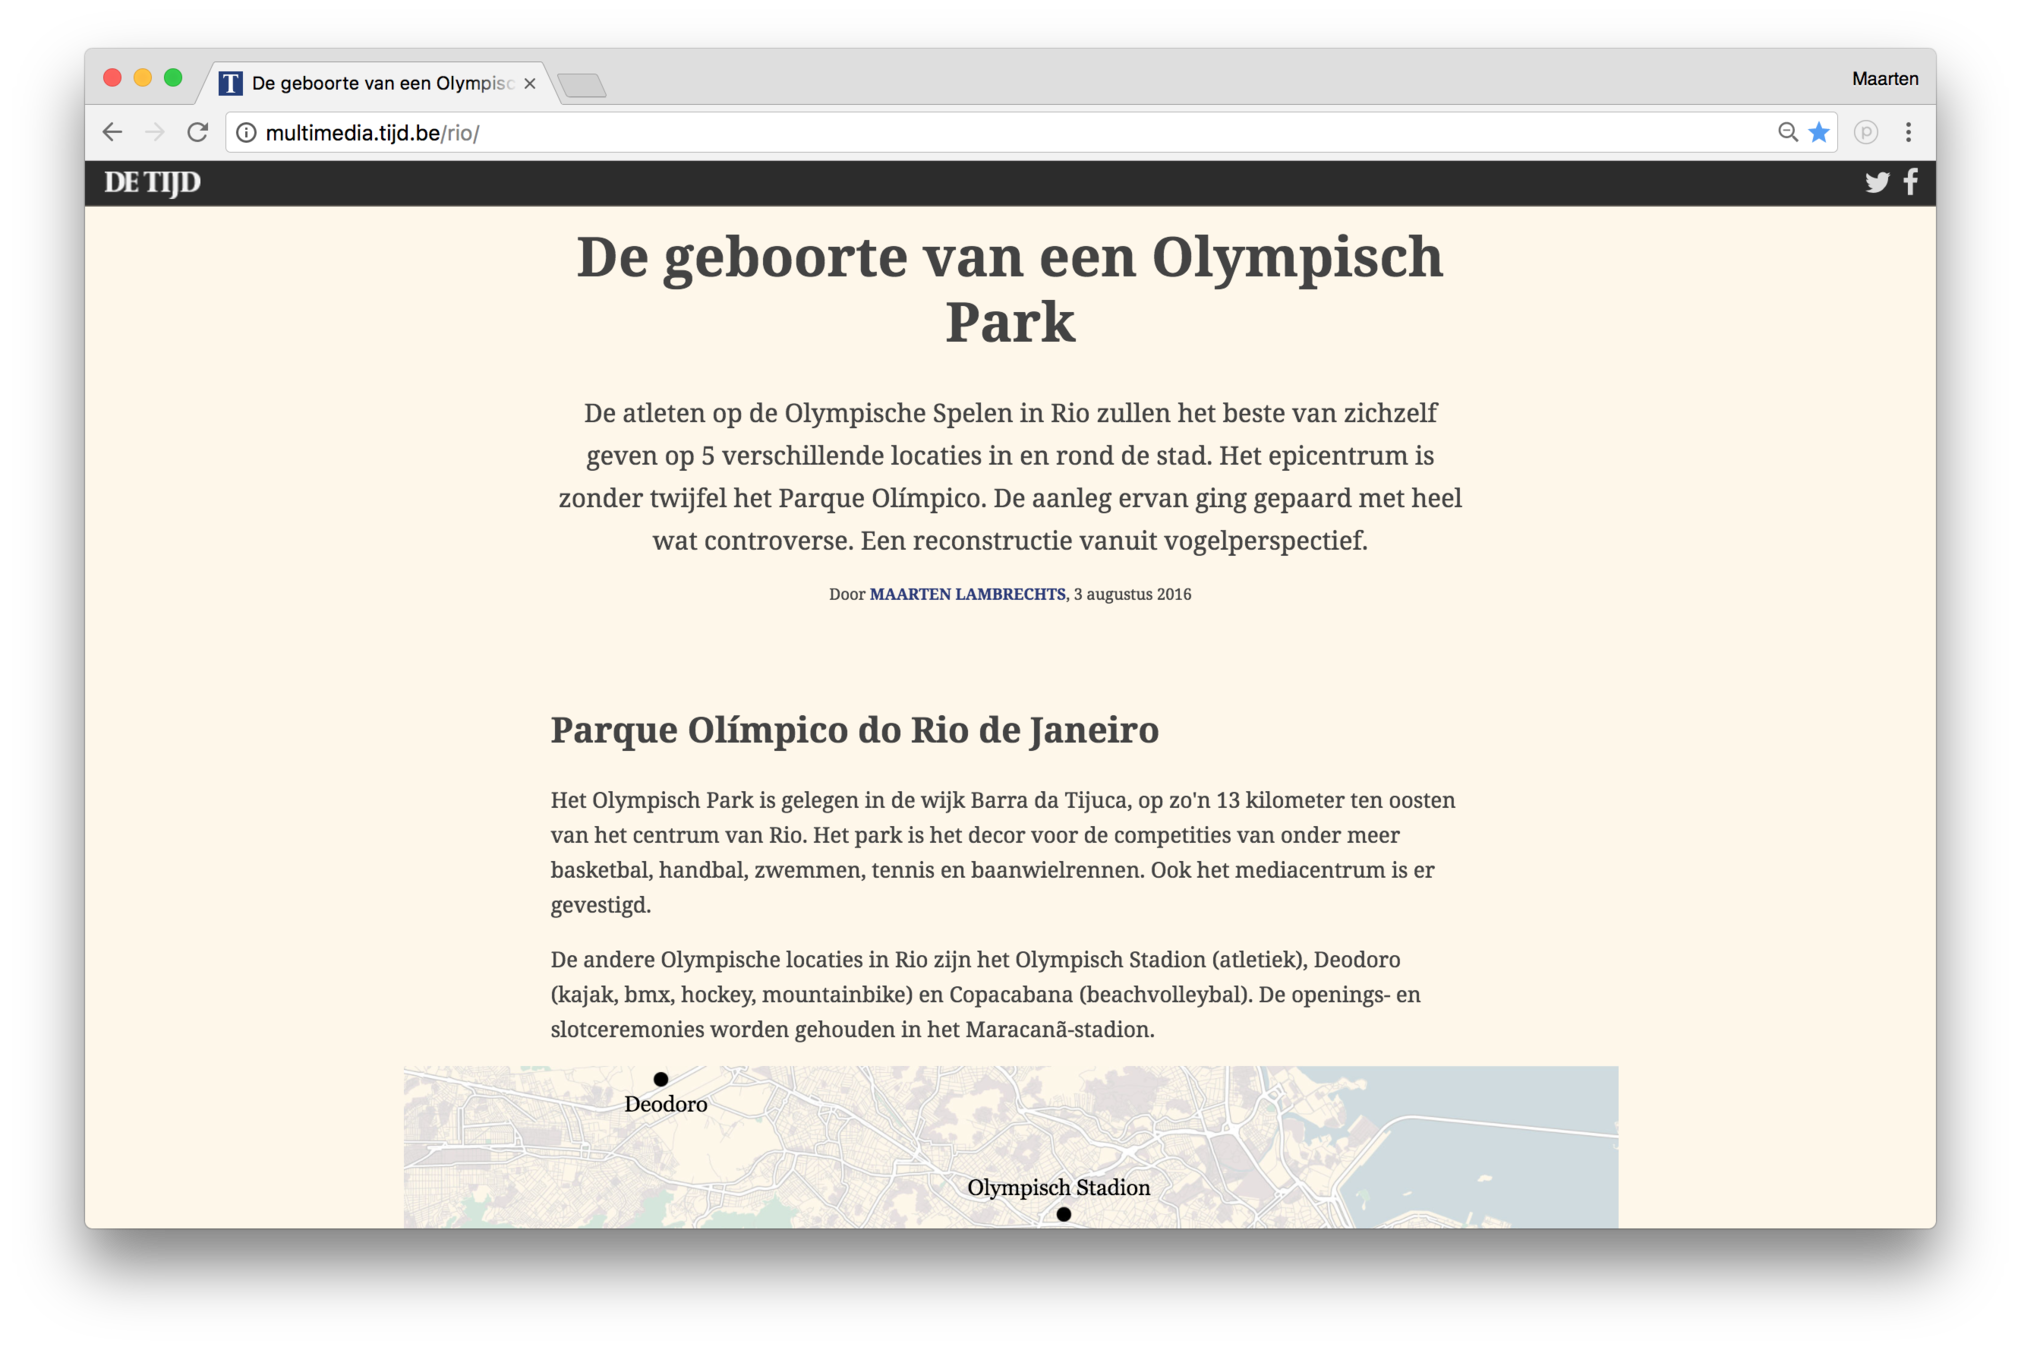
Steppers
"USERS DON'T CLICK"
"USERS just want to scroll"
"BUILDING INTERACTIVES IS EXPENSIVE"
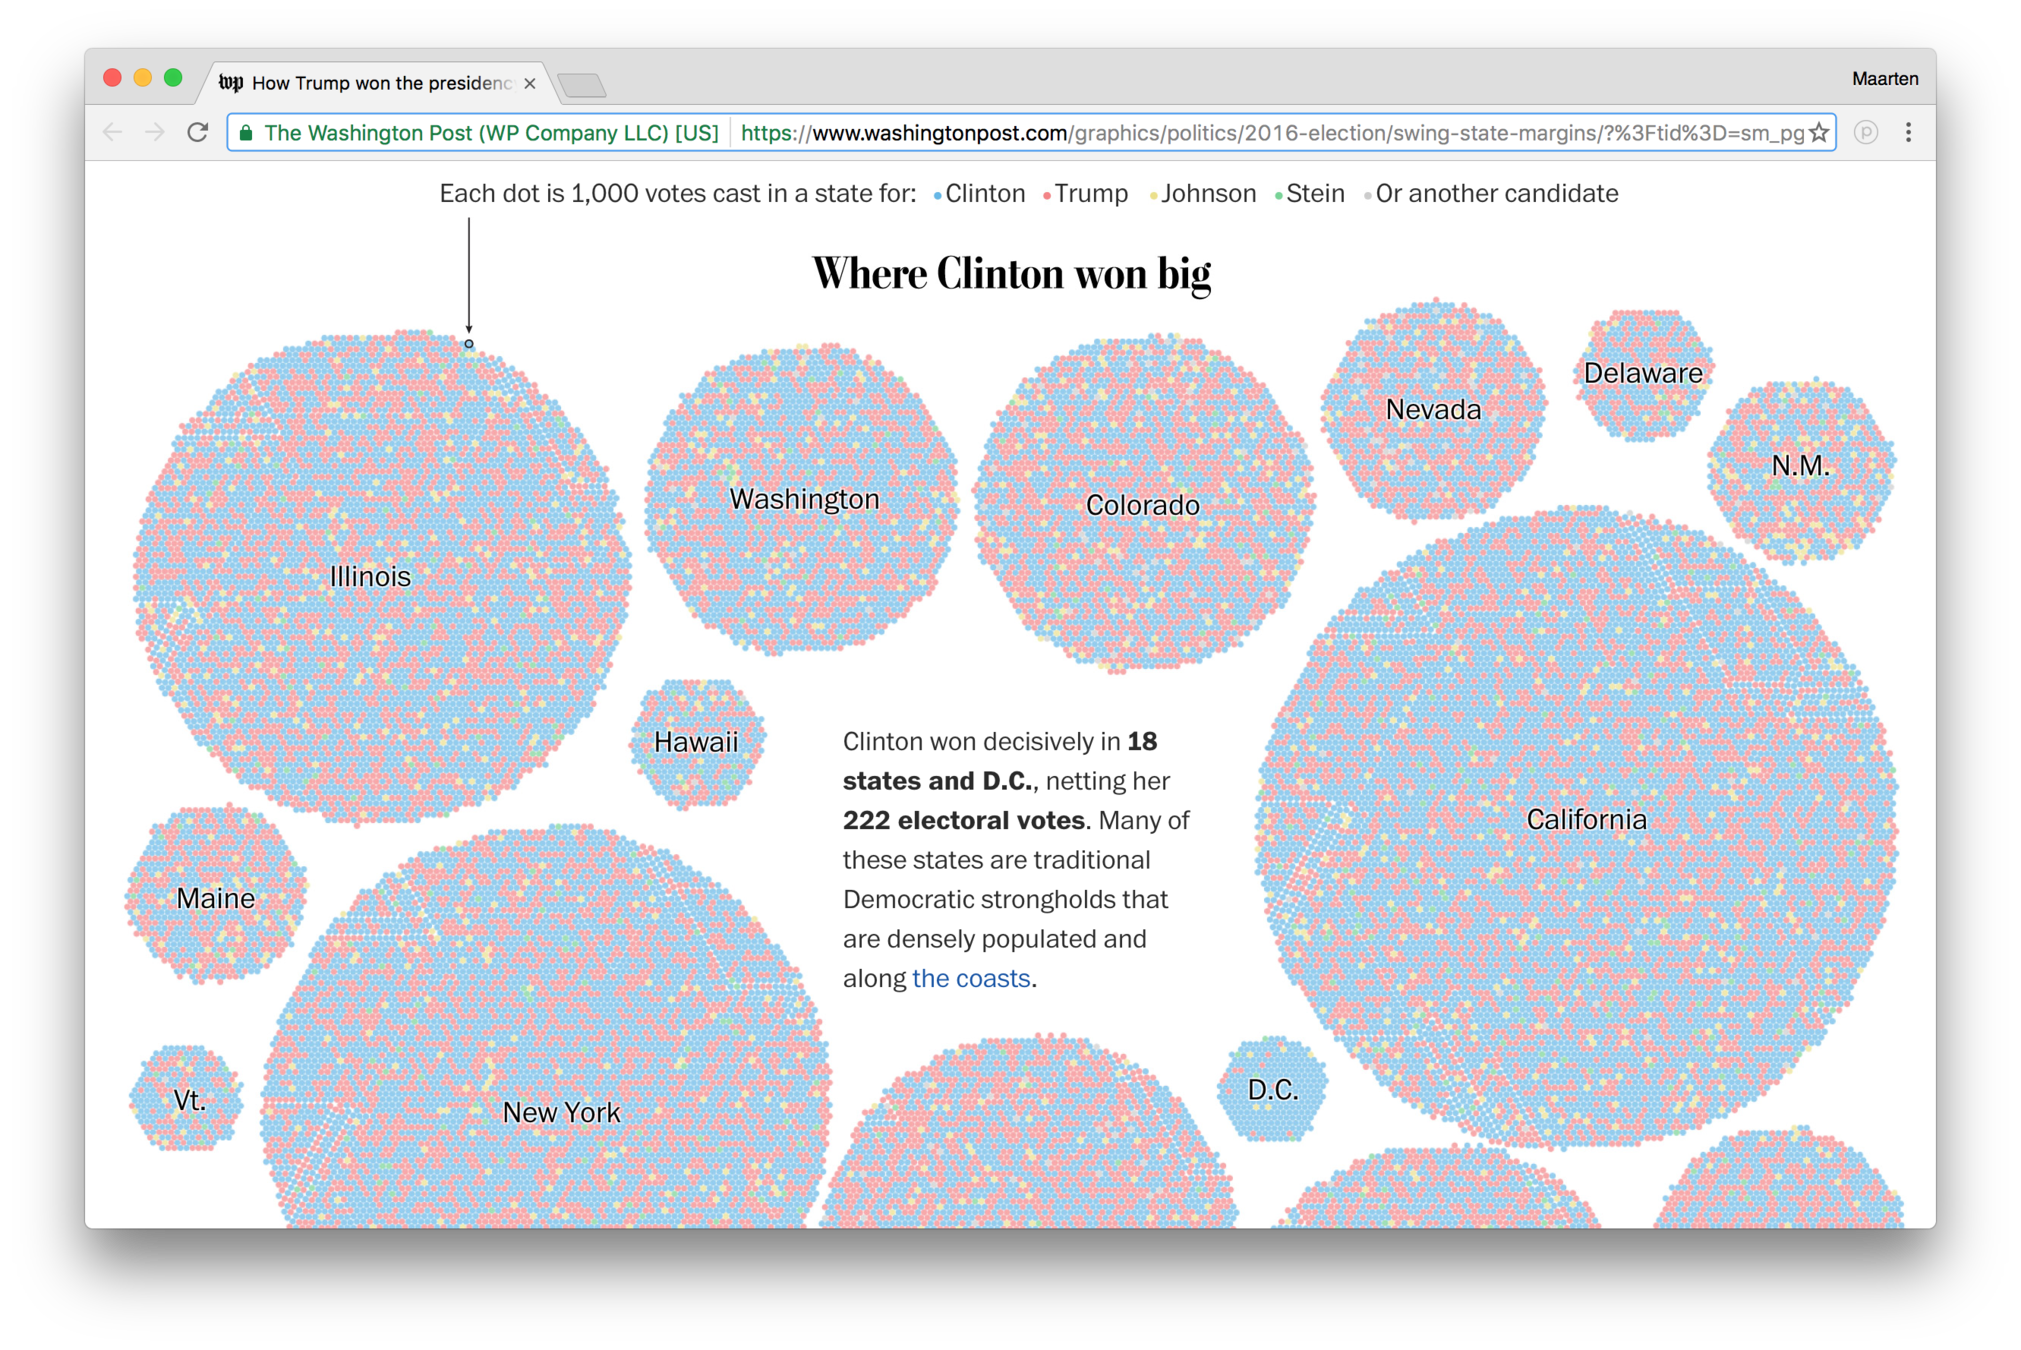
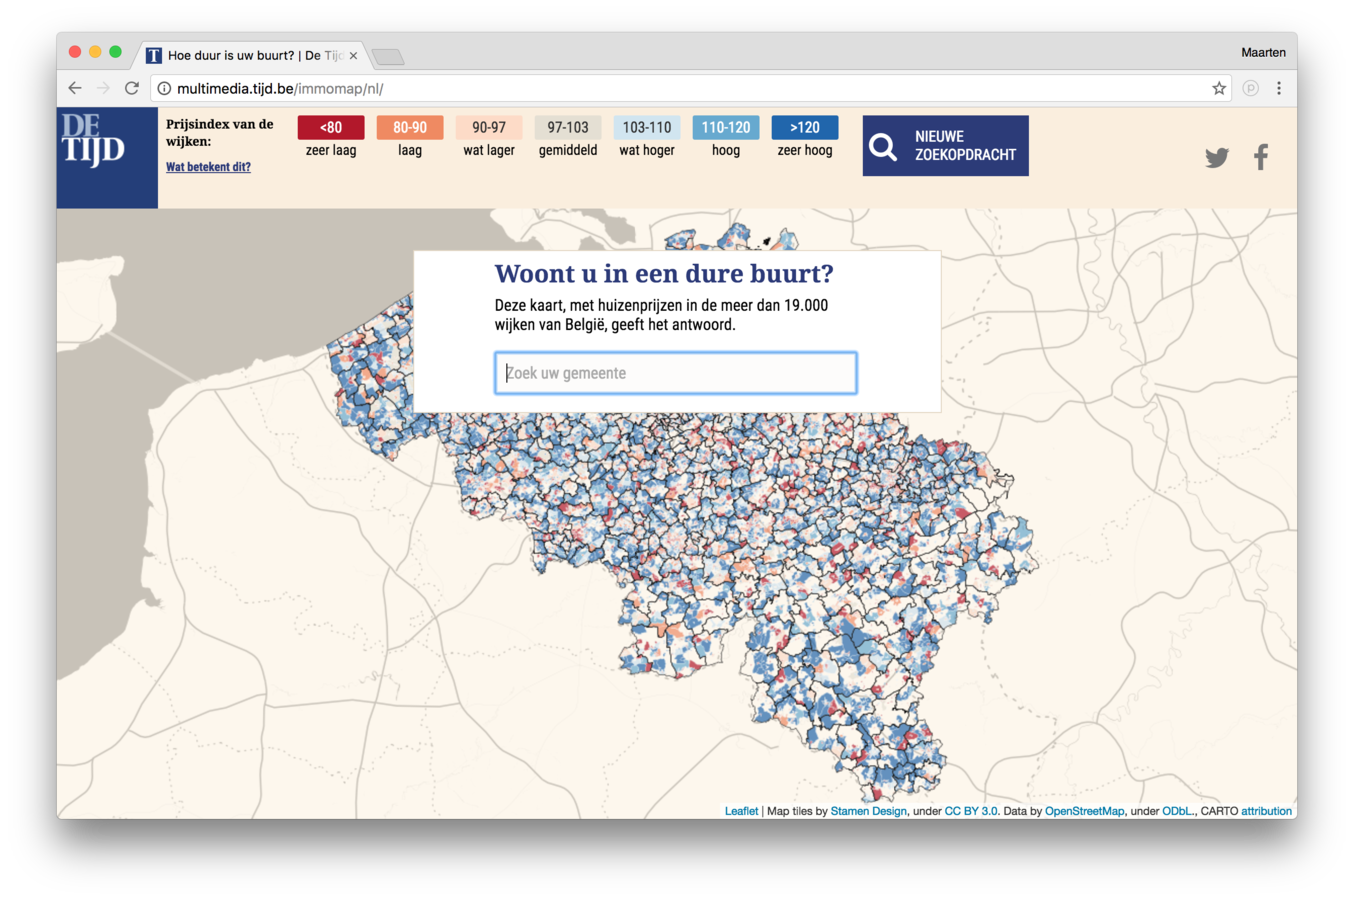
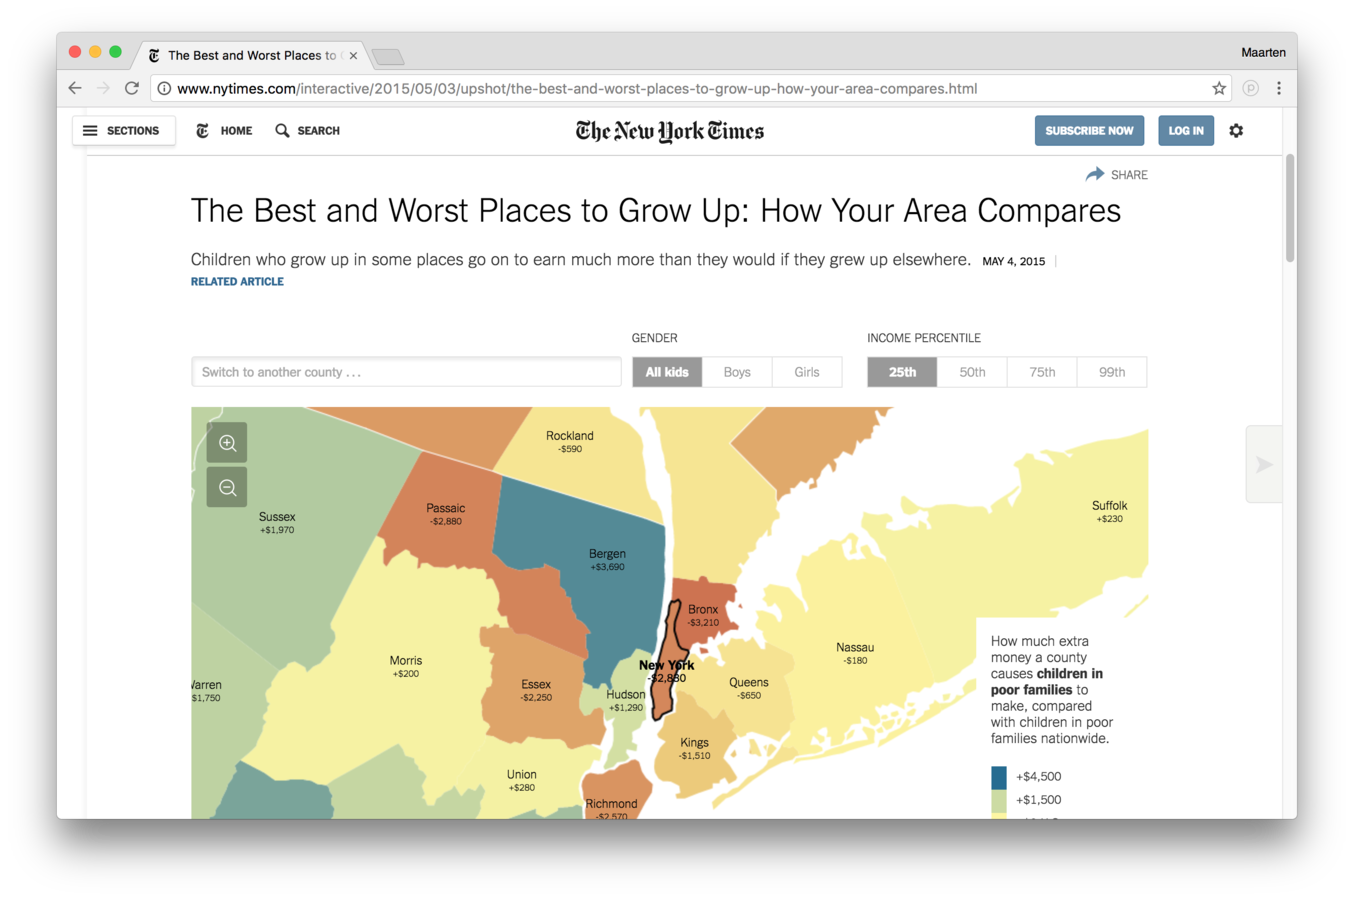
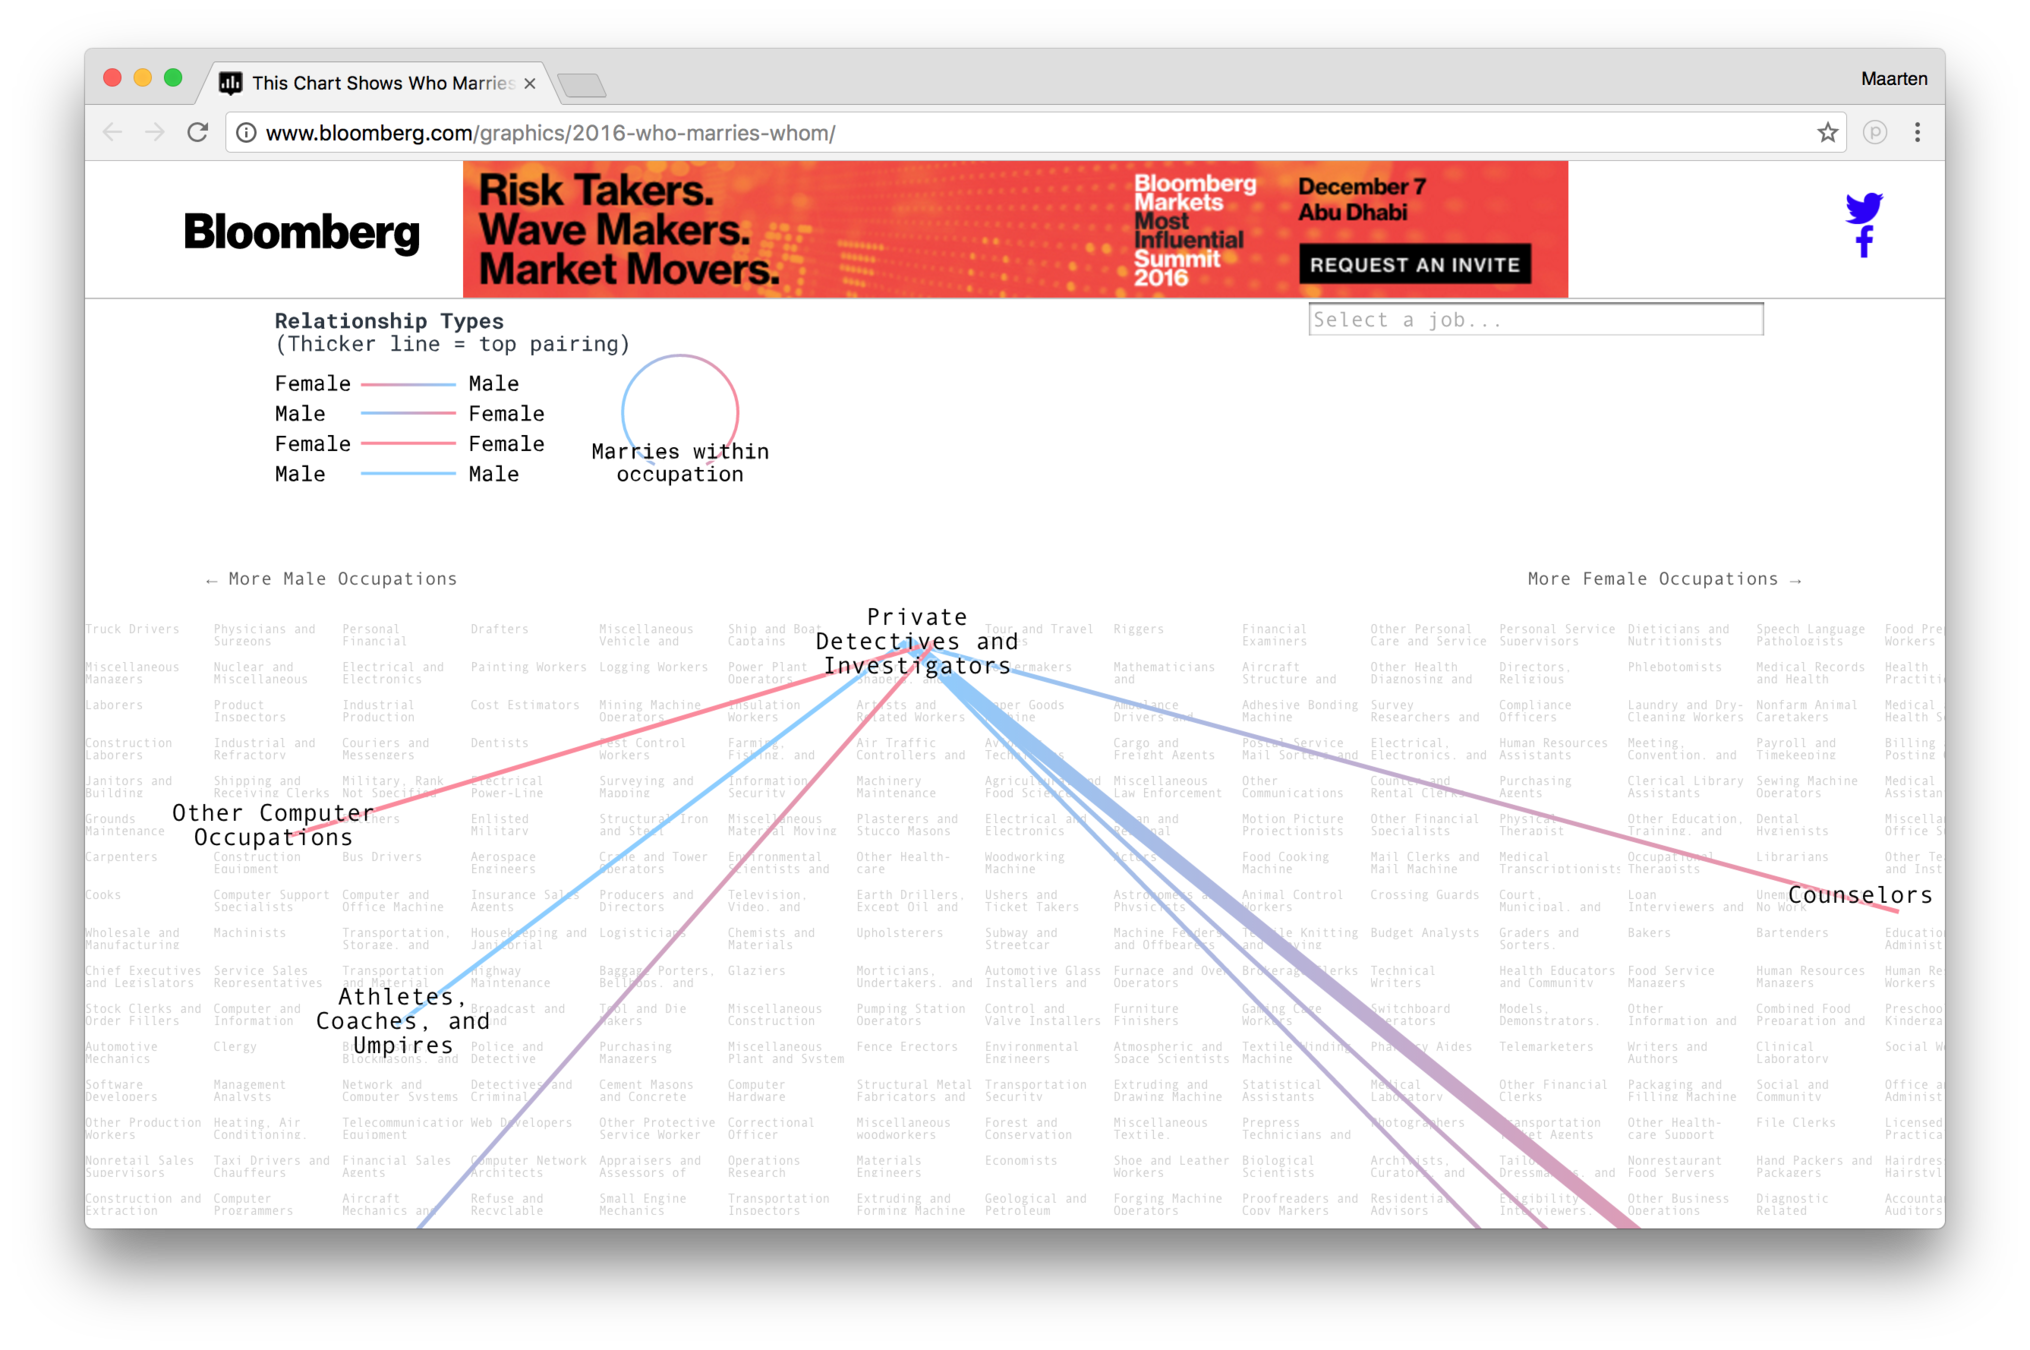
Interfaces
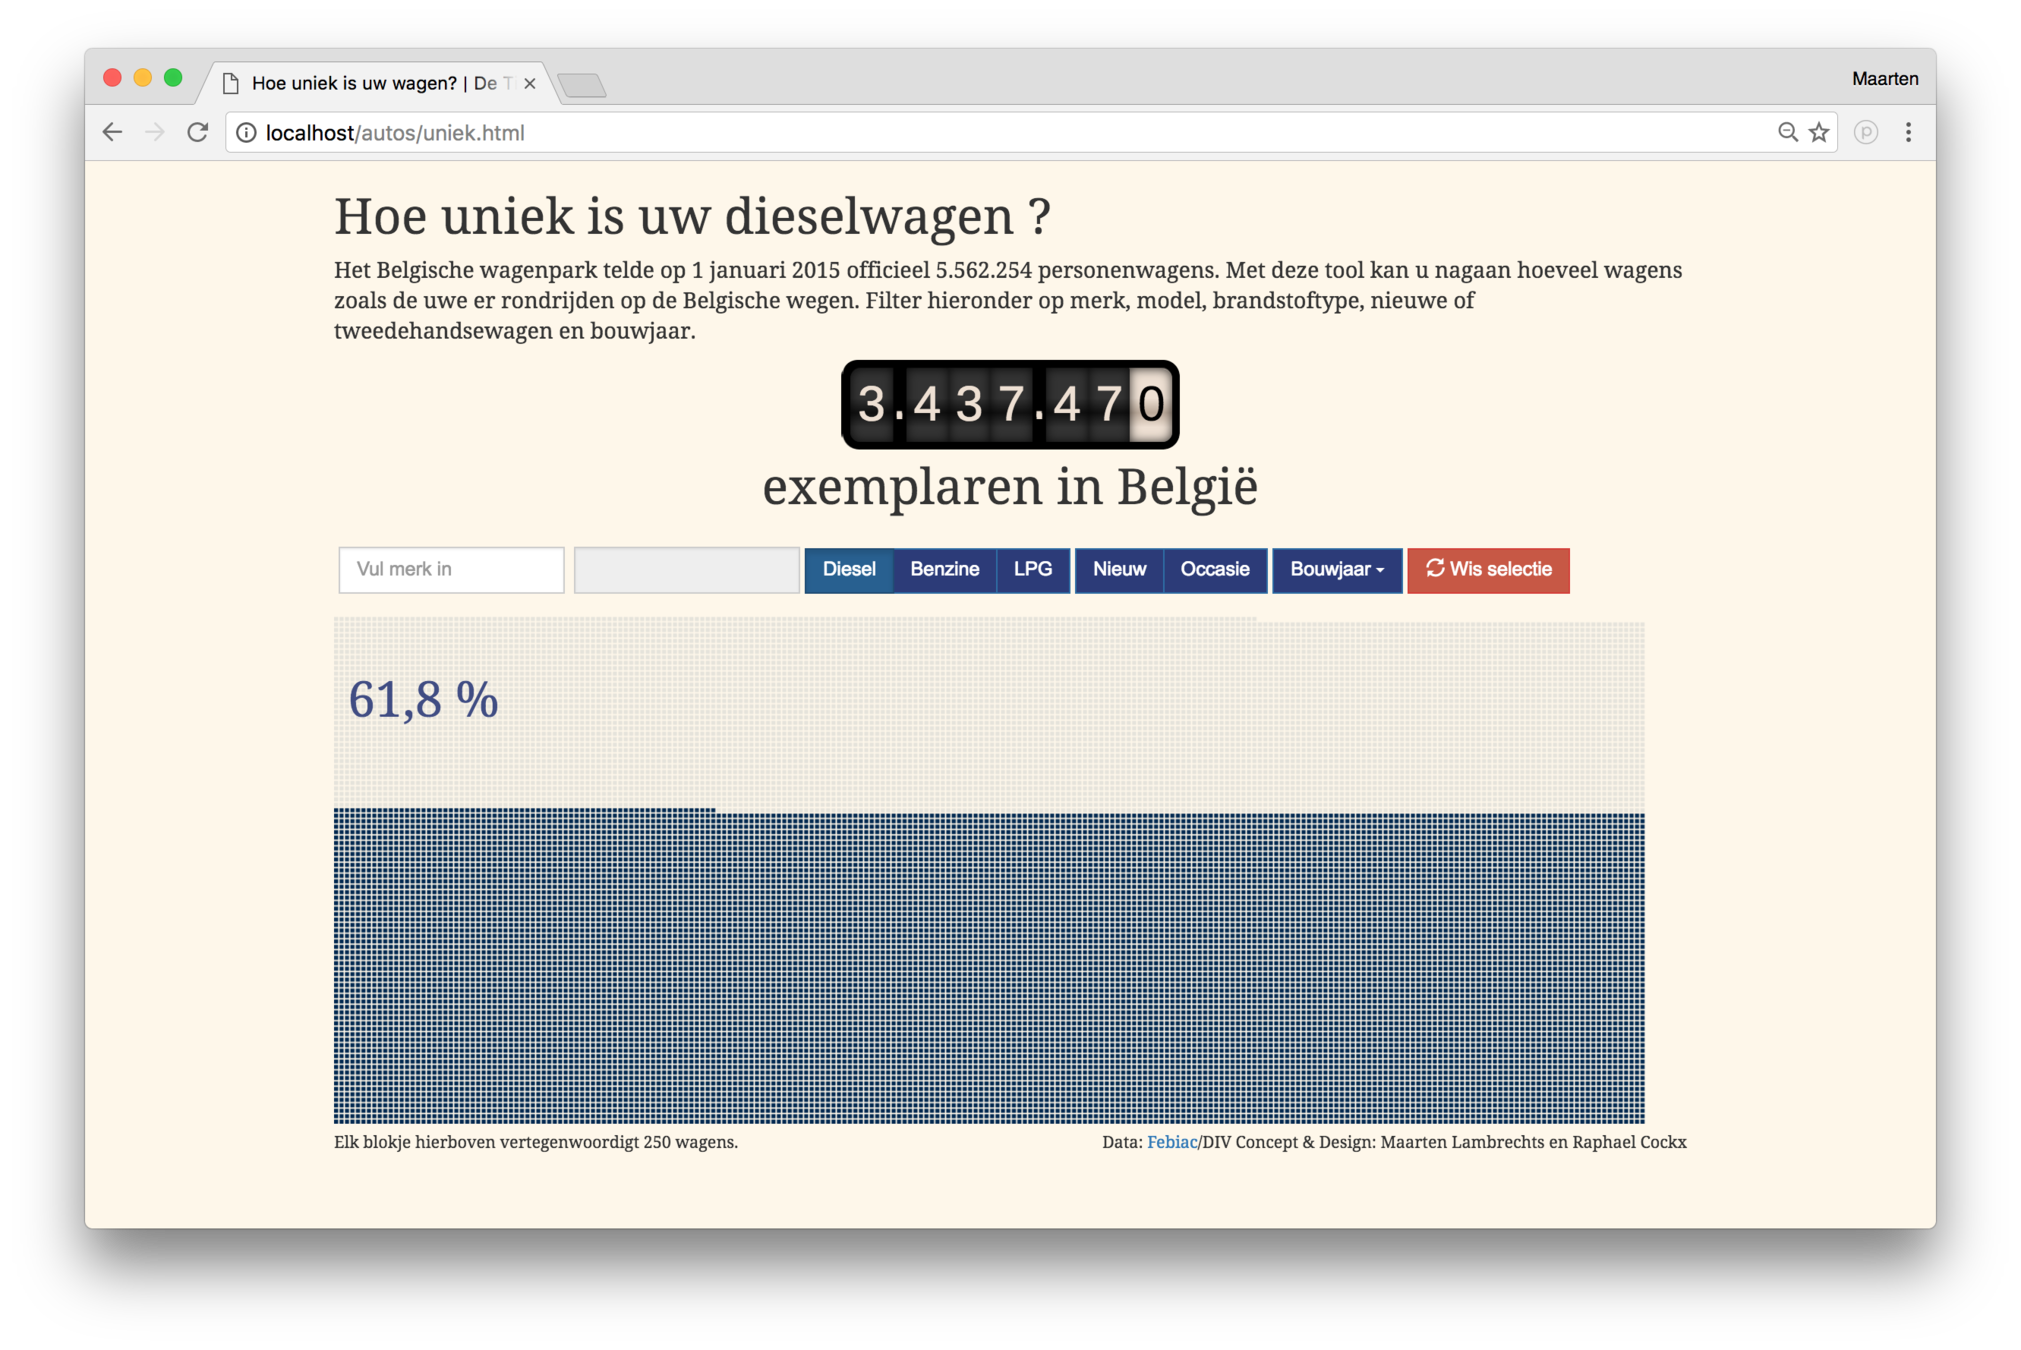
Explorable Explanations
Thank you!
www.maartenlambrechts.com
@maartenzam
Datavisualisatie en datastorytelling
By maartenzam


