Pitfalls in data
and how to avoid them
Maarten Lambrechts
Pitfalls in
metadata
statistics
visualisation
PITFALLS
Metadata


"... in Brussels, nearly 62 percent is of foreign origin"
Metadata = data about the data
Collected by whom?
Collected how?
Collected why?
Collected when?
Definitions?
Metadata
Determine validity of conclusions
Describe limitations on the use of the data
Determine comparability

Without correct units numbers are meaningless
PITFALLS
Statistics
Percentages & percentage points
"2.1% of mask wearers tested positive for COVID-19, versus 1.8% of non-mask-wearers. The difference is only 0.3%."
This is an difference of 0.3 percentage points
Or:
(2.1 - 1.8)/2.1 = 14% decrease in positive tests
% - % = percentage point
(new - old)/old = % change
That's not normal
Top 5 EU electricity consumers
| Country |
|---|
| 1. Germany |
| 2. France |
| 3. UK |
| 4. Italy |
| 5. Spain |
| Electricity consumption (Gwh) |
|---|
| 517.377 |
| 442.372 |
| 303.903 |
| 286.027 |
| 232.515 |
Congrats: a population ranking!
Please divide by the number of people
Top 5 EU electricity consumers
| Country |
|---|
| 1. Iceland |
| 2. Norway |
| 3. Finland |
| 4. Sweden |
| 5. Luxembourg |
| Elektricity consumption (Mwh/cap) |
|---|
| 49,7 |
| 21,5 |
| 14,7 |
| 12,6 |
| 10,6 |
Especially relevant for maps


Make numbers comparable
(=normalising):
per capita, per surface area, ...
Mean vs median
How many soulmates do you think a person can have?
The median?
Rank the data: the median is the middle value
The median is less sensitive to outliers. Use it!
Distributions
Summary statistics rarely describe somebody's lived experience and never ring true for the whole population

Data are much more than averages
Use distributions whenever you can
Correlation vs causality


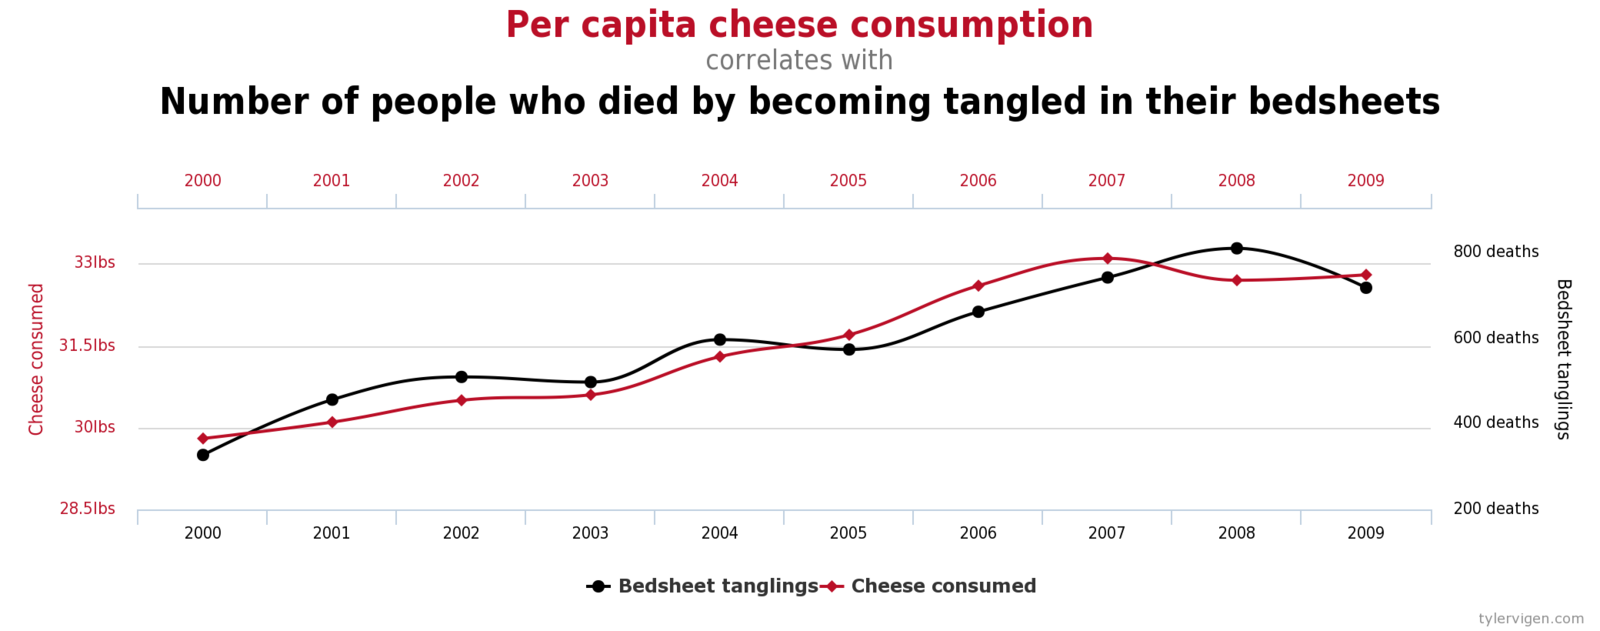
Correlation. Is. Not. Causation.
Confidence
intervals


"The margin of error is 3,2 percent."

Uncertainty is inherent to survey results. Keep the margins of error in mind
Big & small chances
People who ate 76 grams of red and processed meat per day had a 20% higher chance of developing colorectal cancer compared to others, who ate about 21 grams a day.
Of 10.000 people in the study who ate 21 grams of red or processed meat each day, 40 developed colorectal cancer. Among those who ate 76 gram per day, 48 did so.
21 grams => 40/10.000 = 0.4%
76 grams => 48/10.000 = 0.48%
+20%, or +0.08 percentage point
+20% of a small chance is still a small chance
The researchers said B.1.1.7 led to 227 deaths in a sample of 54,906 patients. That compares with 141 deaths in roughly the same number of patients who were infected with other strains.
Earlier strains: 141/54906 = 0,26%
UK strain: 227/54906 = 0,41%
But still 86 more deaths
But relatively small differences can be meaningful
Apples & oranges

Compare
regions to regions
countries to countries
apples to apples
oranges to oranges
Exponential growth
Exponential
≠
skyrocketing
Percent & percentage points
That's not normal
Mean vs median
Distributions
Correlation vs causality
Confidence intervals
Big & small chances
Apples and oranges
Exponential growth
PITFALLS
Visualisation


Keep the pies for dessert
Don't cut bars
Respect proportions


Don't cut time axes


Compare apples to apples


Scale circles by surface area


Don't do 3D
Double the axes,
double the mischief


Every map is a lie
Keep the pies for dessert
Don't cut bars
Respect proportions
Don't cut time axes
Compare apples to apples
Scale circles op by surface area
Don't do 3D
Avoid double axes
Every map is a lie
Thanks!
slides.com/maartenzam/pitfalls-mediahuis
Pitfalls in data
By maartenzam
Pitfalls in data
- 5,823


