Data visualisation in science
& science communication
December 12 2017
Maarten Lambrechts
Data visualization in Sociology
LESSONS FROM DATA JOURNALISM
A little bit of history
"As knowledge increases amongst mankind, and transactions multiply, it becomes more and more desirable to abbreviate and facilitate the modes of conveying information from one person to another, and from one individual to the many."
William Playfair, 1786
"Everything that can be expressed in numbers can be represented by lines."
John Playfair


Explanatory Data Visualization
I
| Party | Oct 2010 | Sep 2012 | May 2013 | Oct 2013 |
|---|---|---|---|---|
| N-VA | 28,2 | 36,3 | 32,1 | 27,9 |
| CD&V | 17,6 | 18,5 | 17,4 | 19 |
| SP.A | 14,9 | 14,5 | 14,7 | 13,4 |
| VB | 12,6 | 9,5 | 10,6 | 10,6 |
| VLD | 14 | 10,7 | 10,1 | 13,8 |
| Groen | 7,1 | 7,9 | 9,5 | 10 |
| LDD | 3,7 | 1,3 | 0,4 | 1,3 |
| PVDA | 5 | 5 | 2,5 | 3,9 |
| Other | 2 | 1,2 | 2,6 | 0,1 |

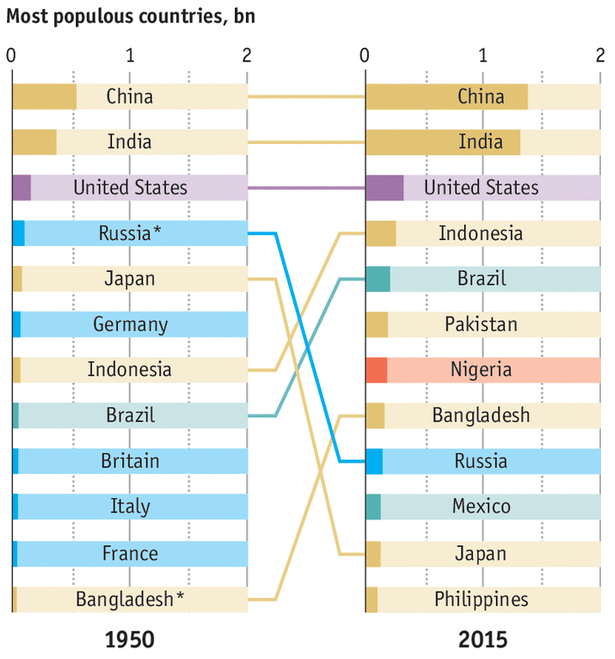
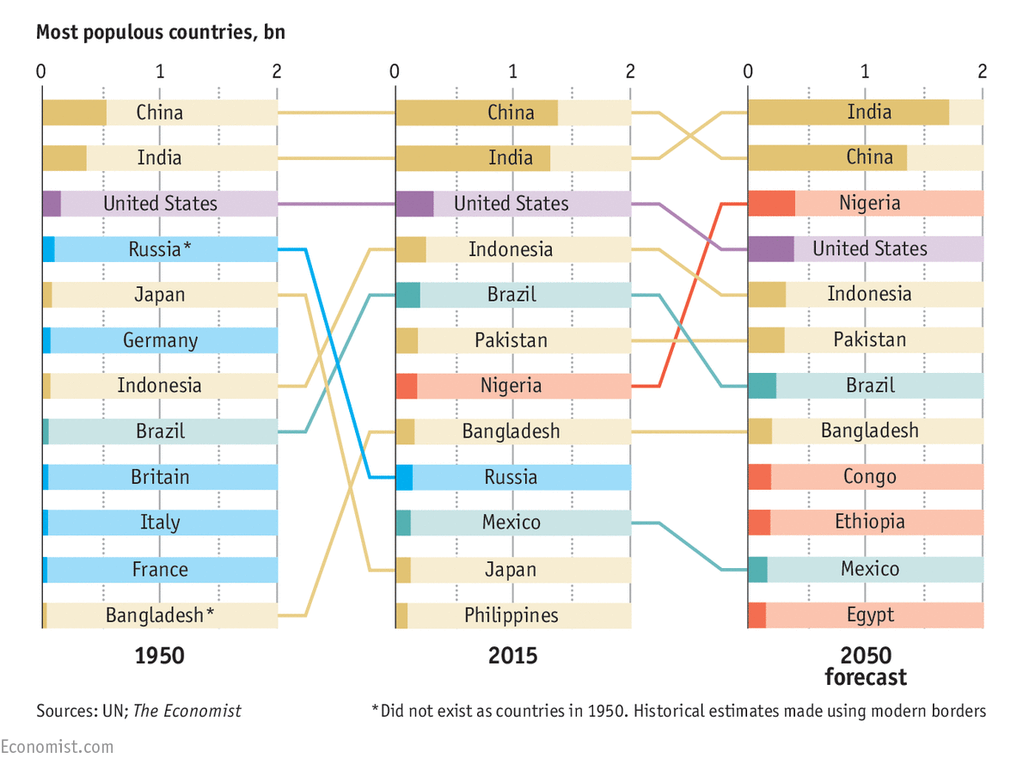
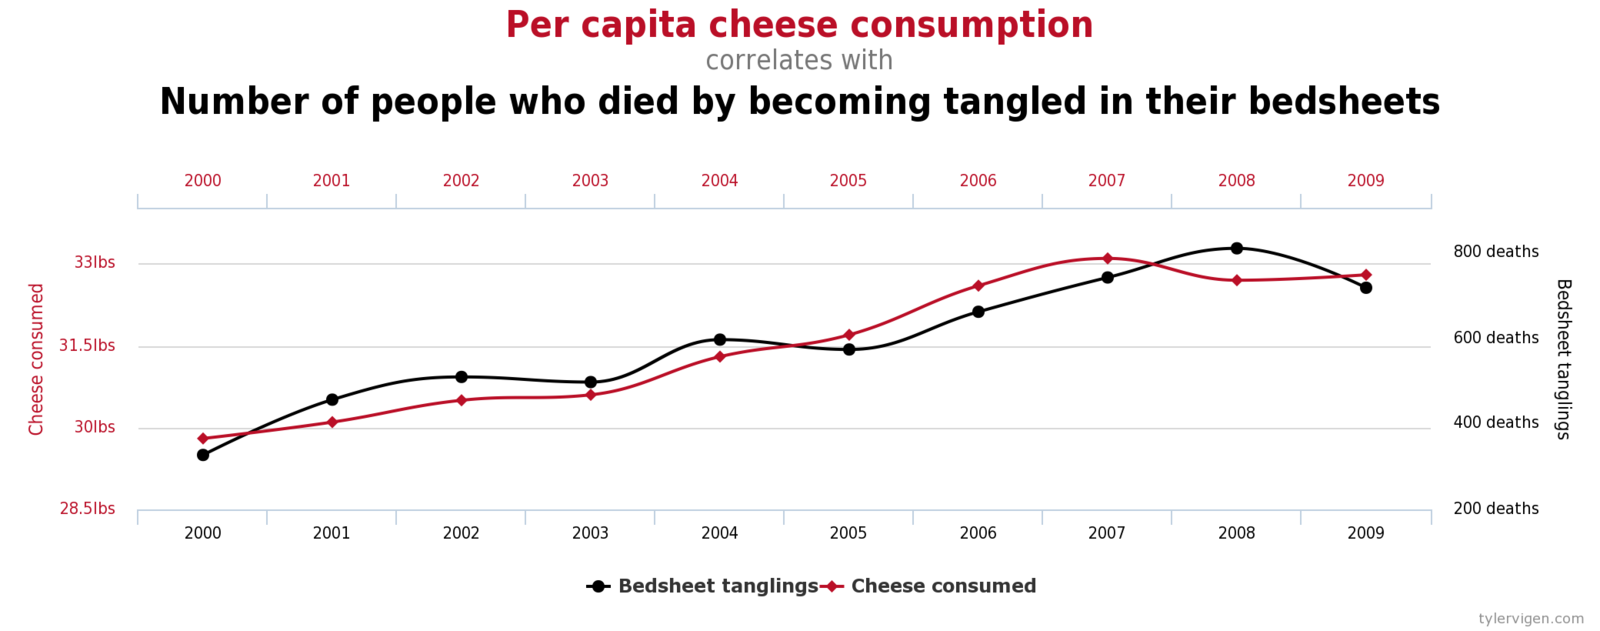
Lessons from data journalism
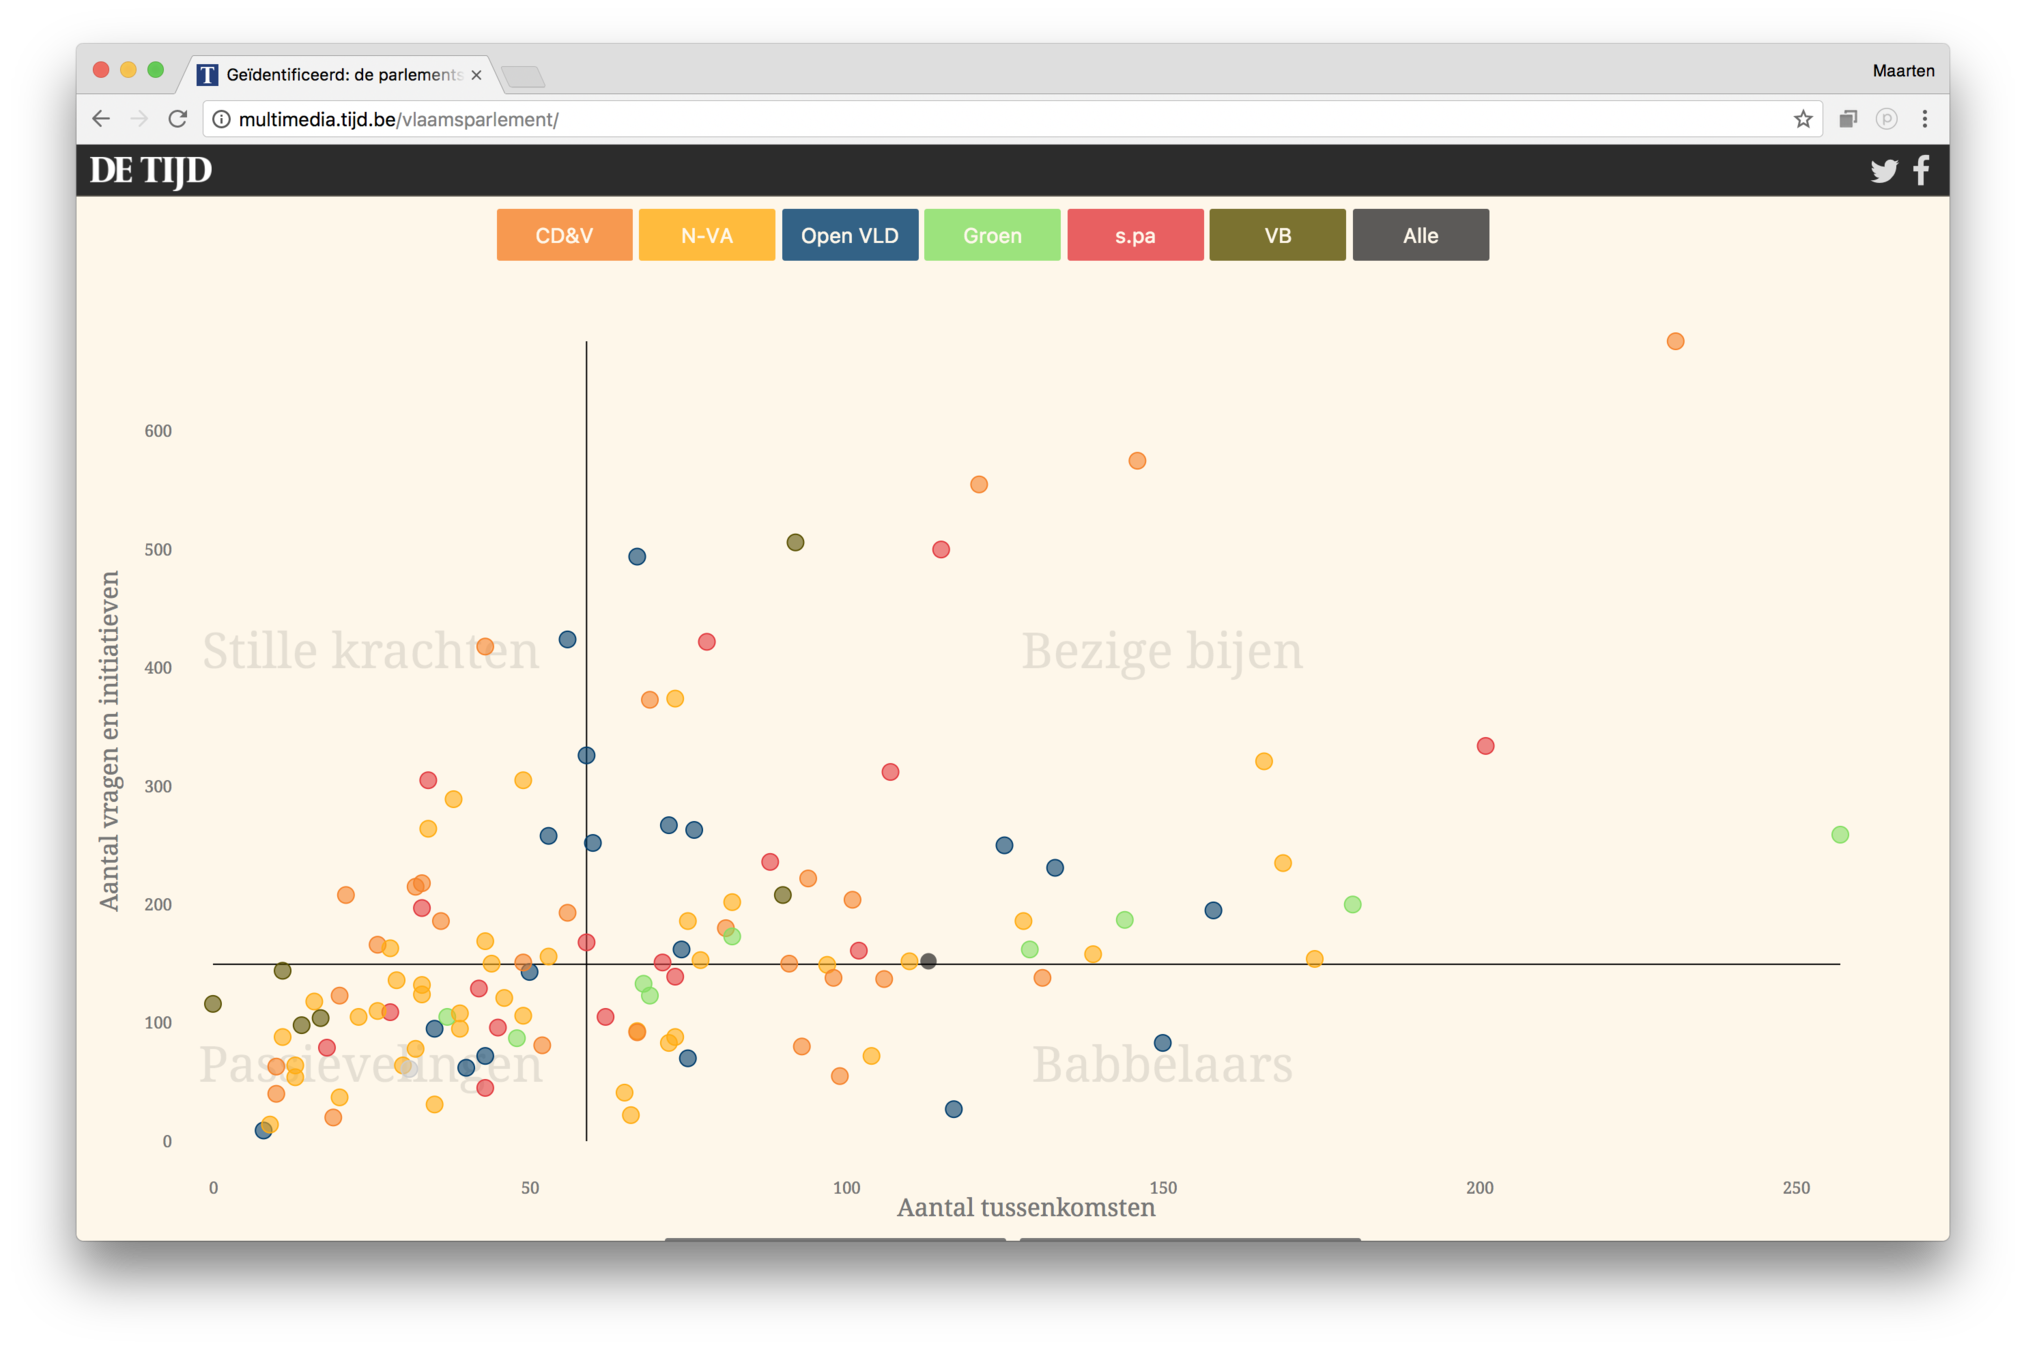
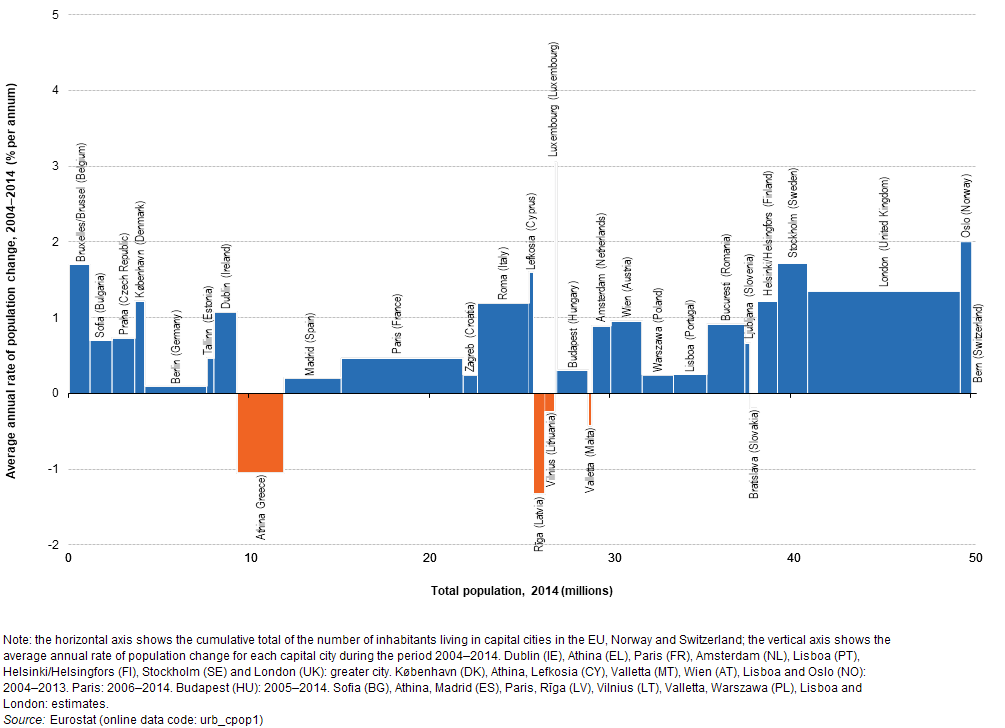
1. Respect the basics


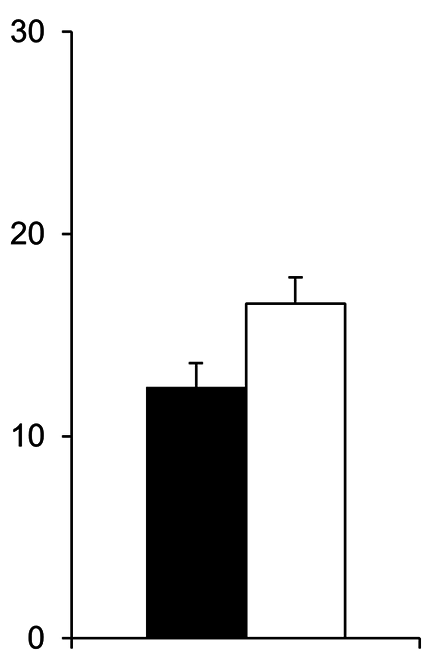
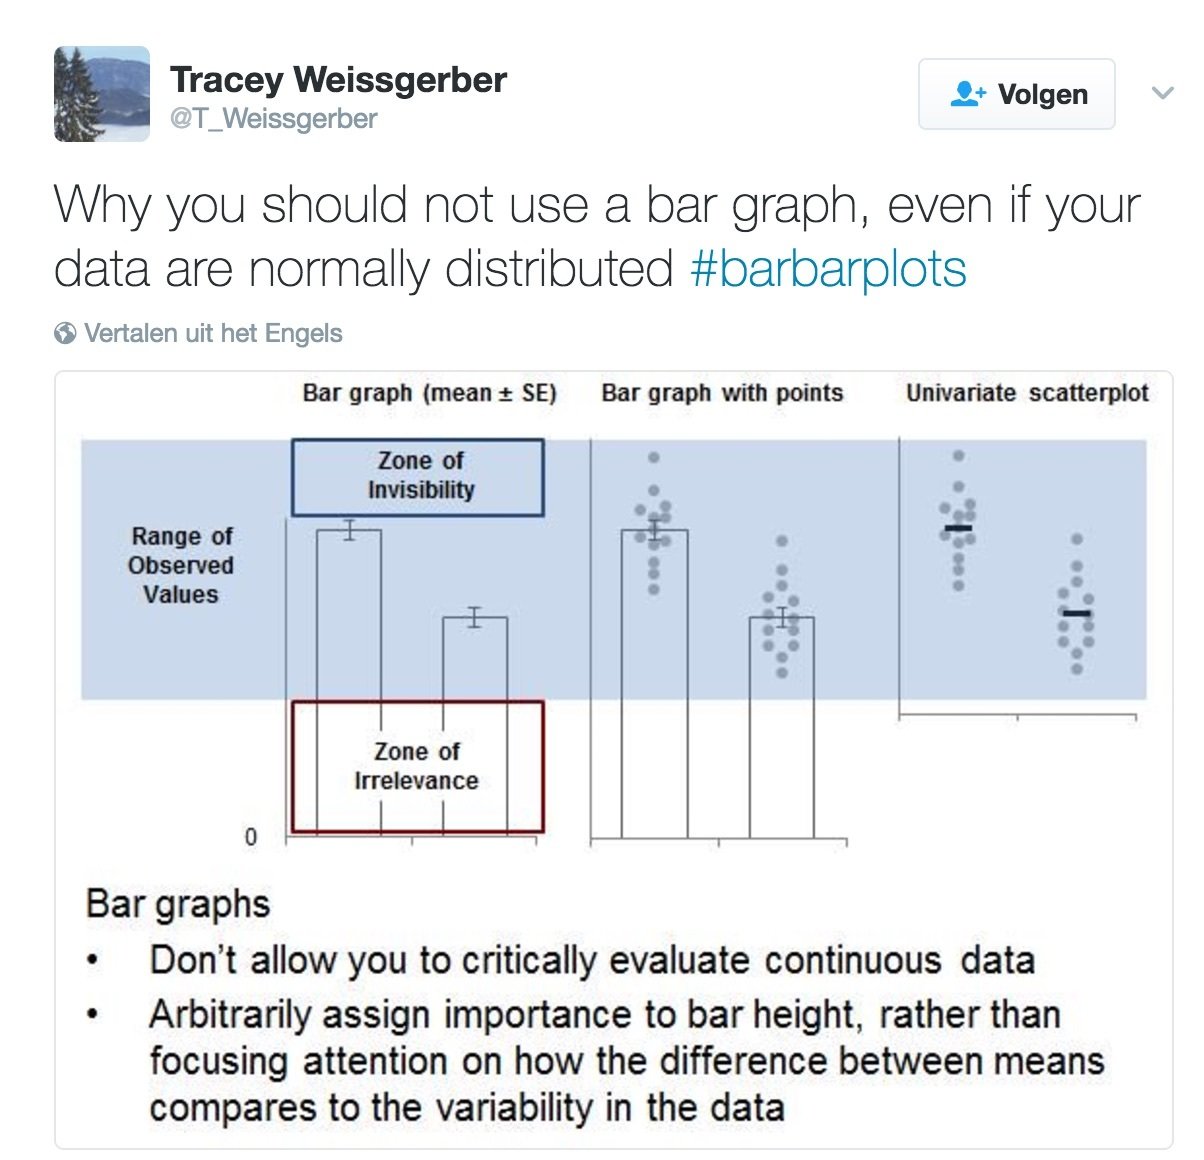
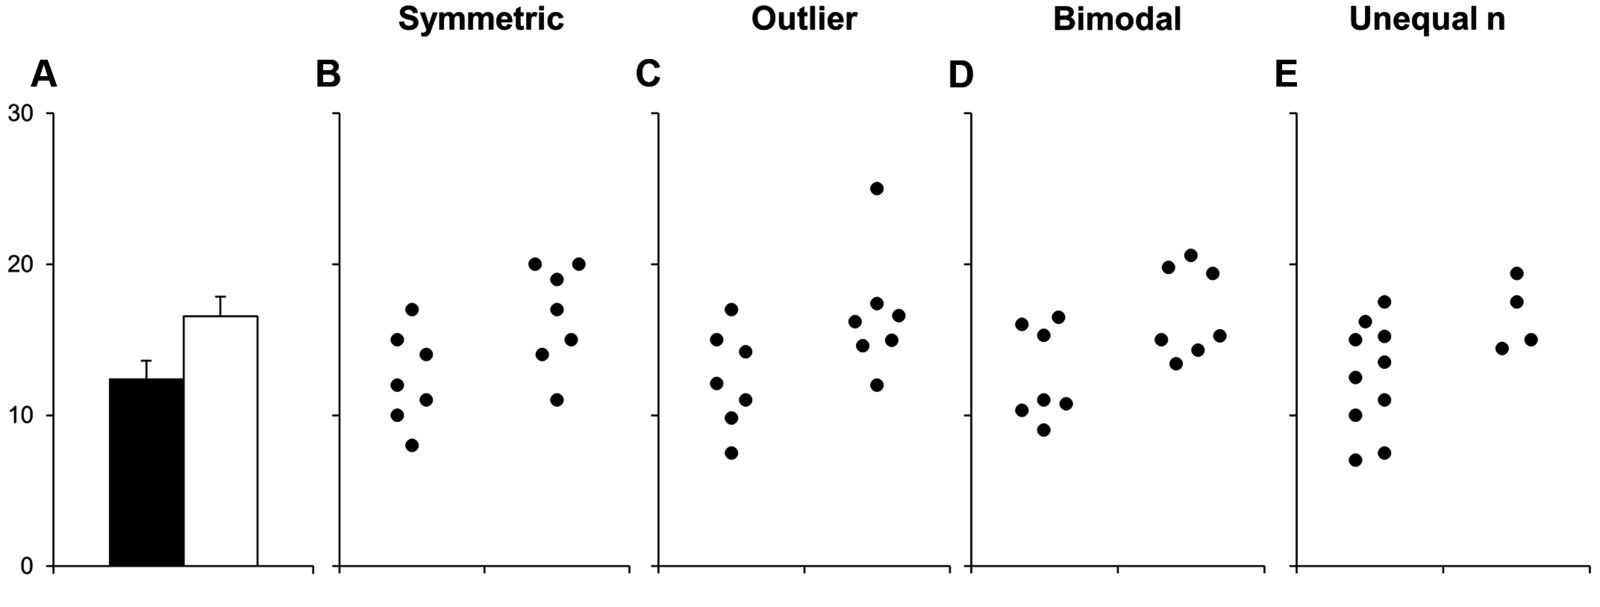
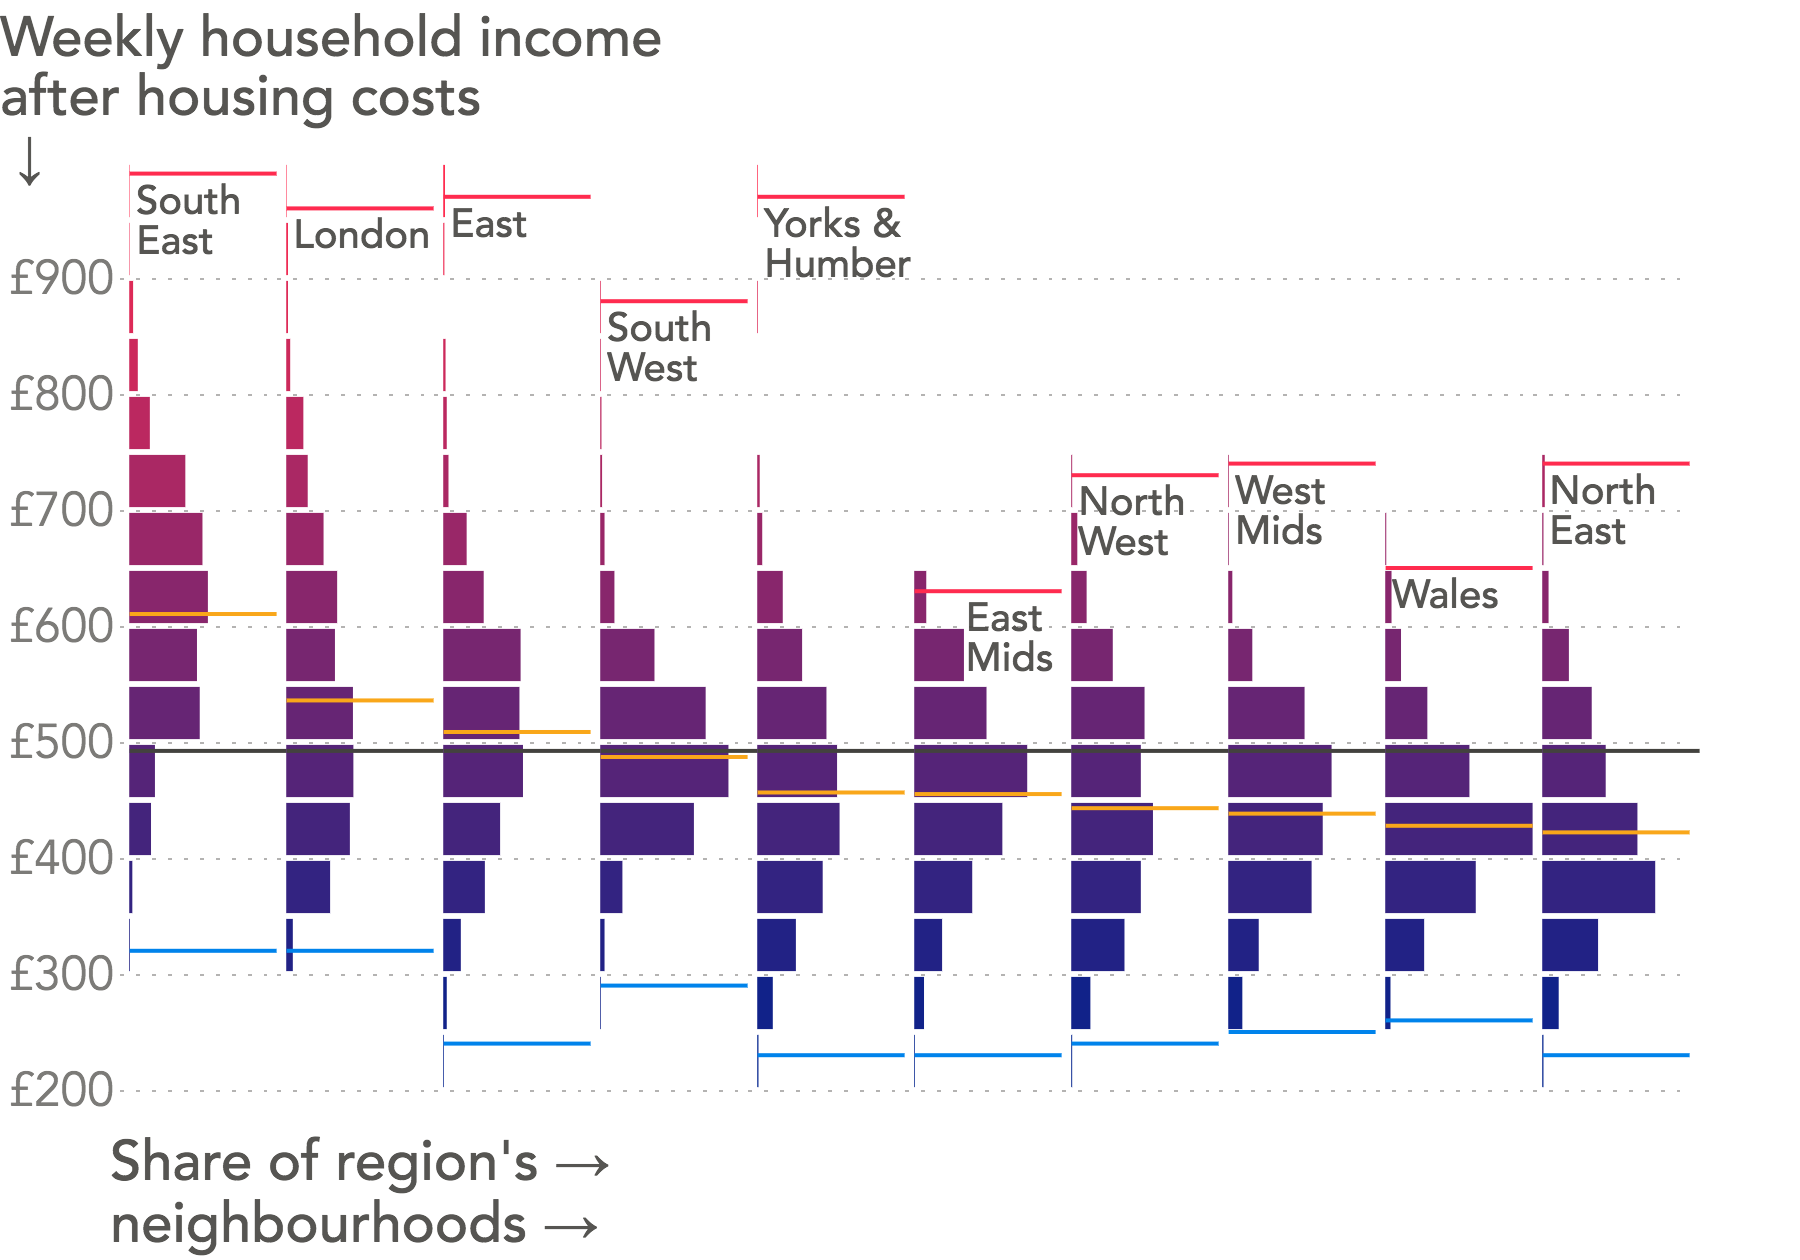
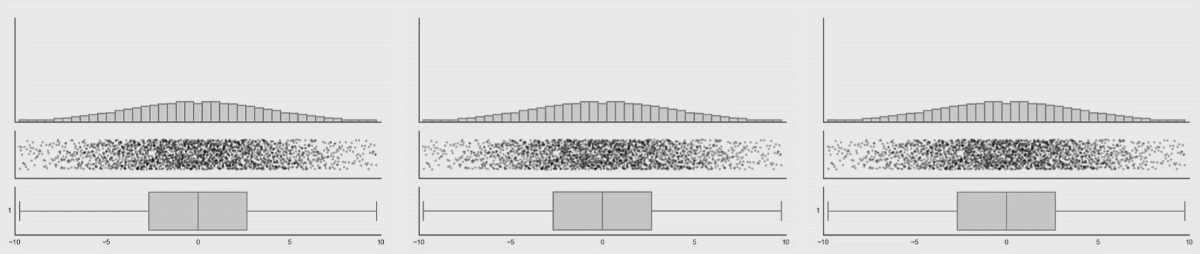
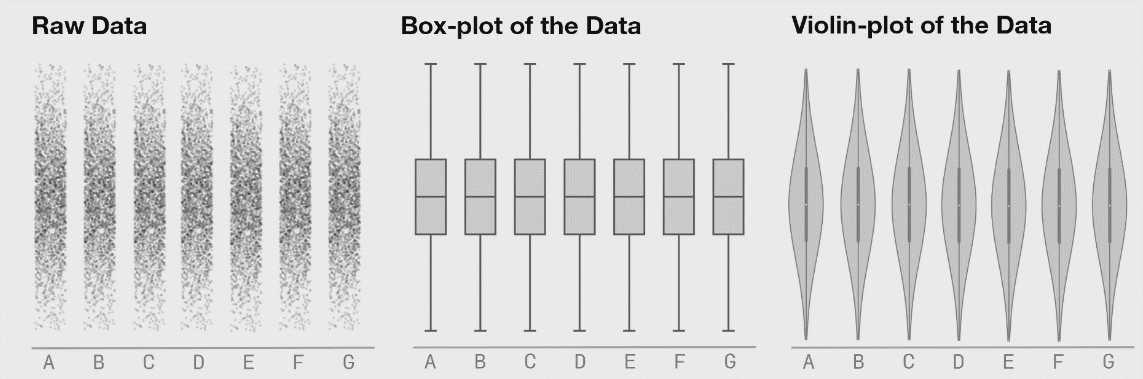
2. Show distributions
Avoid the Zones of Invisibility & Irrelevance

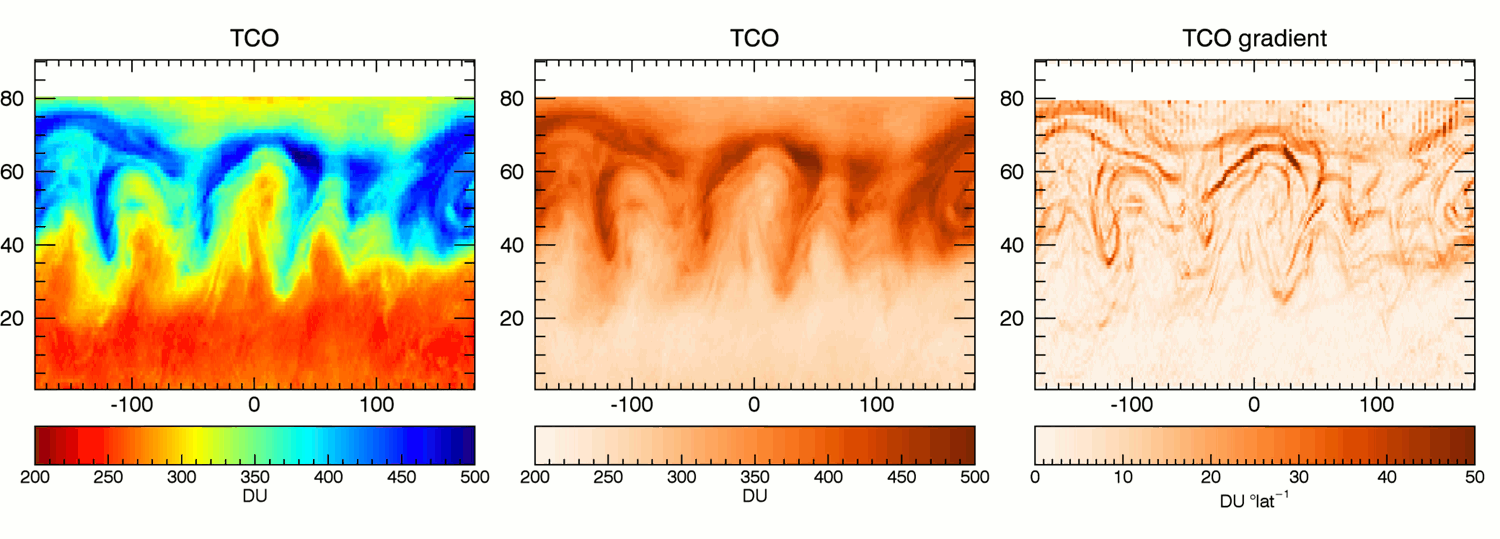
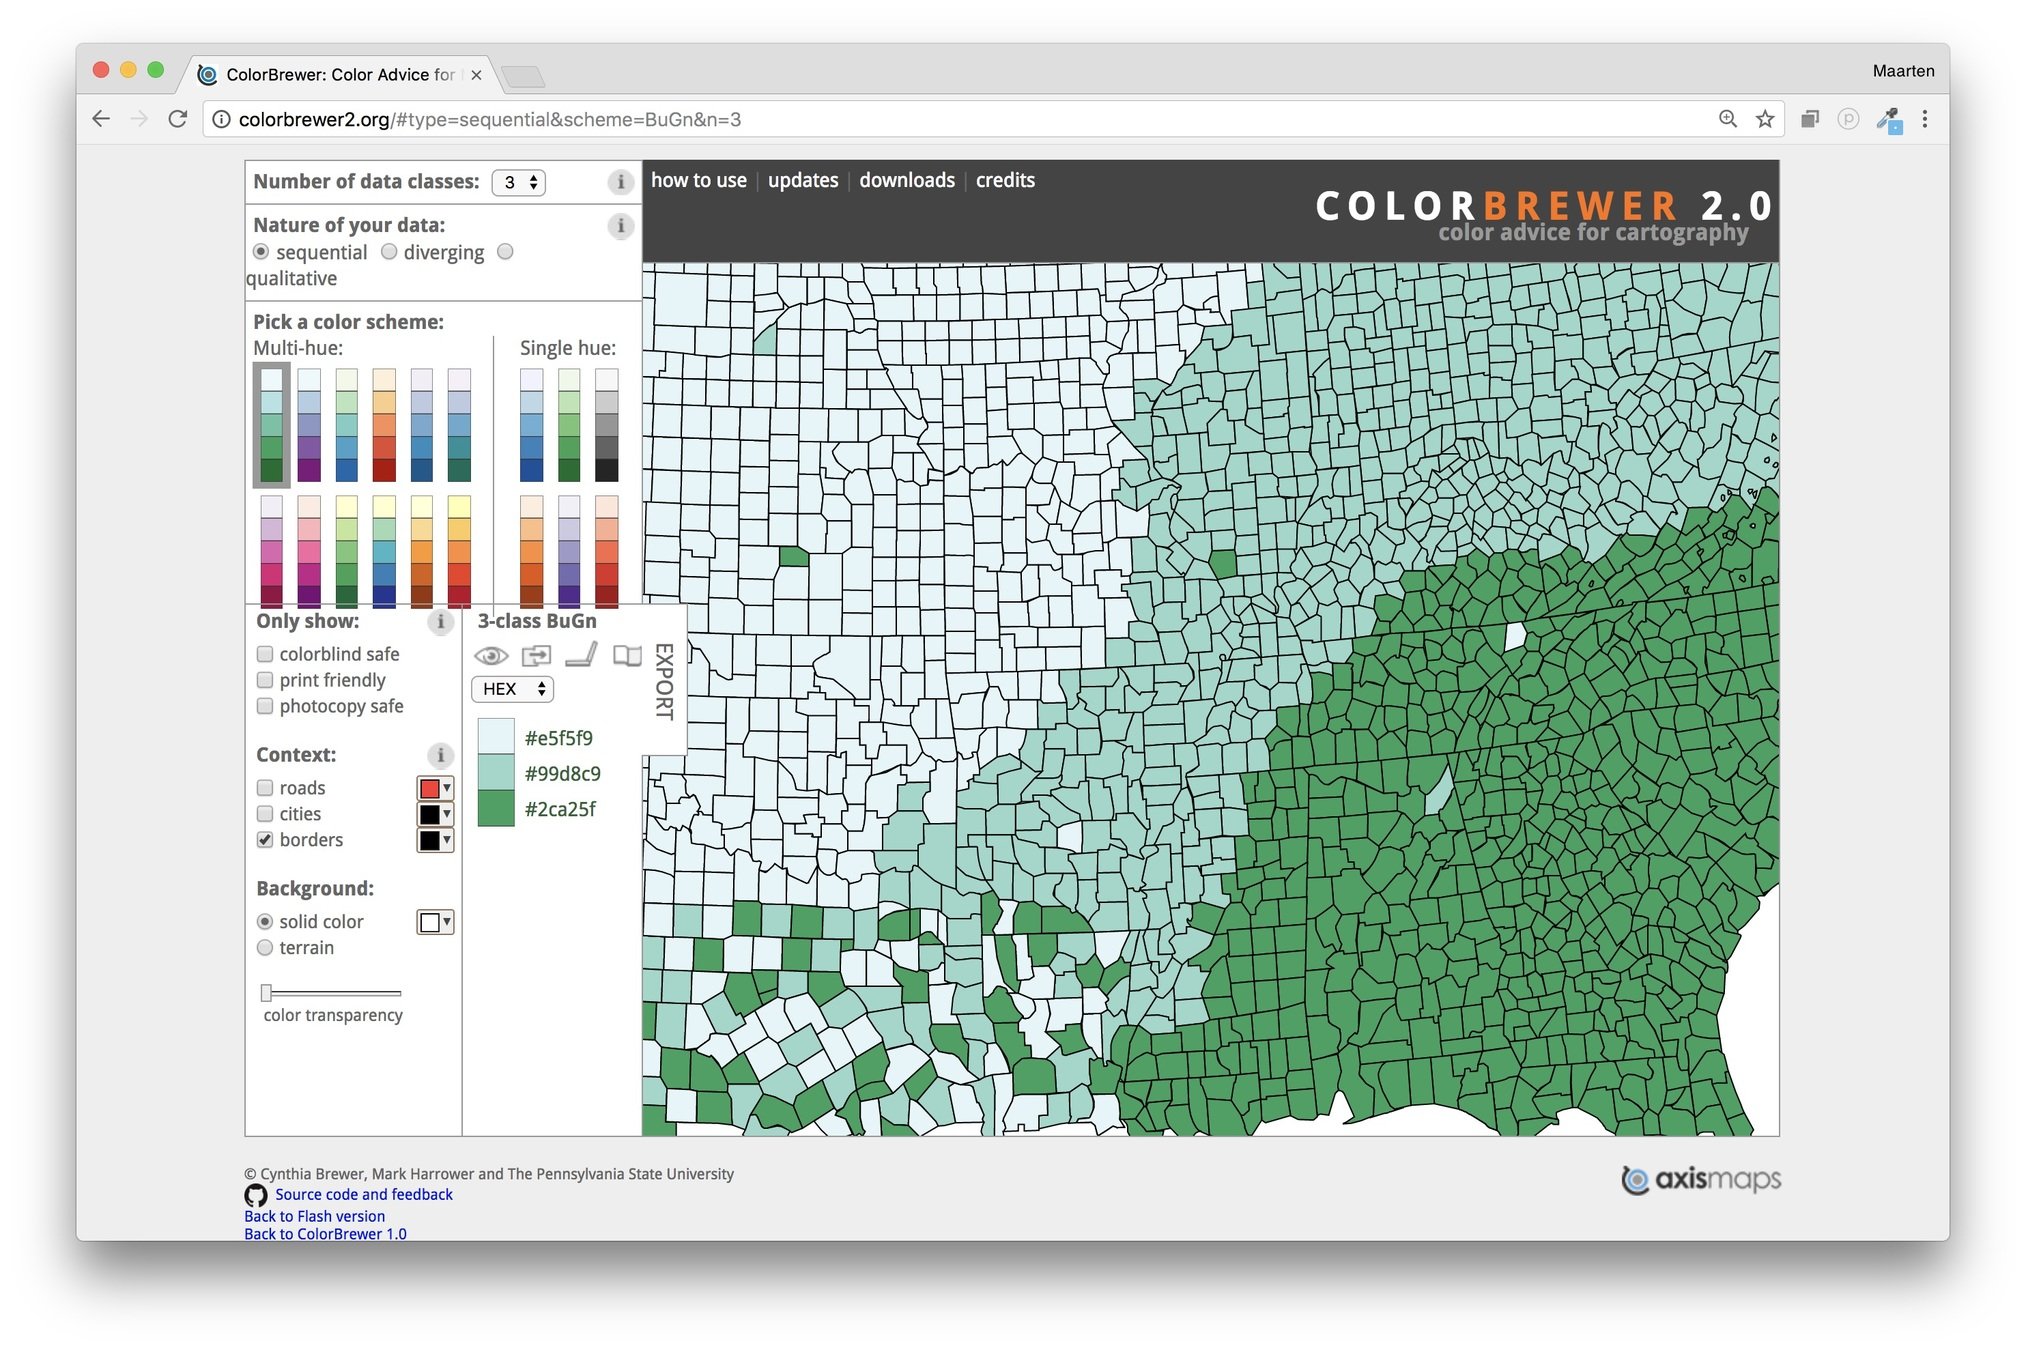
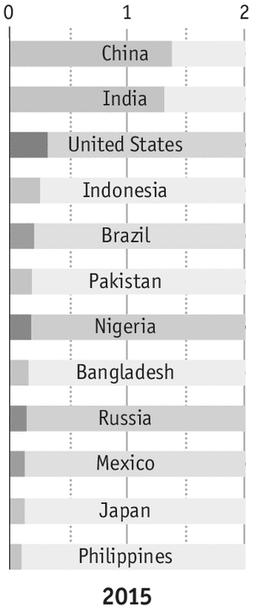
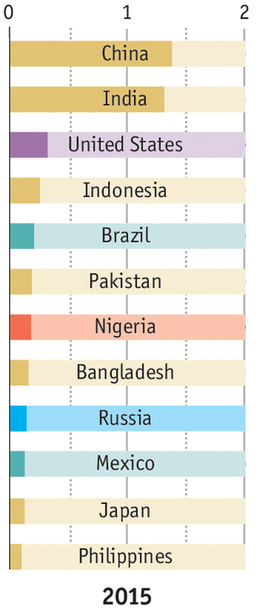
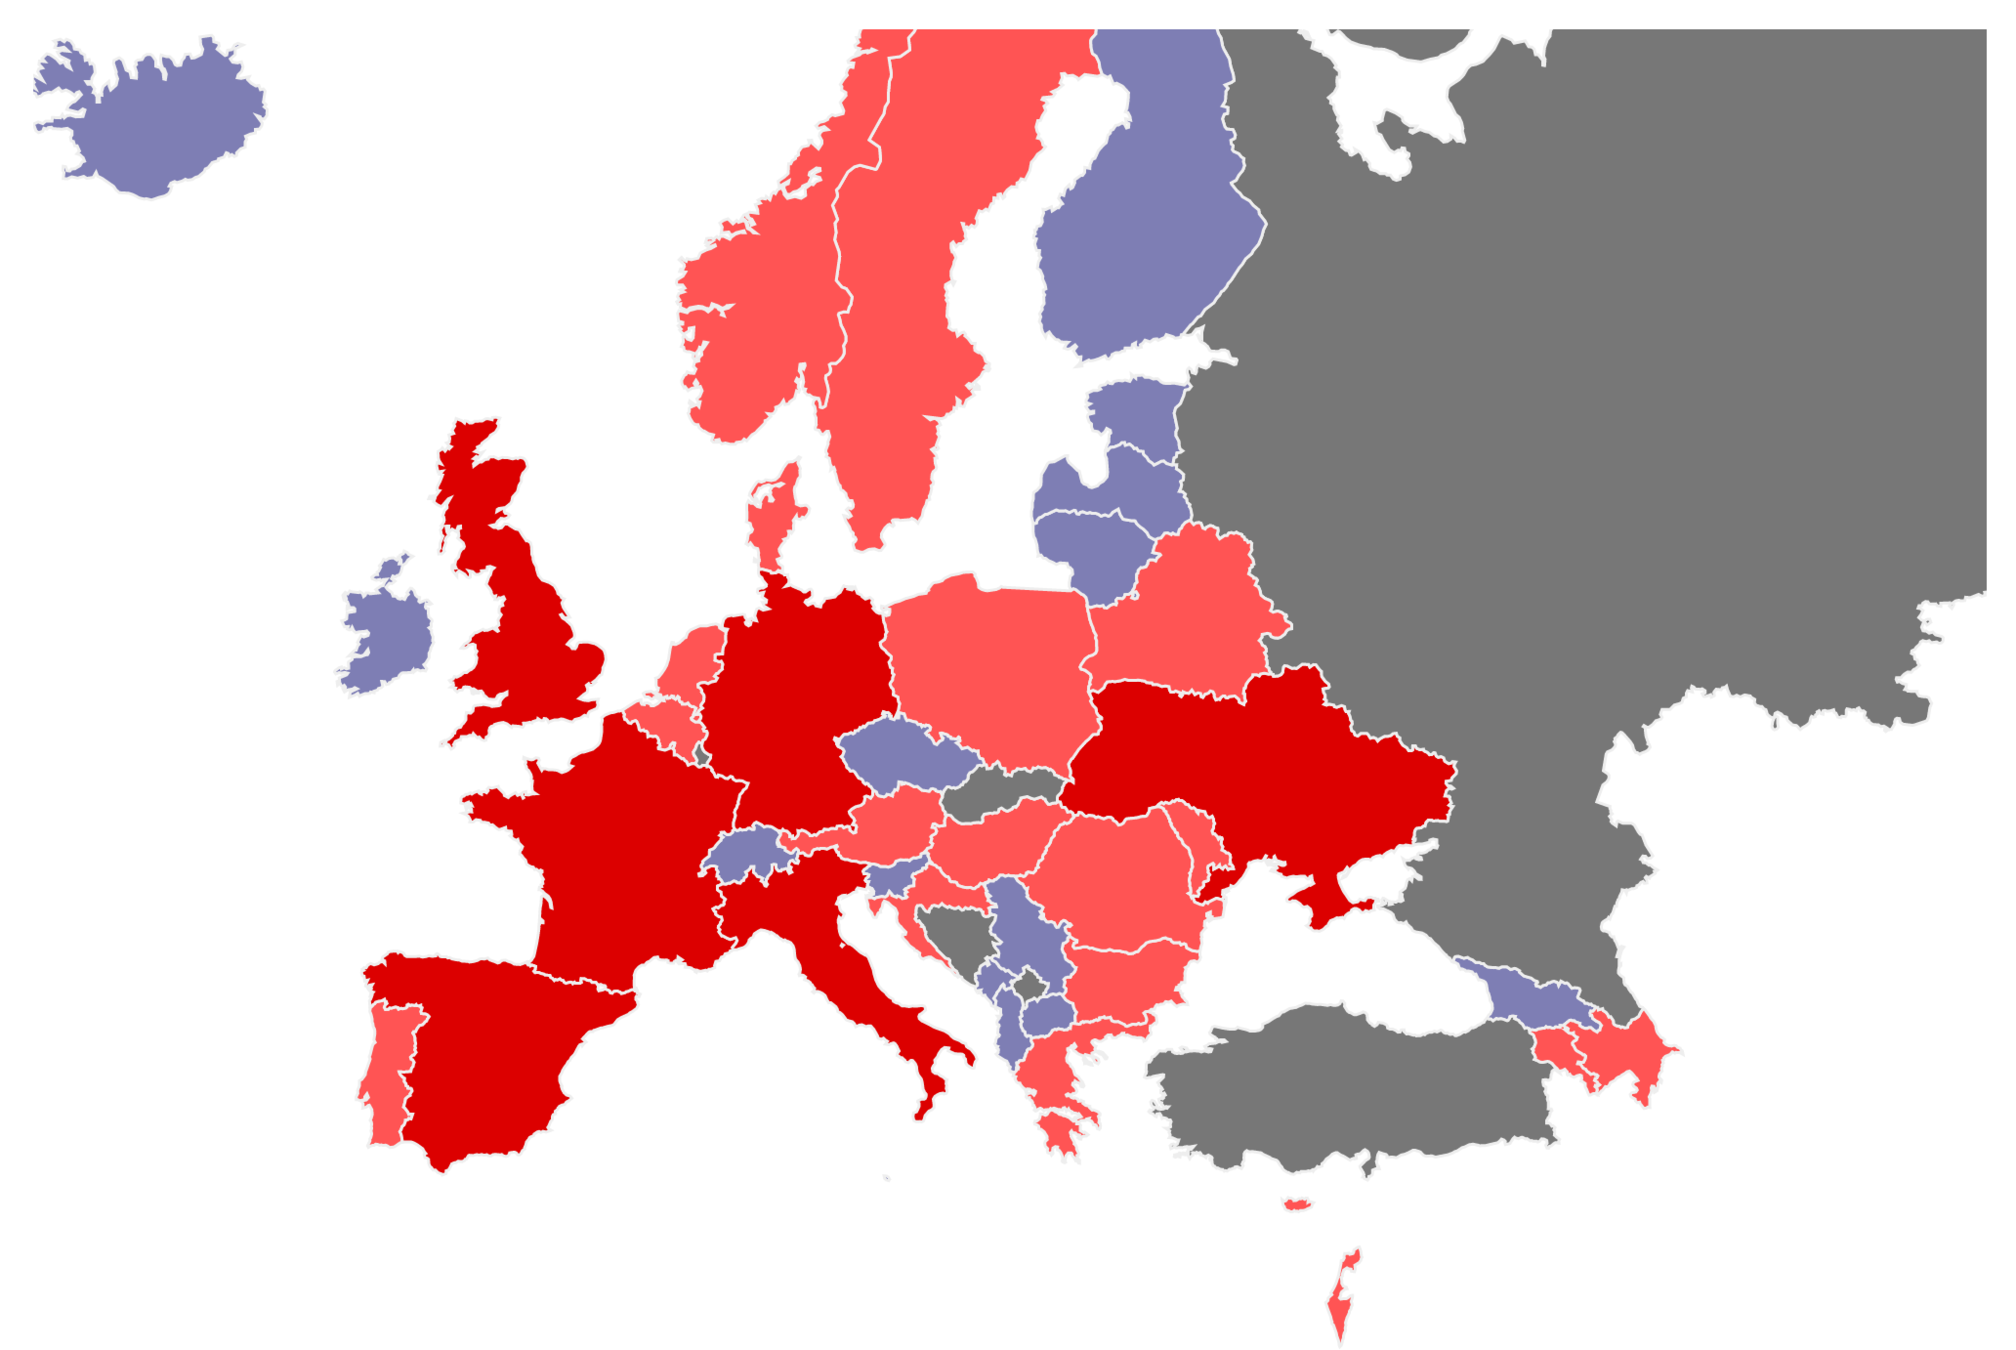
3. #Endrainbow

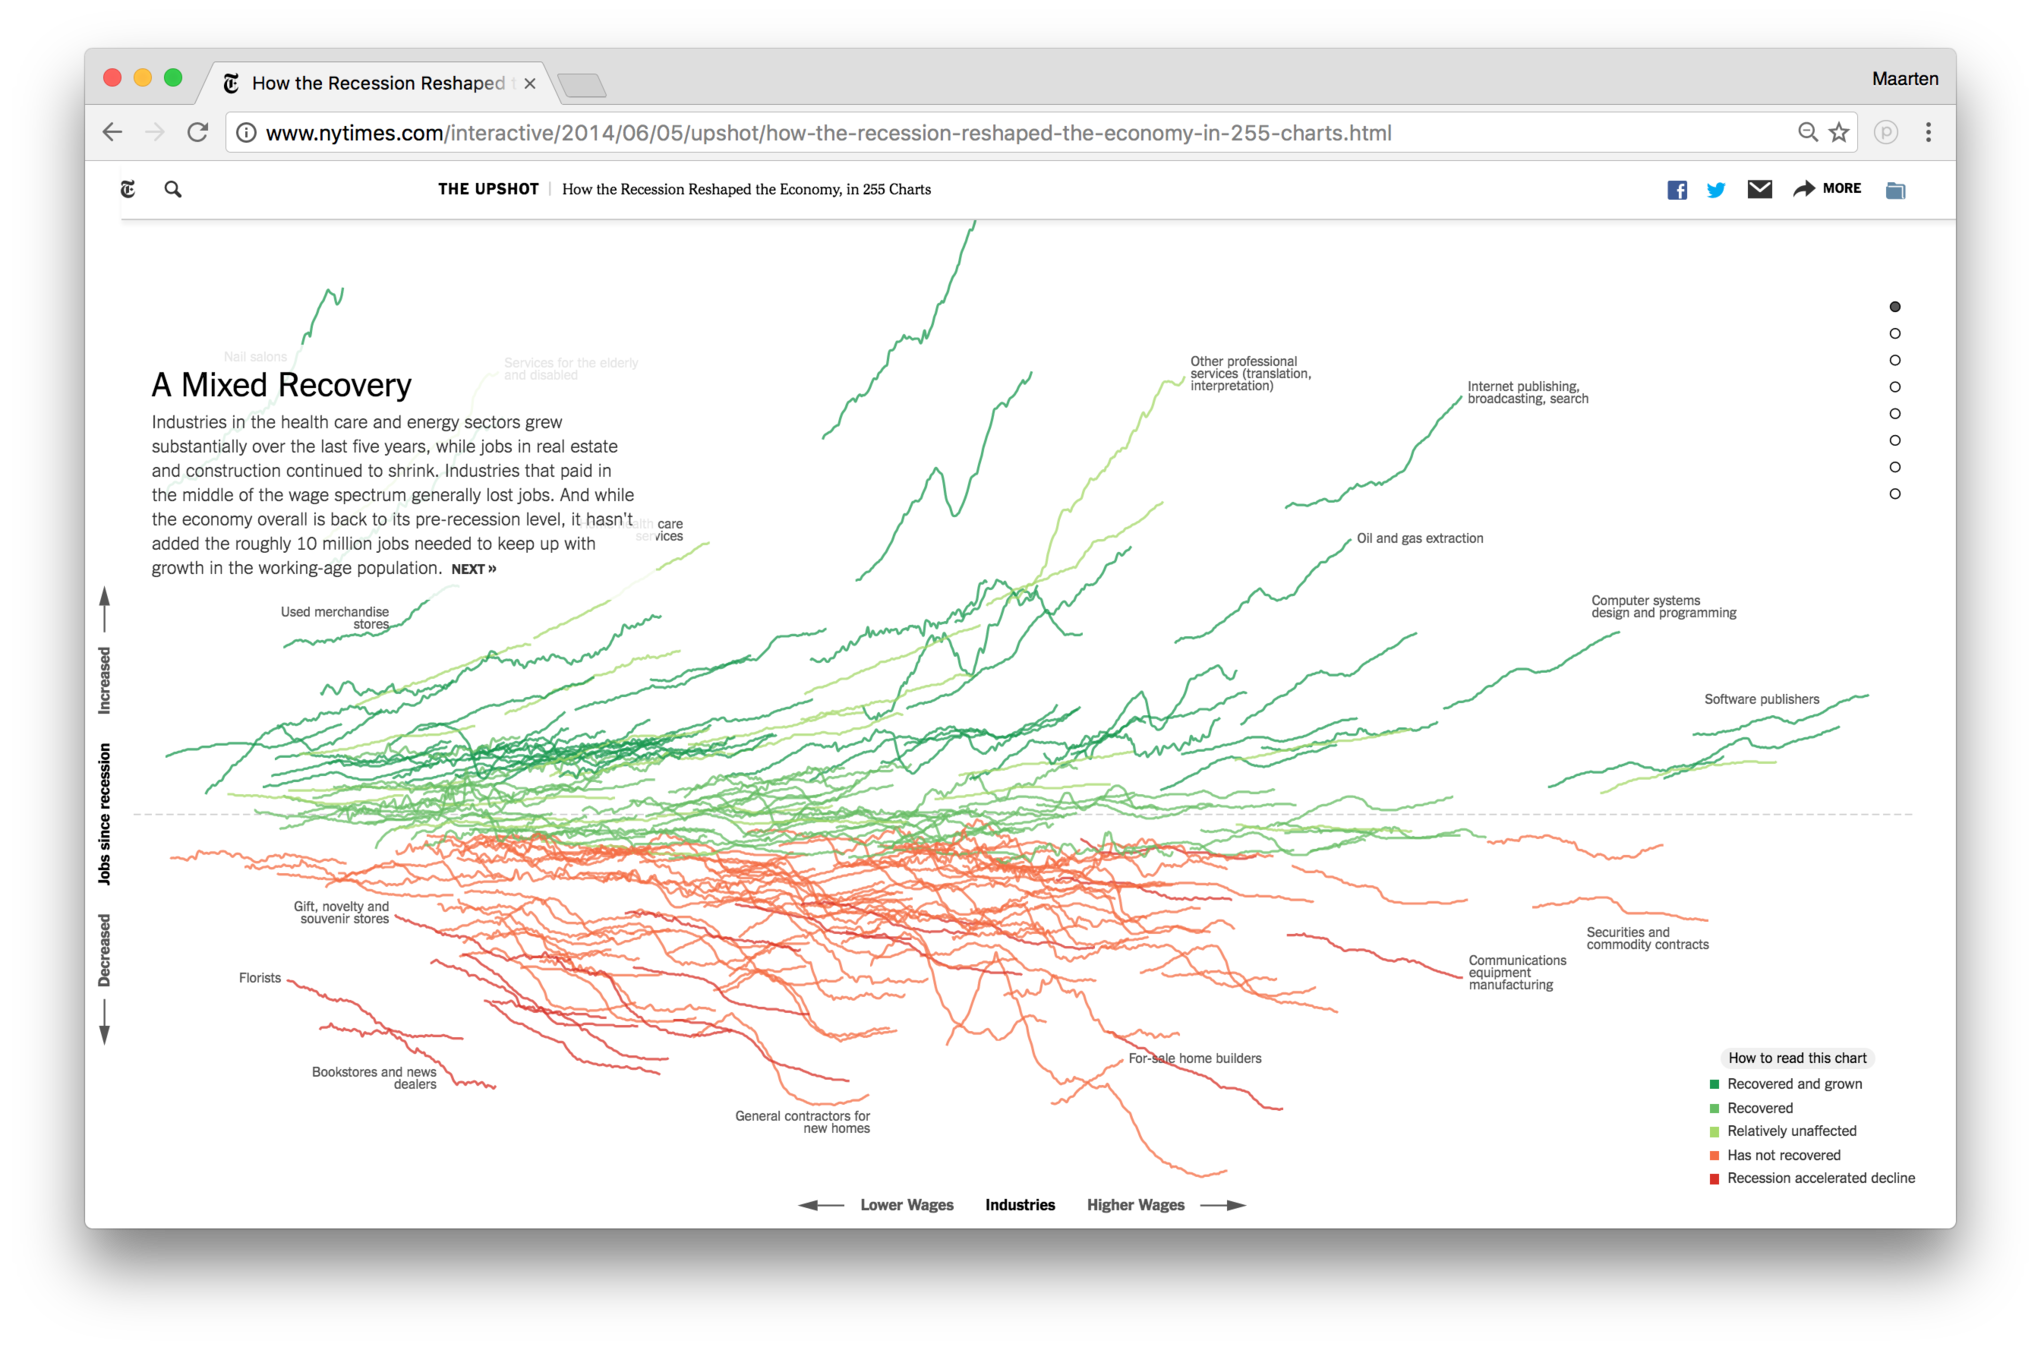

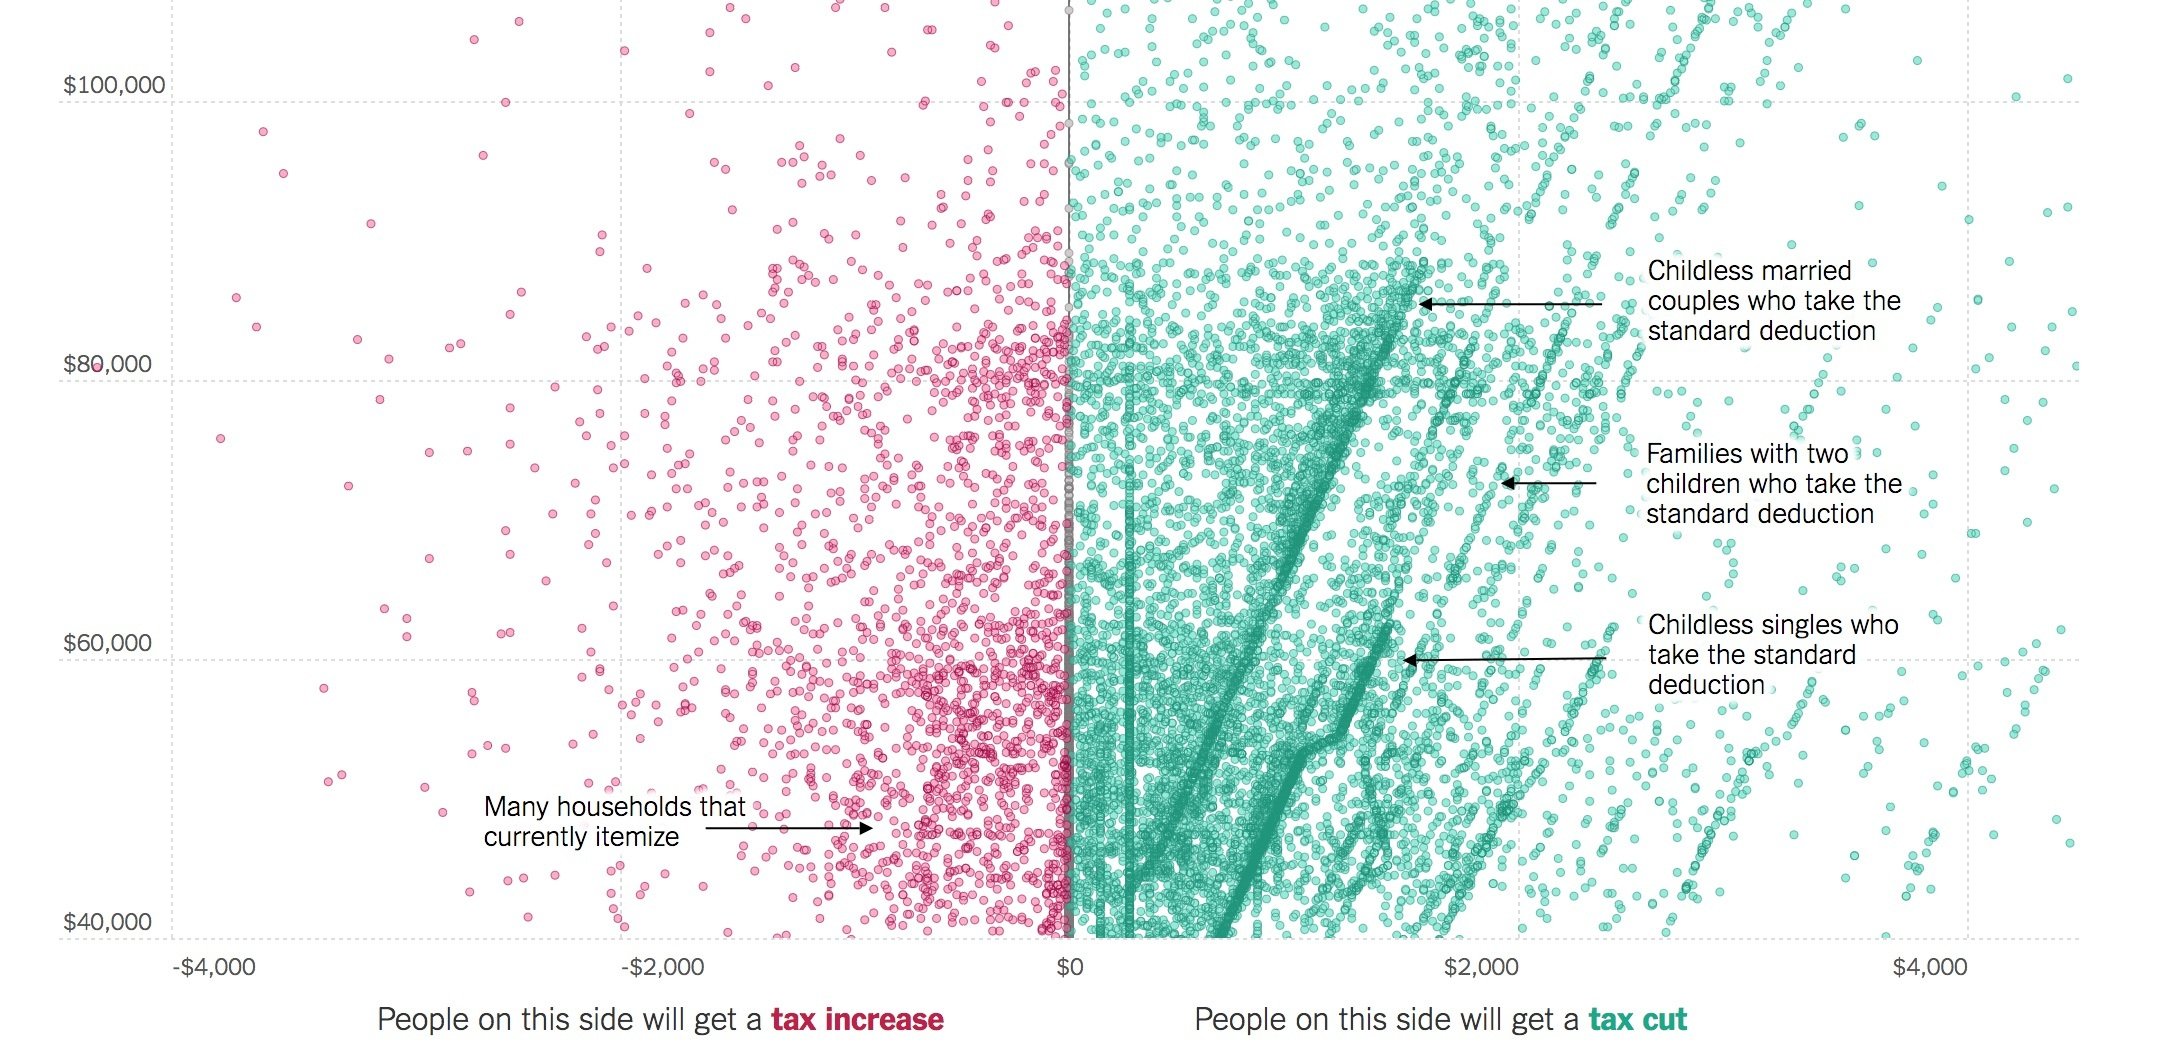
The annotation layer is the most important thing we do. Otherwise it's a case of here it is, you go figure it out.
Amanda Cox
New York Times
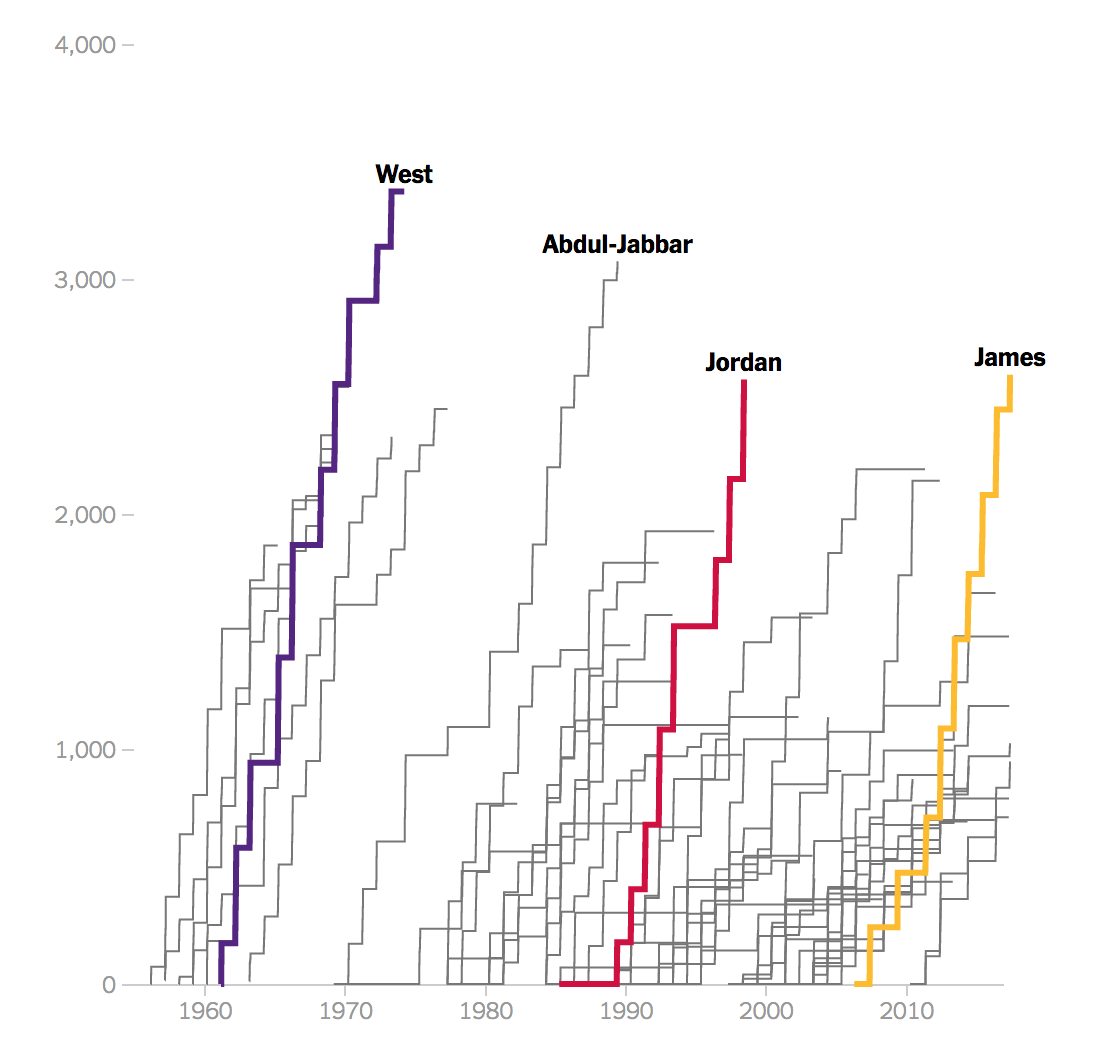
5. Tell the story
with a good title
(a little bit of) color
annotations
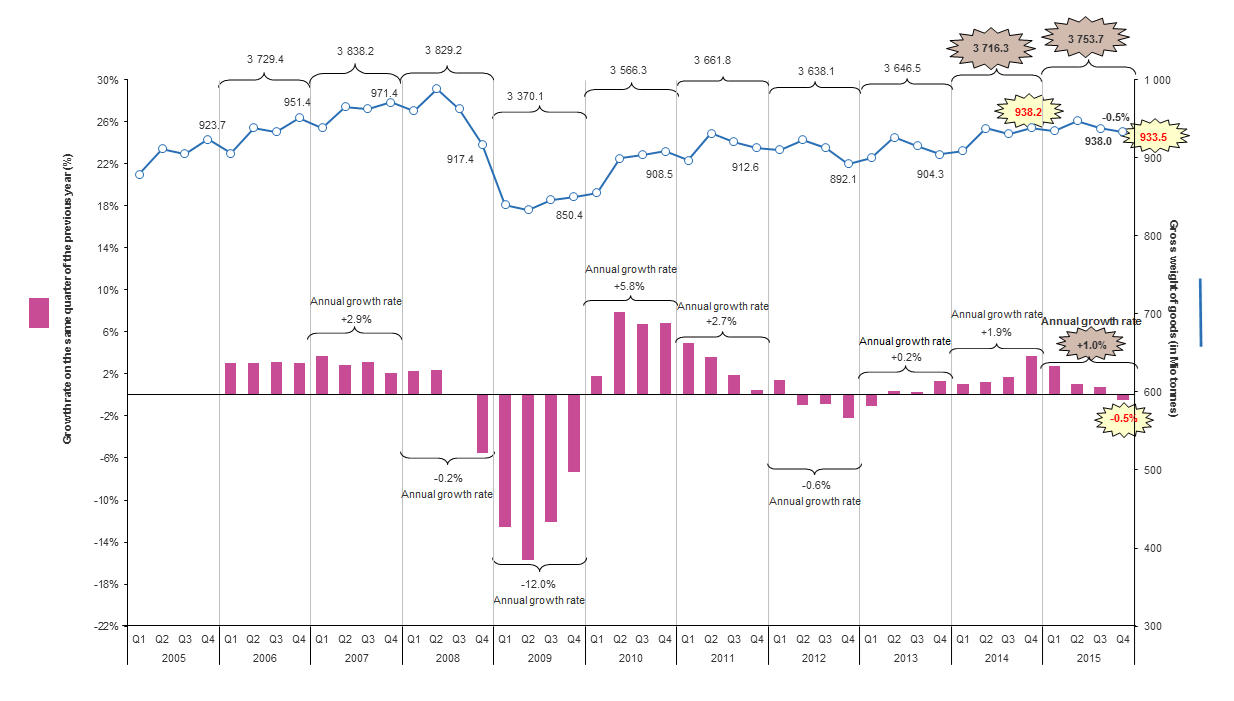
6. One chart, one message
...and no double axes
7. Tailor your charts
to the medium
to the audience


8. Embrace xenographics
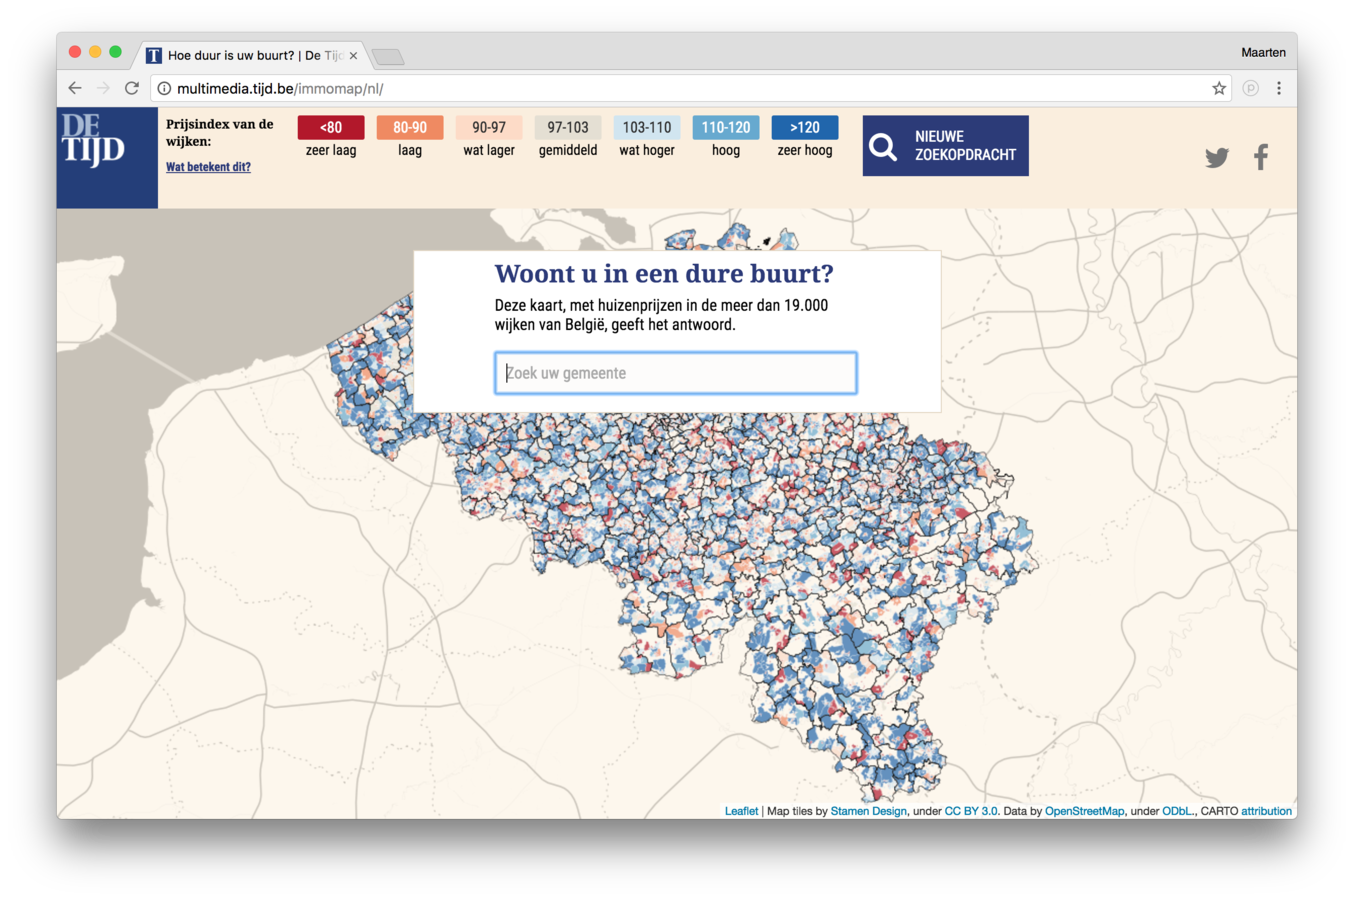
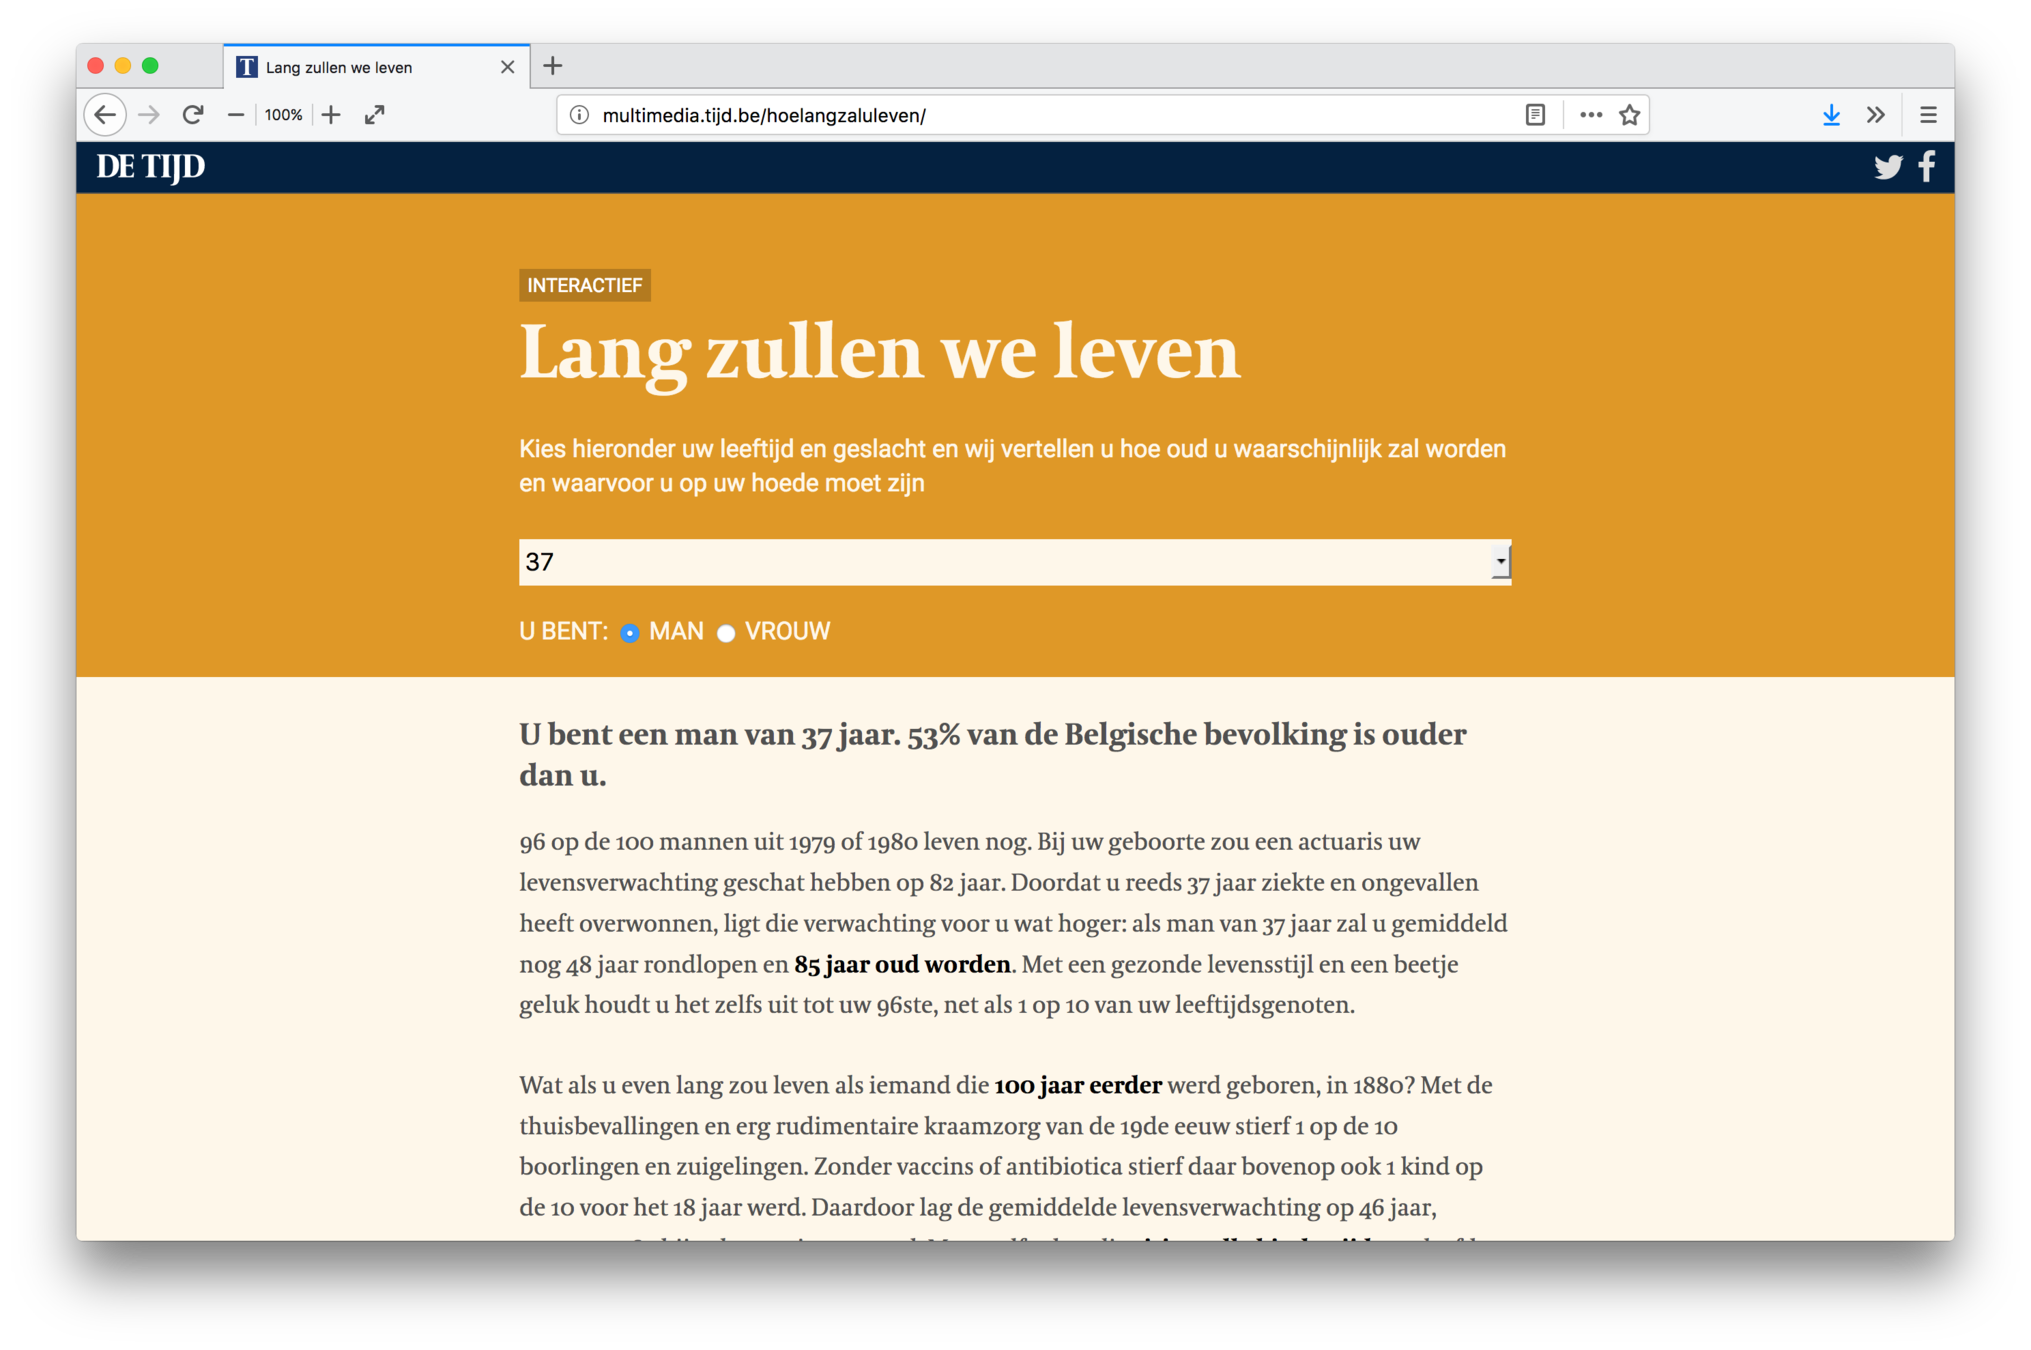
9. Consider interactive visualization
To explain
To put the data in the hands of the user
Exploratory Data Visualisation
II
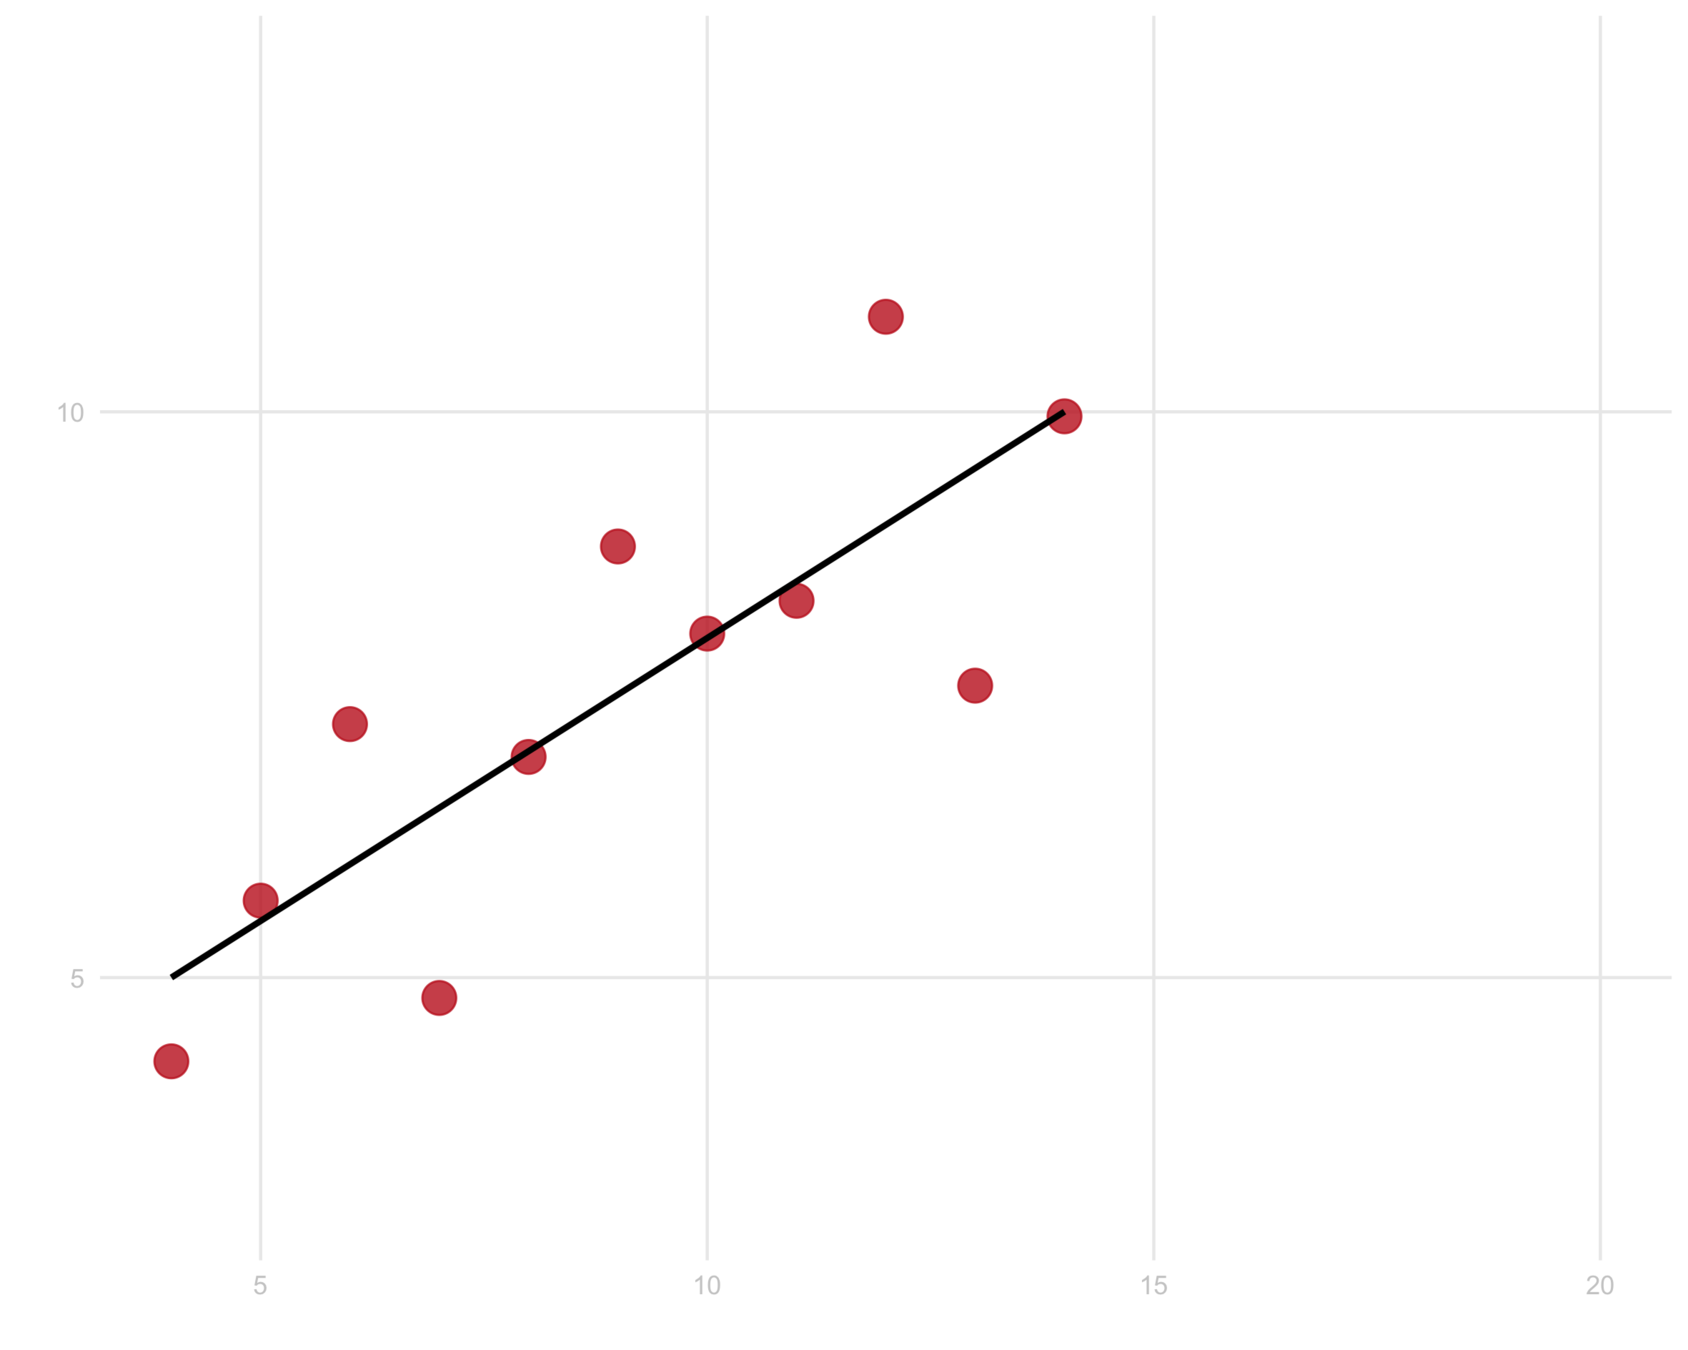
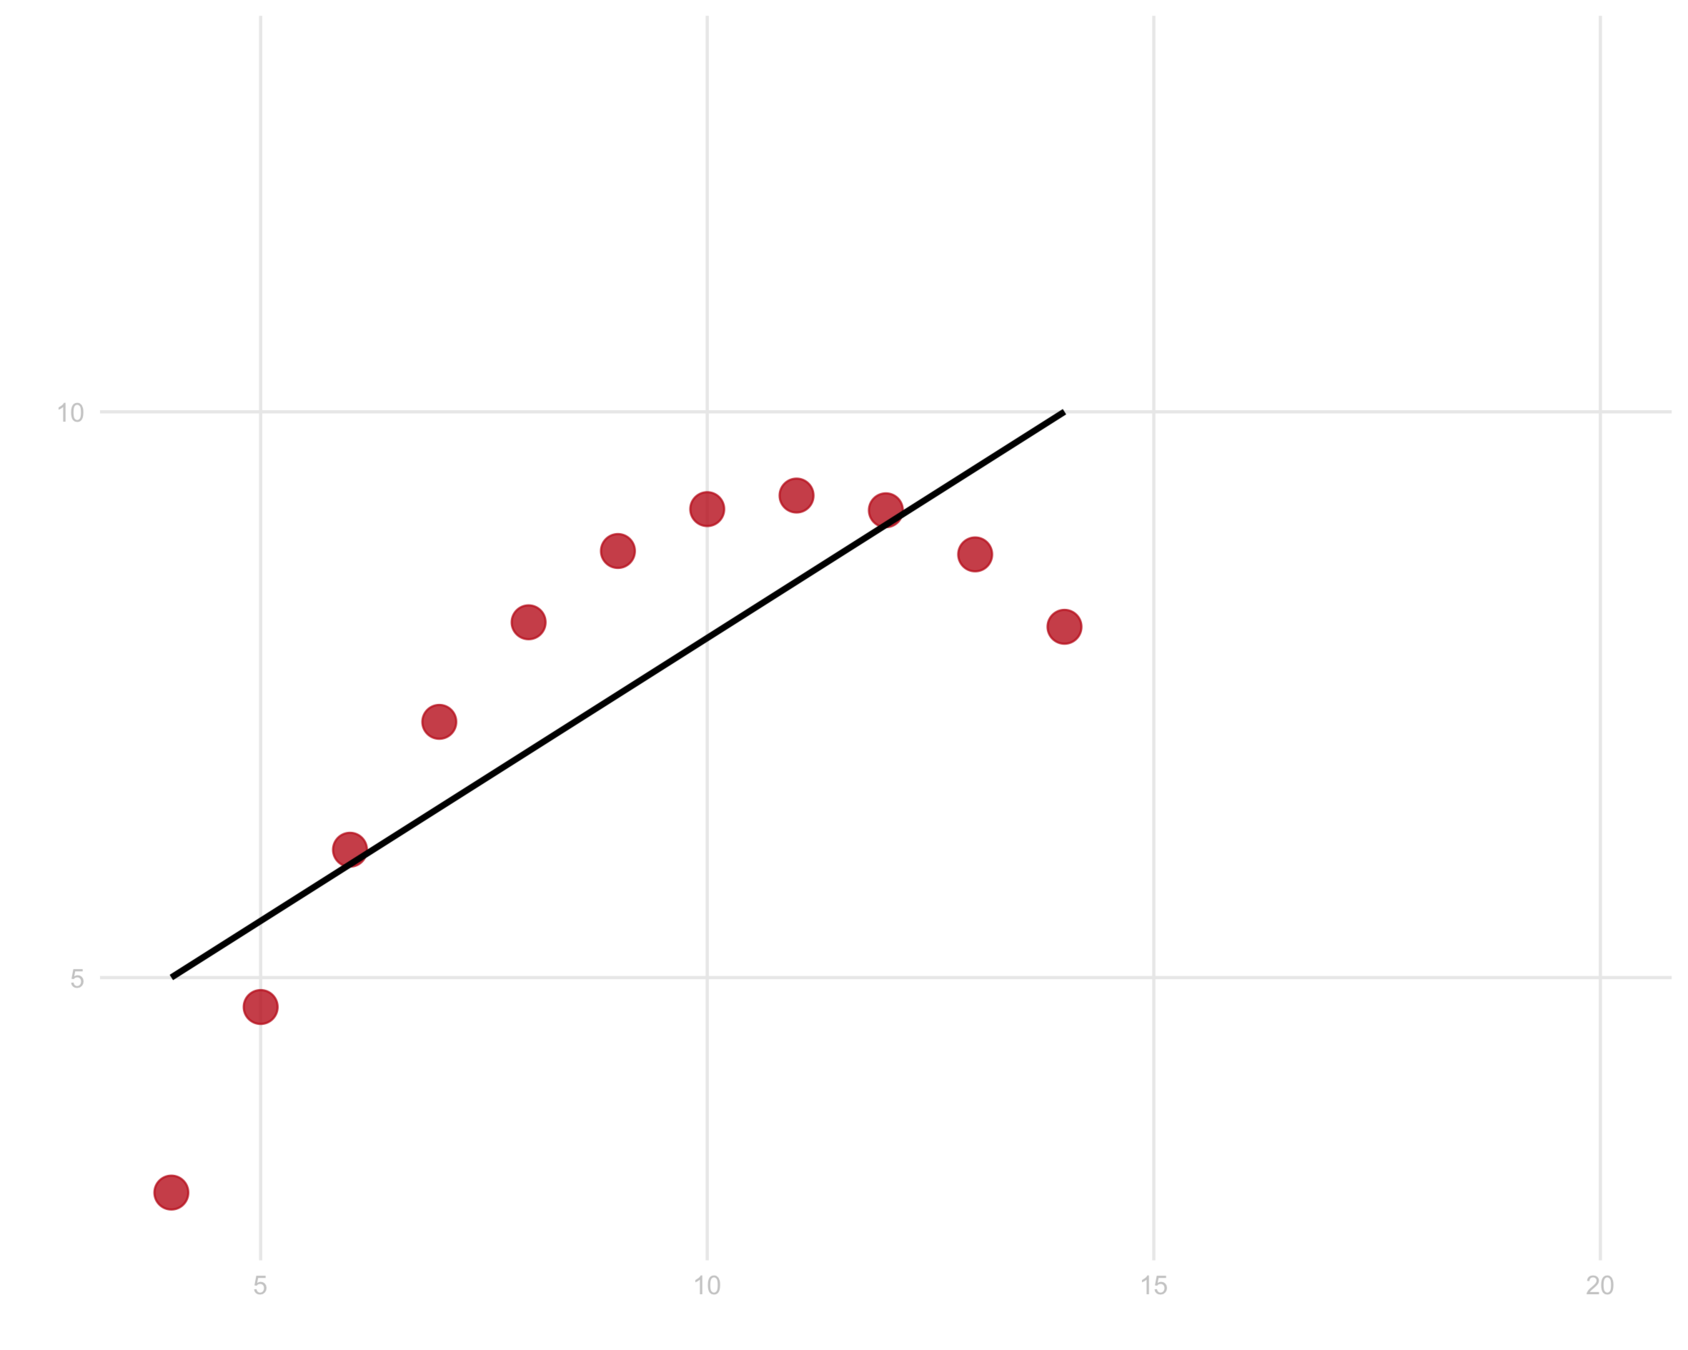
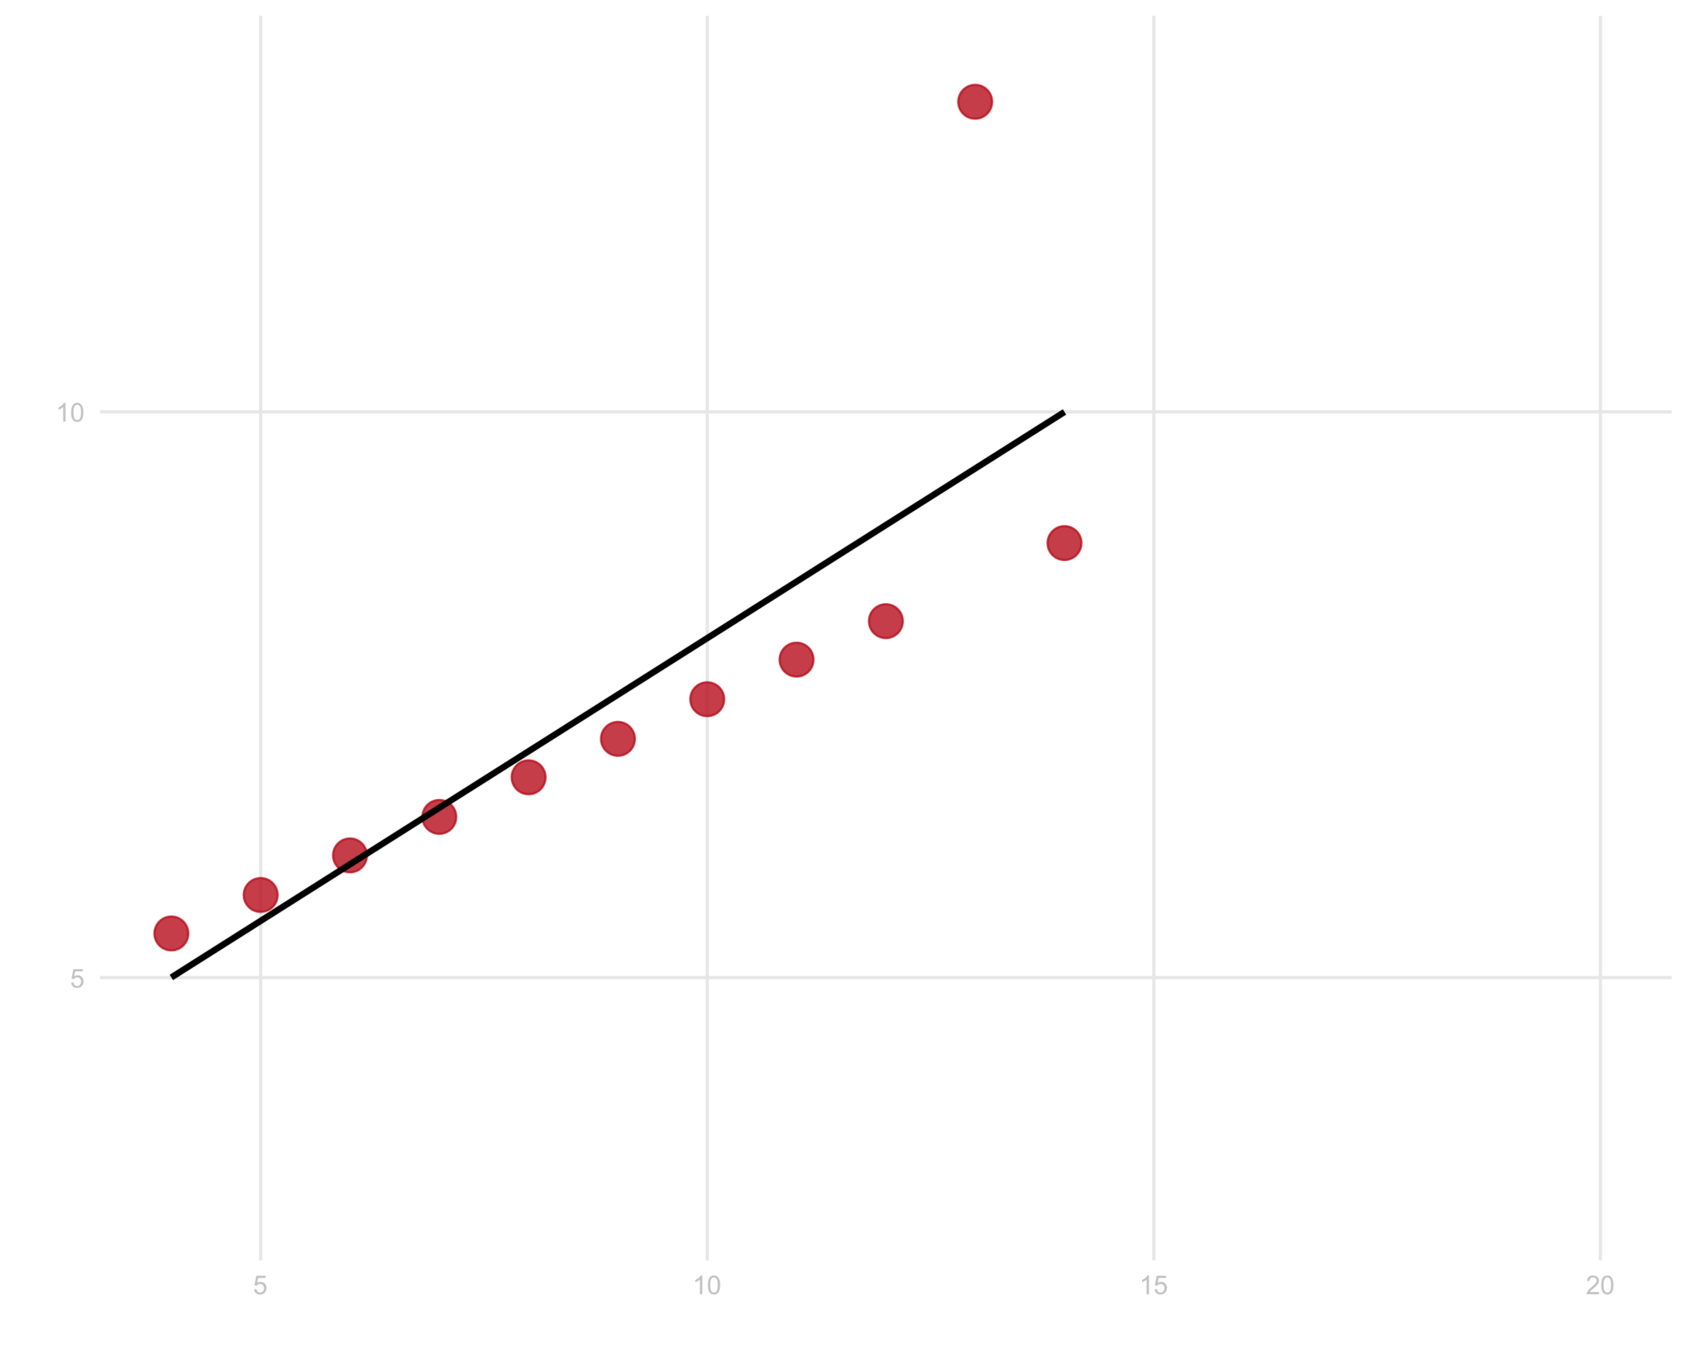
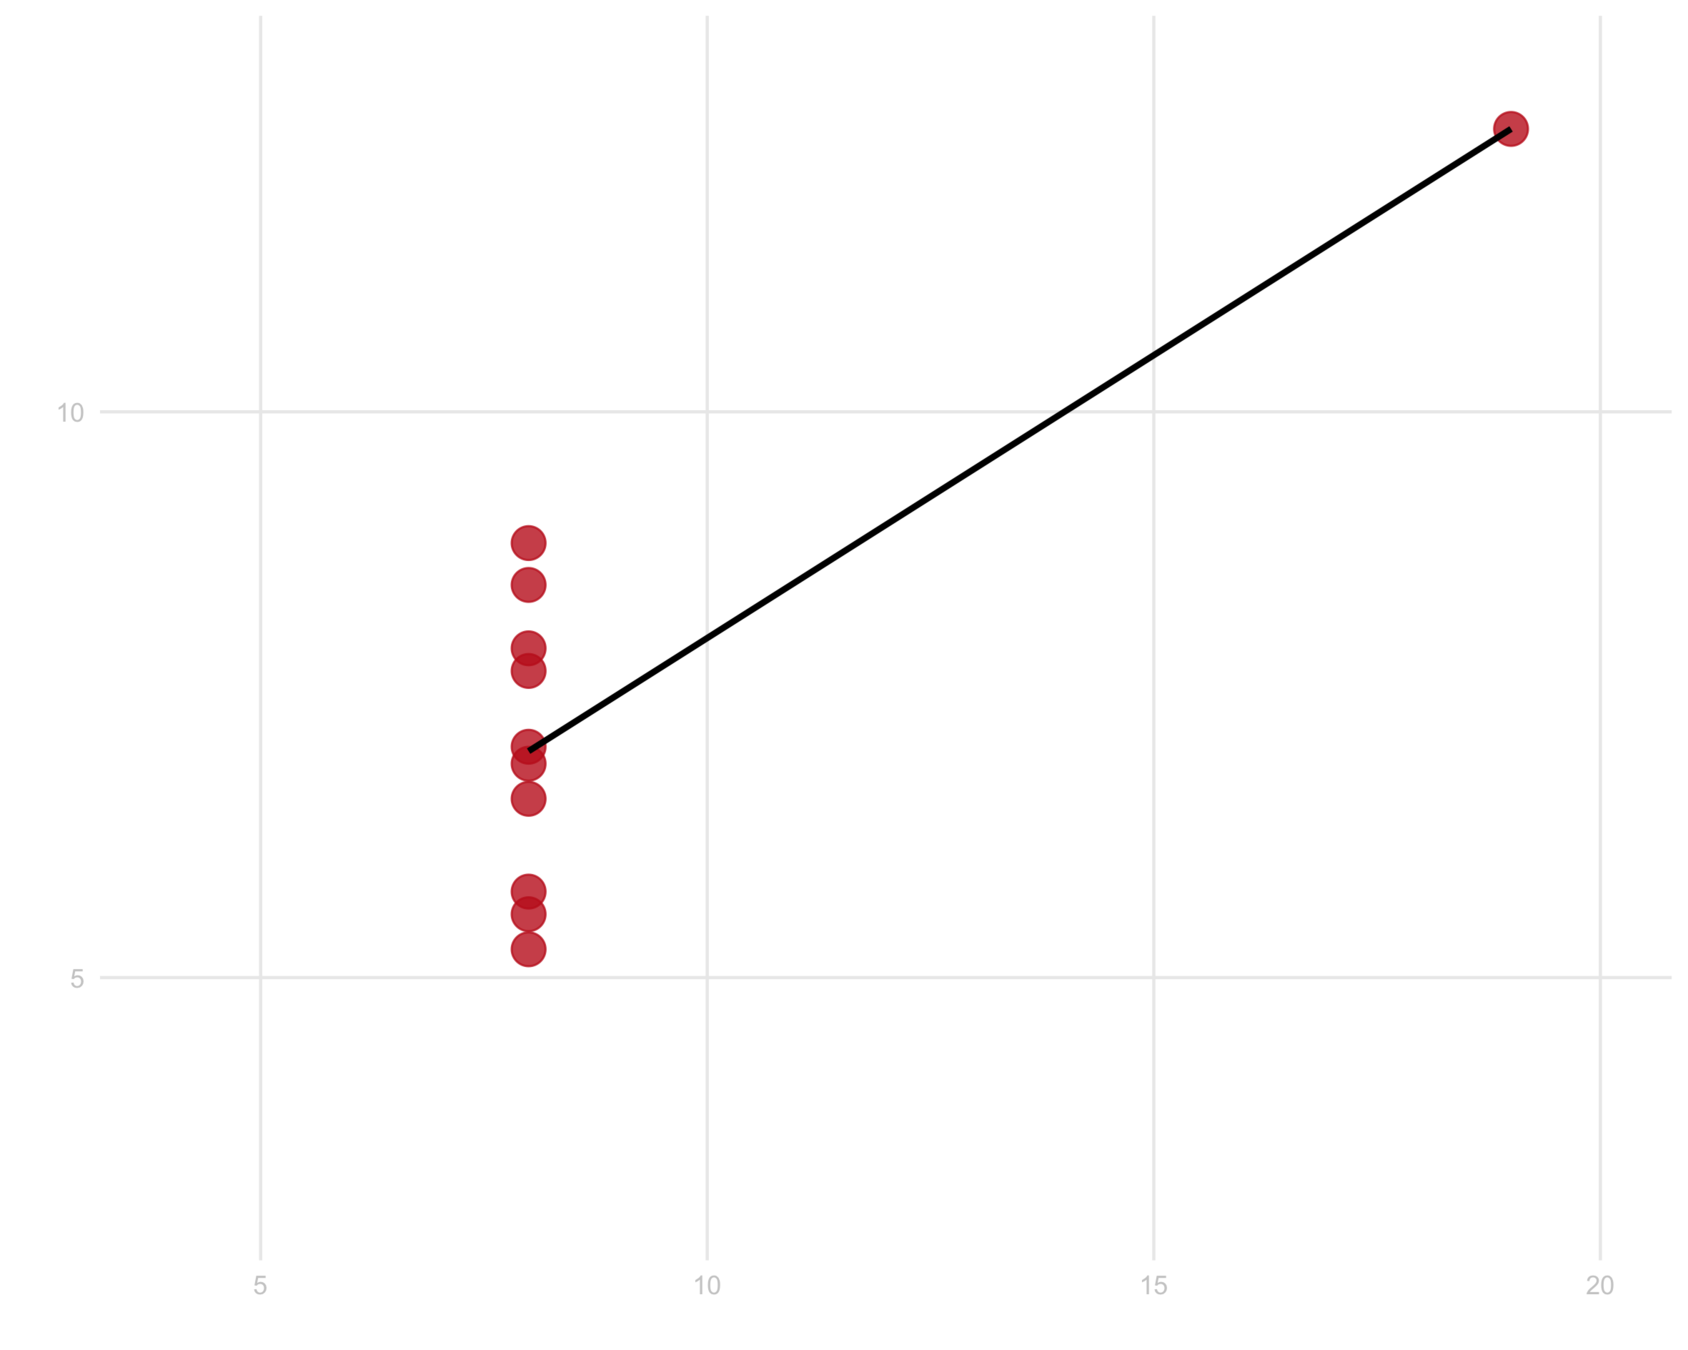
| x1 | y1 | x2 | y2 | x3 | y3 | x4 | y4 |
|---|---|---|---|---|---|---|---|
| 10 | 10 | 10 | 8 | 8.04 | 9.14 | 7.46 | 6.58 |
| 8 | 8 | 8 | 8 | 6.95 | 8.14 | 6.77 | 5.76 |
| 13 | 13 | 13 | 8 | 7.58 | 8.74 | 12.74 | 7.71 |
| 9 | 9 | 9 | 8 | 8.81 | 8.77 | 7.11 | 8.84 |
| 11 | 11 | 11 | 8 | 8.33 | 9.26 | 7.81 | 8.47 |
| 14 | 14 | 14 | 8 | 9.96 | 8.10 | 8.84 | 7.04 |
| 6 | 6 | 6 | 8 | 7.24 | 6.13 | 6.08 | 5.25 |
| 4 | 4 | 4 | 19 | 4.26 | 3.10 | 5.39 | 12.50 |
| 12 | 12 | 12 | 8 | 10.84 | 9.13 | 8.15 | 5.56 |
| 7 | 7 | 7 | 8 | 4.82 | 7.26 | 6.42 | 7.91 |
| 5 | 5 | 5 | 8 | 5.68 | 4.74 | 5.73 | 6.89 |

Exploring Belgian census data in Tableau Public
Where to move to meet rich singles?
Github repo: git.io/vb0u0
Html doc: git.io/vb0uP
Thank you!
www.maartenlambrechts.com
@maartenzam
Data visualization in science and sociology
By maartenzam


