Xenographics
Going beyond bars and lines
@maartenzam
September 8, 2016
Helsinki
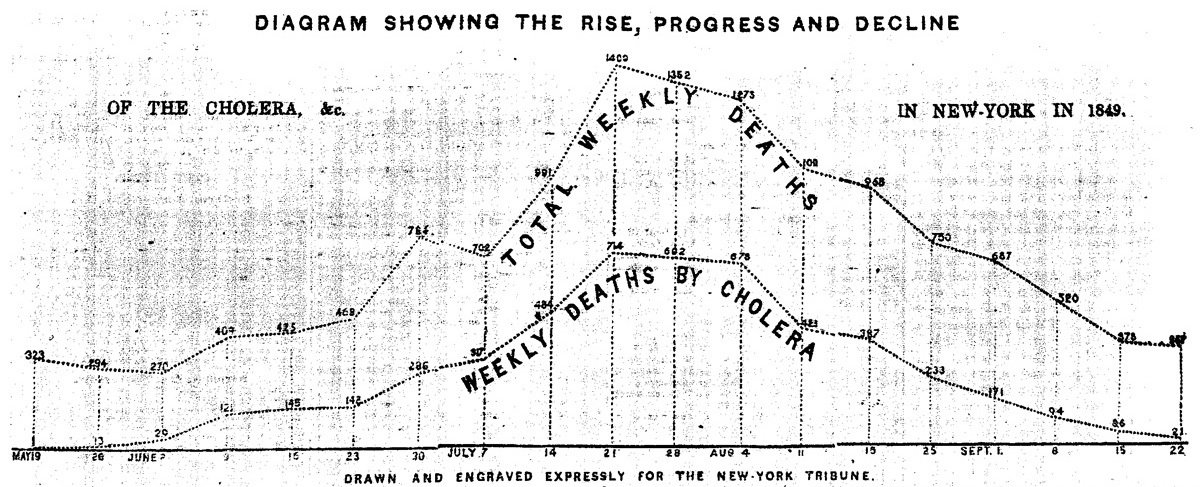
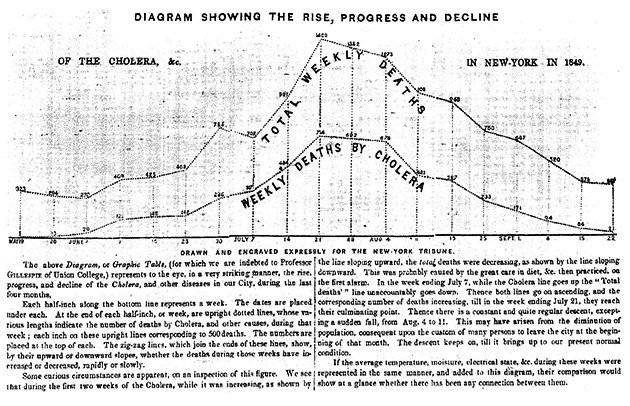
"As knowledge increases amongst mankind, and transactions multiply, it becomes more and more desirable to abbreviate and facilitate the modes of conveying information from one person to another, and from one individual to the many."
"Everything that can be expressed in numbers can be represented by lines."
William Playfair, 1786
John Playfair


Why visualize?


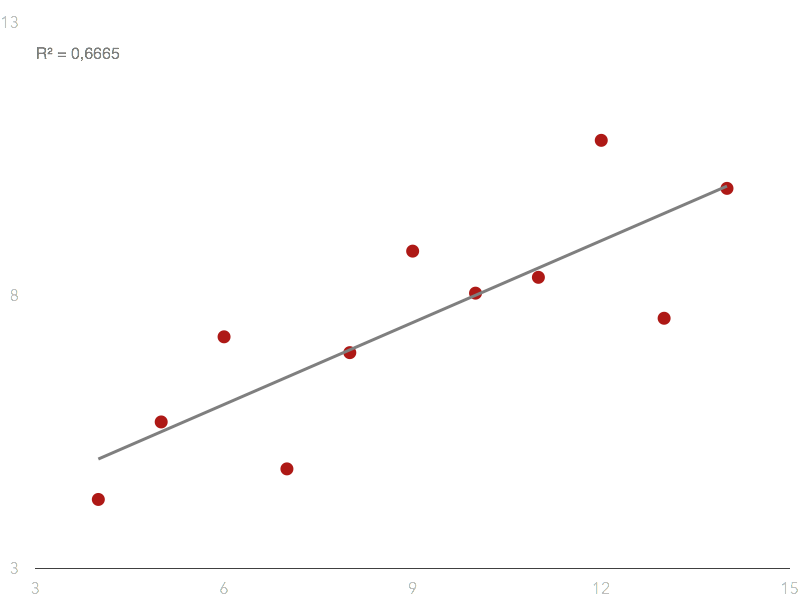


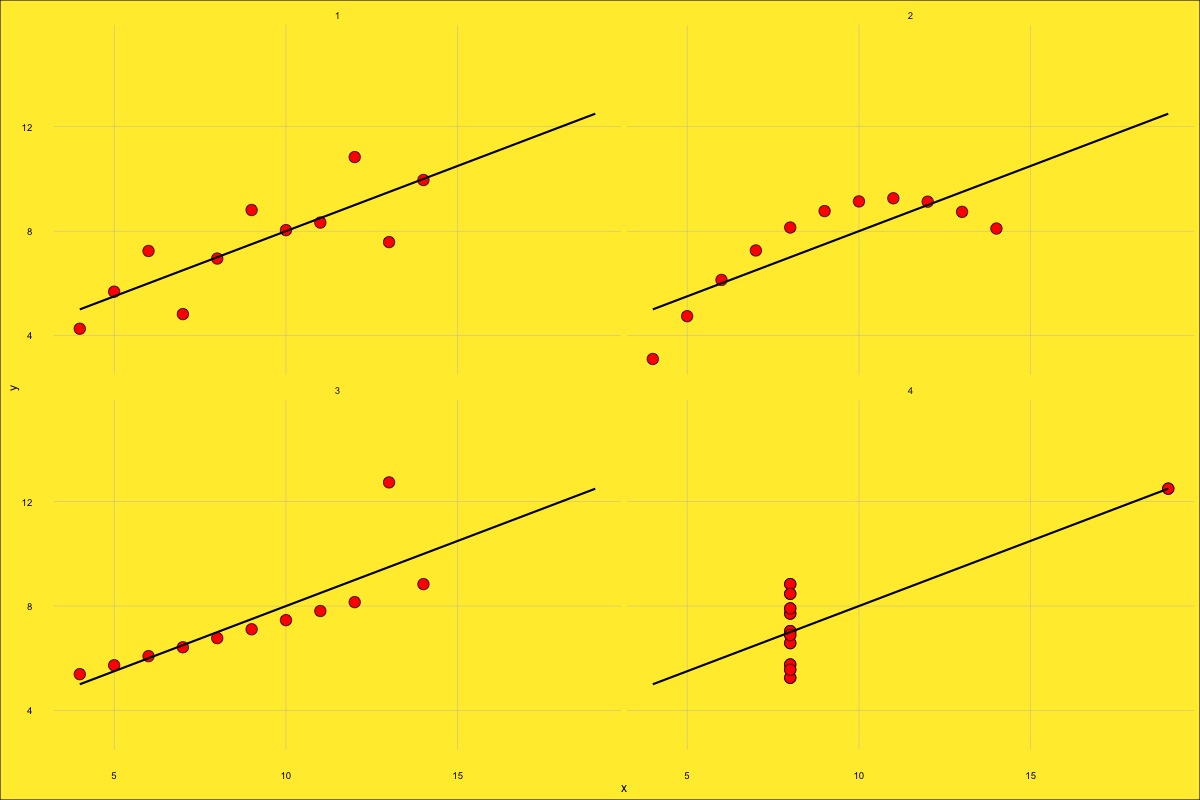

The secret?
Preattentive processing
868888609462834719714449648

122286651978794222484779908

939340243123007392183390116

351684124962334339709749742
868888609462834719714449648

122286651978794222484779908

939340243123007392183390116

351684124962334339709749742


75,37
(7,12)
Color
Size
Shape
Position
Rotation
Enclosure
Data
Time
Categories
Continuous
Text
Dimensions
Hierarchy
Network
Geographic
Uncertain
small
BIG
Efficiency

Chart choosers
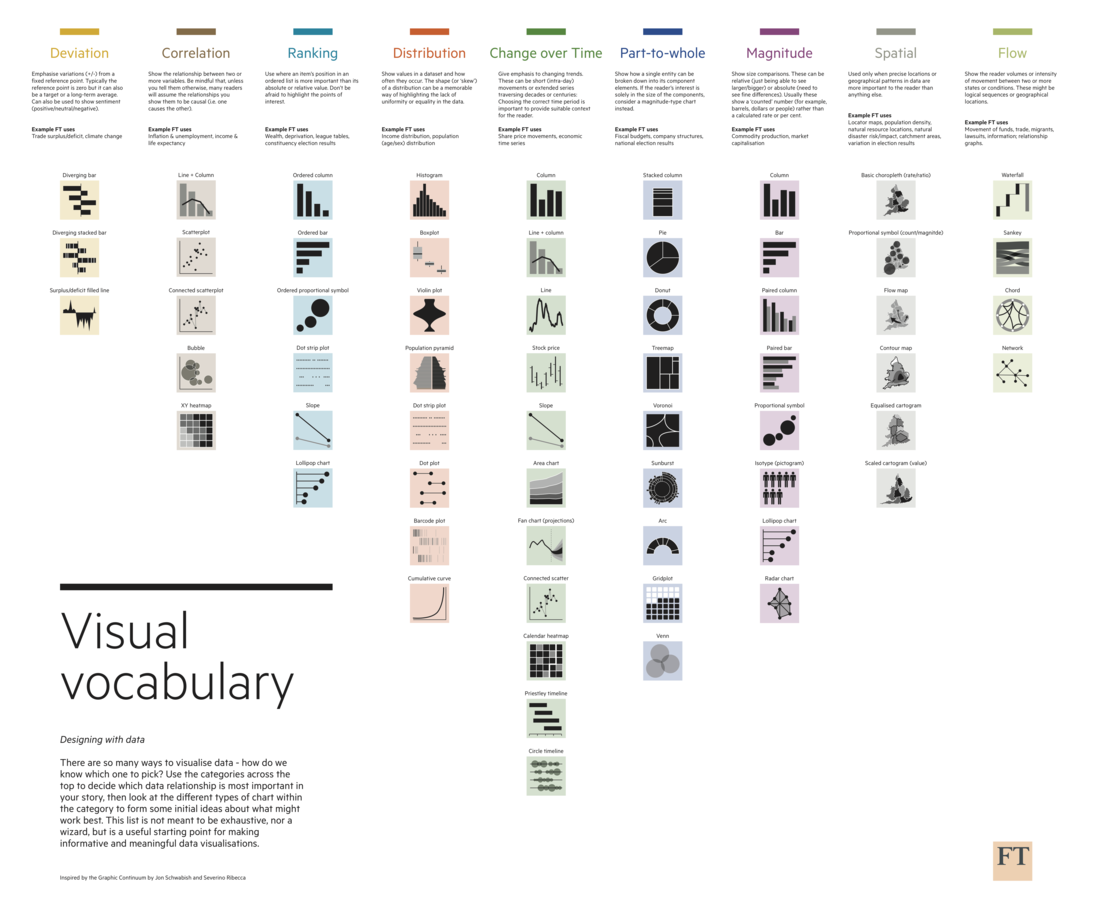
Chart type
=
data
+
message
+
audience
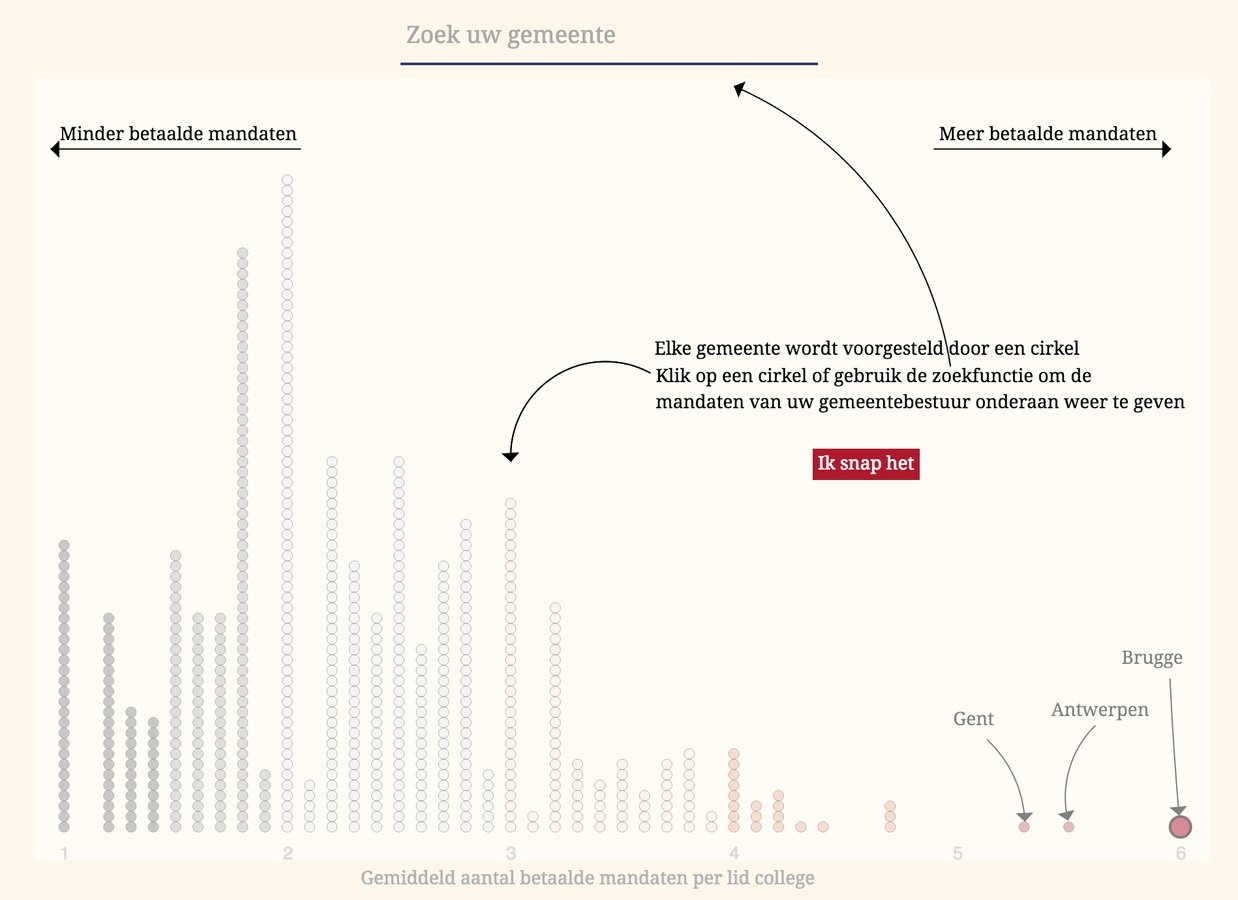
Dots
Tools
More
Connected dots
Tools
Trees
Tools
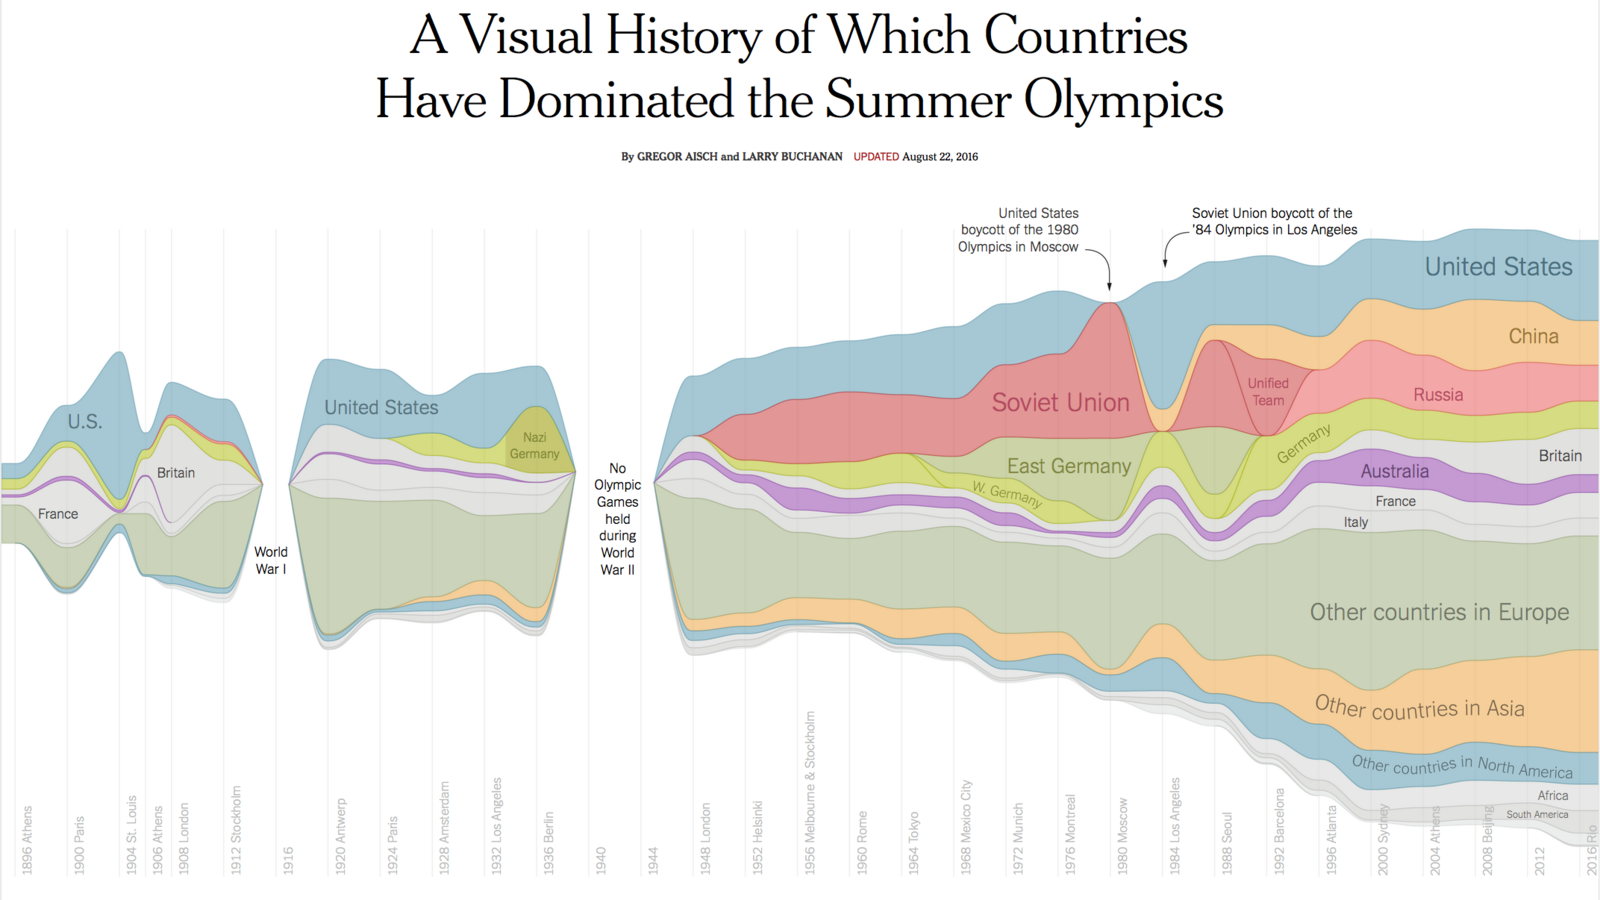
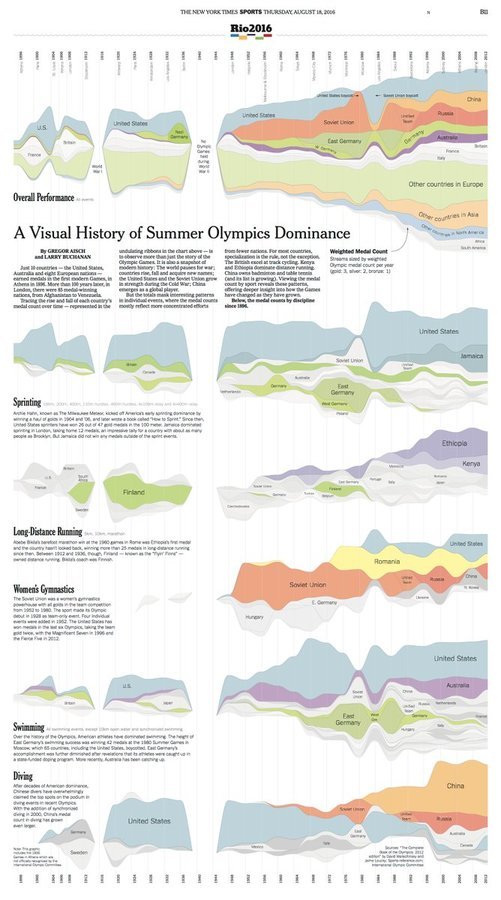
Streams
Tool
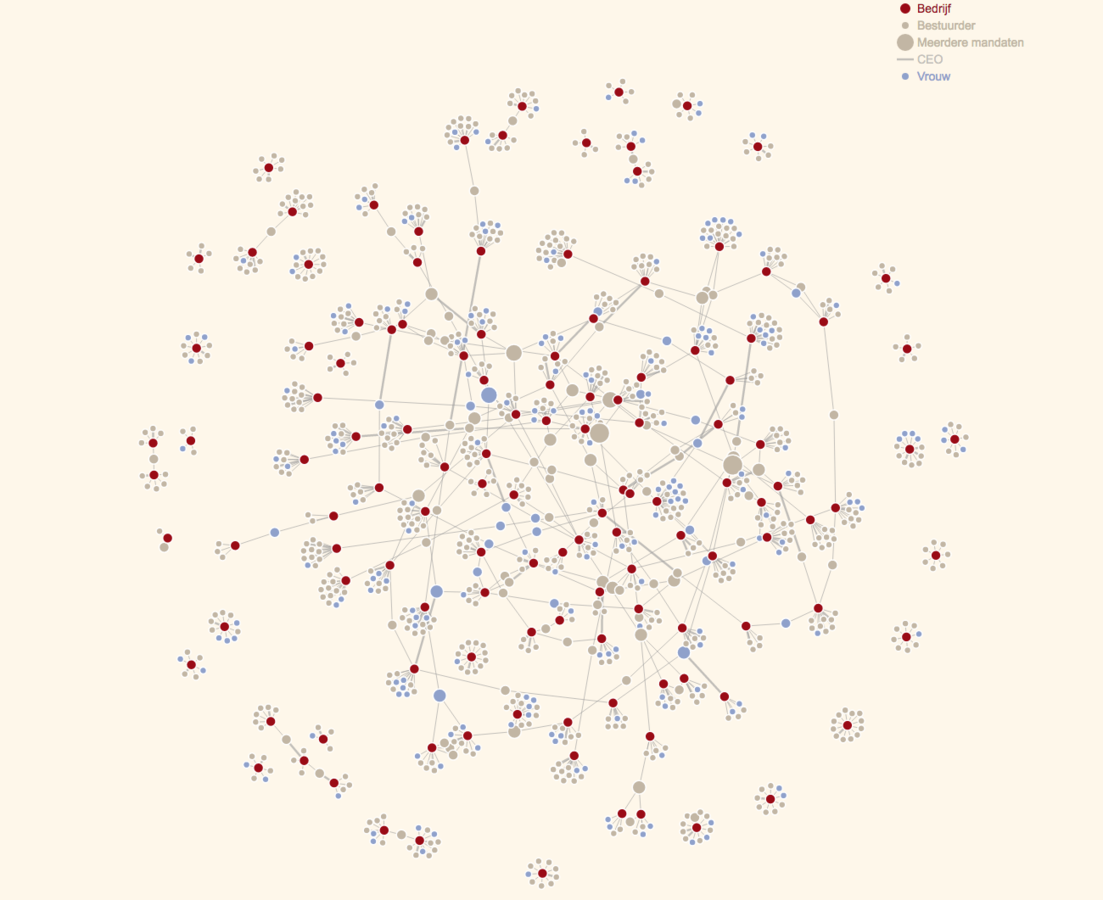
Networks
Tools
Small multiples
Tools
Maps
More
Thanks
Visualizing Knowledge | Workshop
By maartenzam


