Maor Frankel


Making Your Grandparents Happy
With Web App Performance Monitoring
Maor Frankel


Real Users!
- Medium/Old Phones
- Medium/Old Computers
- Slow Internet
WHY don't we accommodate?
- Maybe - You don't care
- Or maybe - You don't know...


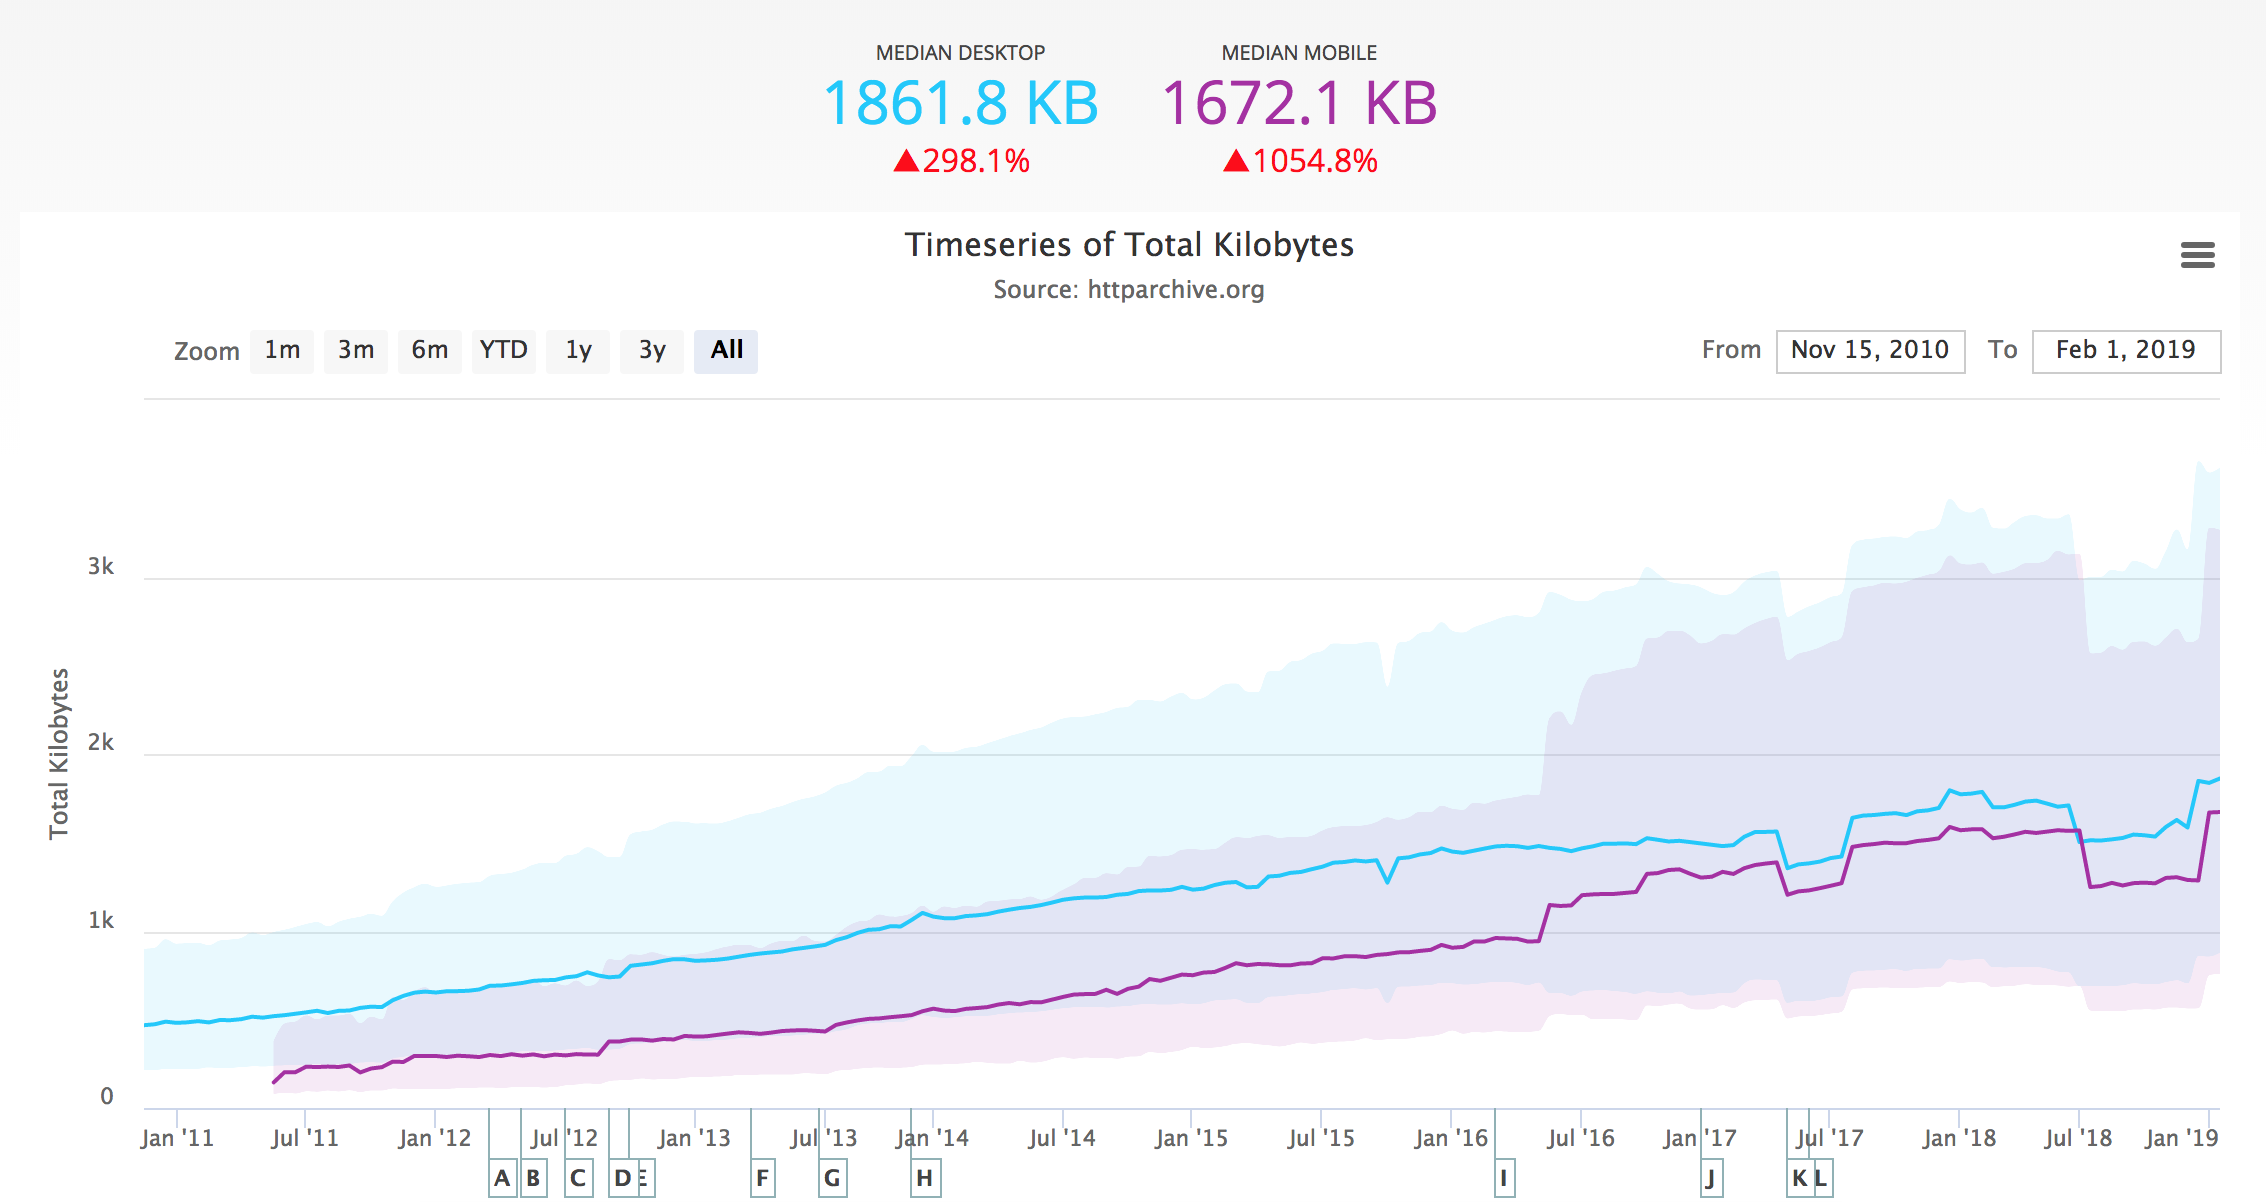
Total Kilobytes
http archive
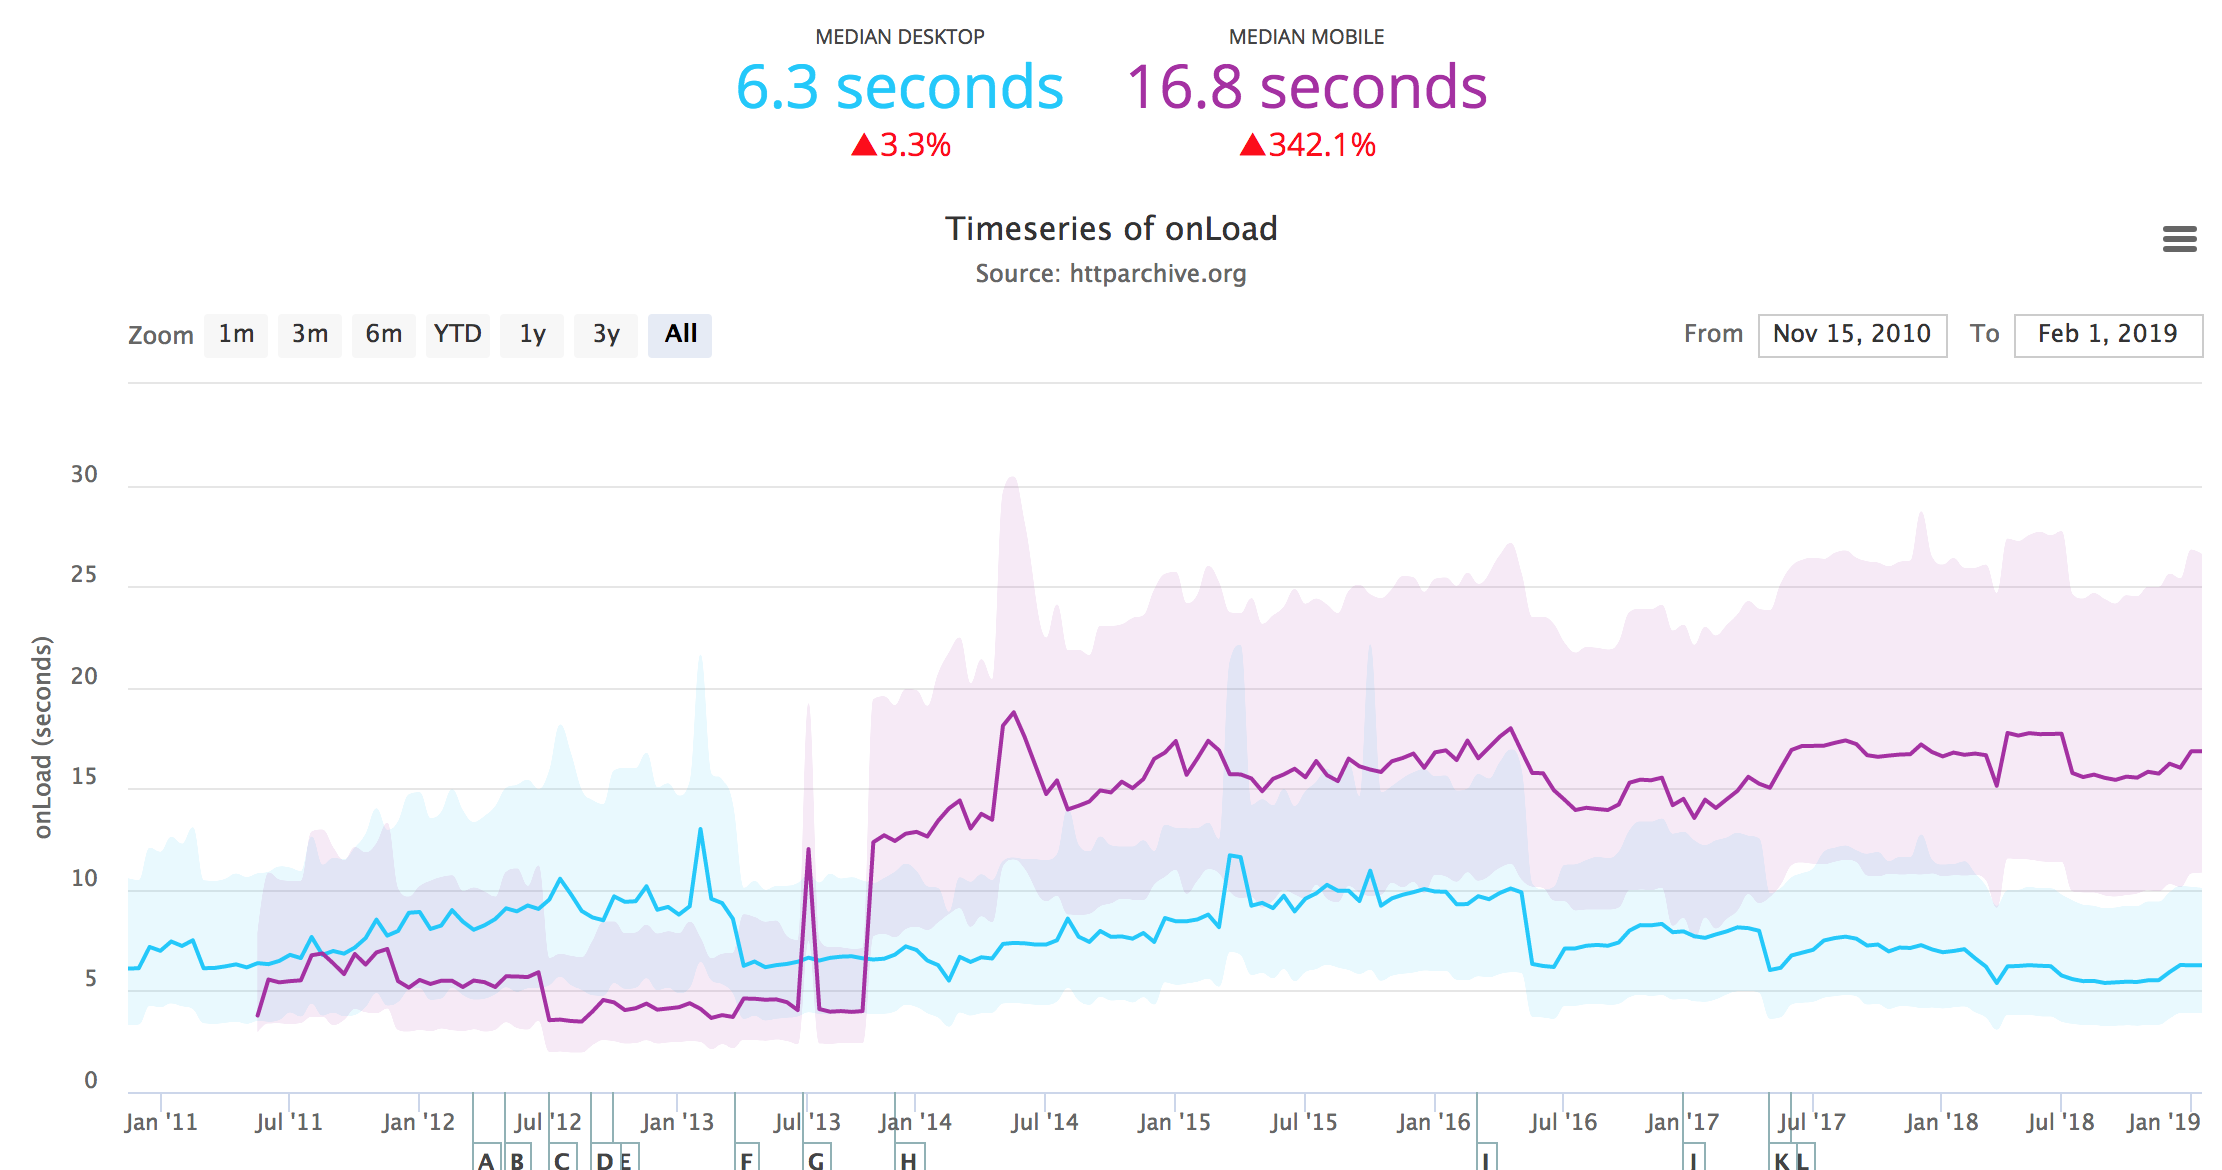
onLoad
http archive
- New web application, optimised for performance
- Over time, app became bigger, and slower
- We were in denial
- Users complained
background: #story;

What to do?
- Put out the fires - good
- How to prevent this from happening again? - better
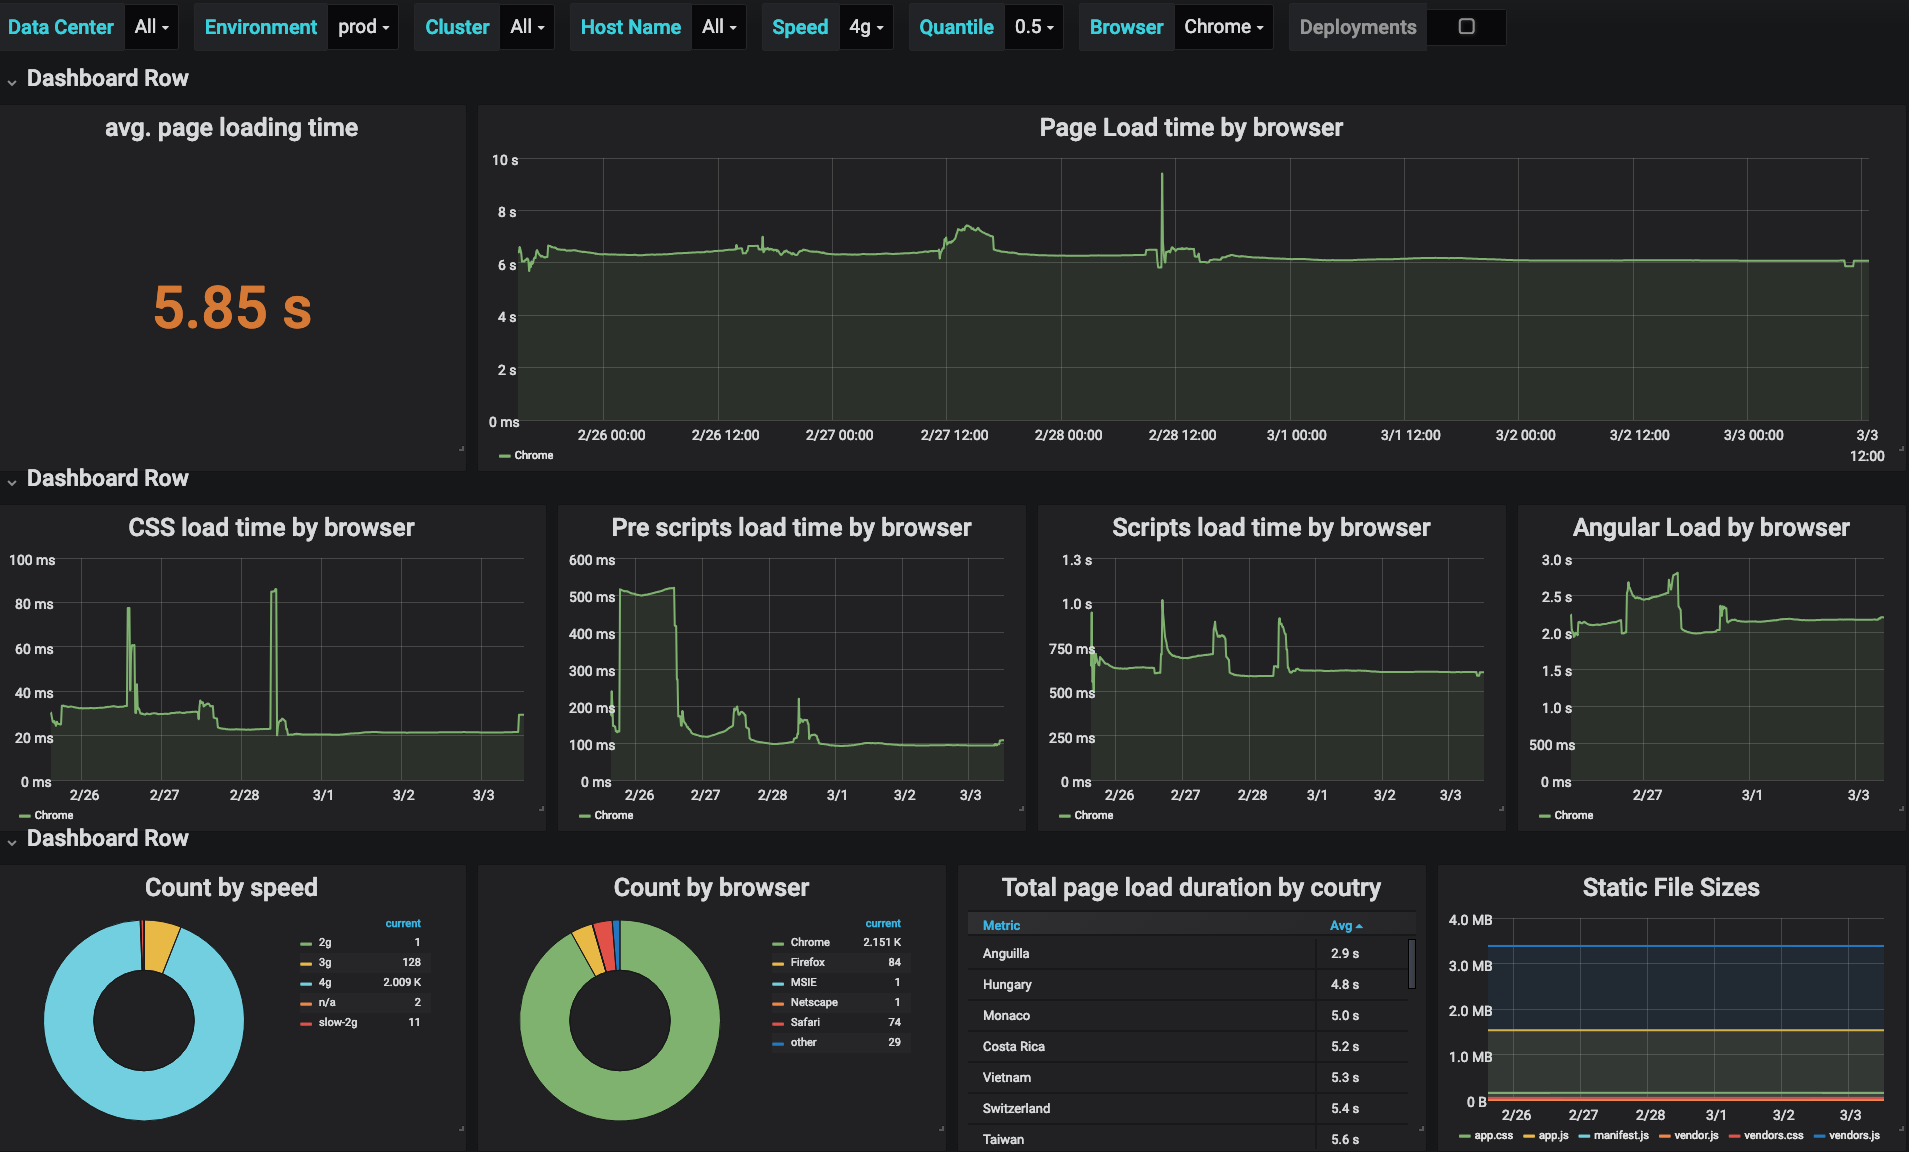
MONITORING
- Availability
- Functionality
- API Monitoring
- Synthetic Performance Tests
- ?

Real Time User Monitoring (RUM)
Real Data, Real Users, Real Time

Third Parties


"This is the time it takes the page to load. It begins when the navigation begins and ends when the webpage has completed loading in the user’s browser"
Page Load?
pageLoadTime = loadEventStart - navigationStart
BUILD YOUR OWN
Leverage our existing systems


The Plan!
Web Performance API
"The High Resolution Time standard defines a Performance interface that supports client-side latency measurements within applications. "
const then = performance.now();
console.log(then) // 3157728.1249999944

(function doSomething() {
    for(let i=0 ; i < 10000 ; i++){
    ///DO SOMETHING...

    }
})()

const now = performance.now();
console.log(now) // 3158311.935000005
console.log((now - then)) // 583.8100000107661
Good
performance.mark('doSomething-start')

function doSomething() {
    for(let i=0 ; i < 10000 ; i++){
     ///DO SOMETHING...
    }
}

performance.mark('doSomething-end')
performance.measure('doSomething', 'doSomething-start', 'doSomething-end')
let marks = performance.getEntriesByName('doSomething', 'mark')
console.info(`${marks[1].startTime - marks[0].startTime}`) // 583.8100000107661
Better
<!doctype html>
<html>
<head lang="en">
  <meta charset="UTF-8">
  <base href='/'/>
  <title>Outbrain - Amplify</title>
  <script>
    performance.mark('page-load-start');
  </script>
Marking key sections
<script>performance.mark('scripts-start');</script>

<script src="https://u.outbrain.com/static/vendor.87b3e412.js"></script>

<script src="https://u.outbrain.com/static/app.10f8627e.js"></script>

<script>performance.mark('scripts-end');</script>
Marking key sections
setDatasource(dataSource) {
   this.showGridLoadingOverlay()
   performance.mark('reports-start')
}


whenGridRenderComplete() {
   performance.mark('reports-end')
   this.hideGridLoadingOverlay()
}
Marking key sections
performance.measure('ob_css', 'css-start', 'css-end');
performance.measure('ob_scripts', 'scripts-start', 'scripts-end');
performance.measure('ob_total_page', 'total-page-start', 'reports-end');
Measuring the metrics
const measures = performance.getEntriesByType('measure');
    .filter(msr => msr.name.includes('ob_'))
    .map(msr => {
      return {
        name: msr.name,
        duration: parseInt(msr.duration),
        speed: connection ? connection.effectiveType : ''
      }
    });

//Fall back to http post
navigator.sendBeacon('/performance-benchmark', { measures });
Phoning home
 this.app.post('/performance-benchmark', this.performanceBenchmark.observe);

 async observe(req: express.Request, res: express.Response) {
   const events: BenchmarkEvent[] = this.parseEvents(req.body);
   this.metrics[`${event.name}_country`].observe(
            {
              app: event.app,
              browser: event.browser,
              speed: event.speed,
              country,
            },
            event.duration
          )
   })
    return res.sendStatus(200);
  }
Phoning home
Putting
it all together


The Gotchas
Reduce
The Noise
Big Data
Tracking
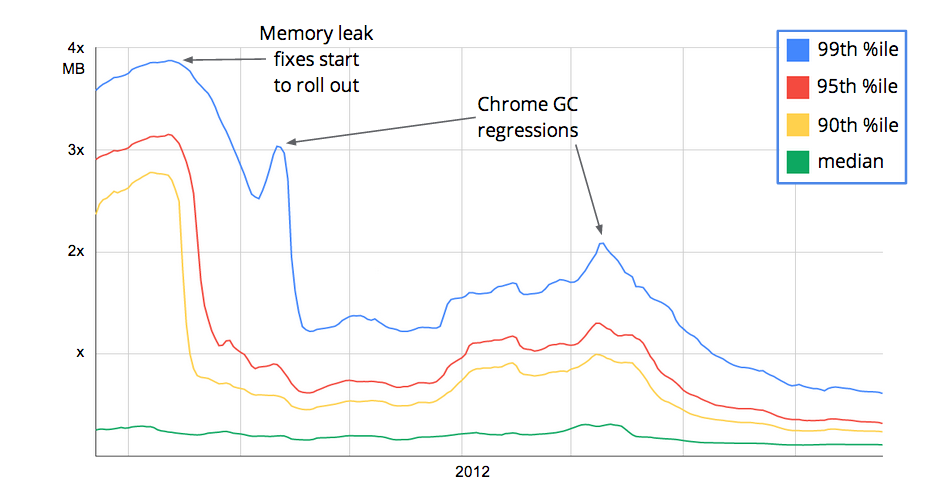
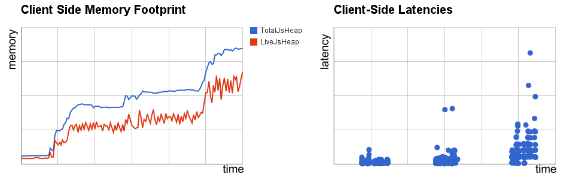
Memory Leaks
console.log(performance.memory);

// Would show, for example
{
 jsHeapSizeLimit: 767557632,
 totalJSHeapSize: 58054528,
 usedJSHeapSize: 42930044
}
Performance.memory
const MAX_MEMORY_LIMIT = 1000 * 1048576; // 1000MB

setInterval(() => {
    if(performance.memory.usedJsHeadSize > MAX_MEMORY_LIMIT){

    //fire alert
    }
}, 60000*30);
Performance.memory
SUCCESS!
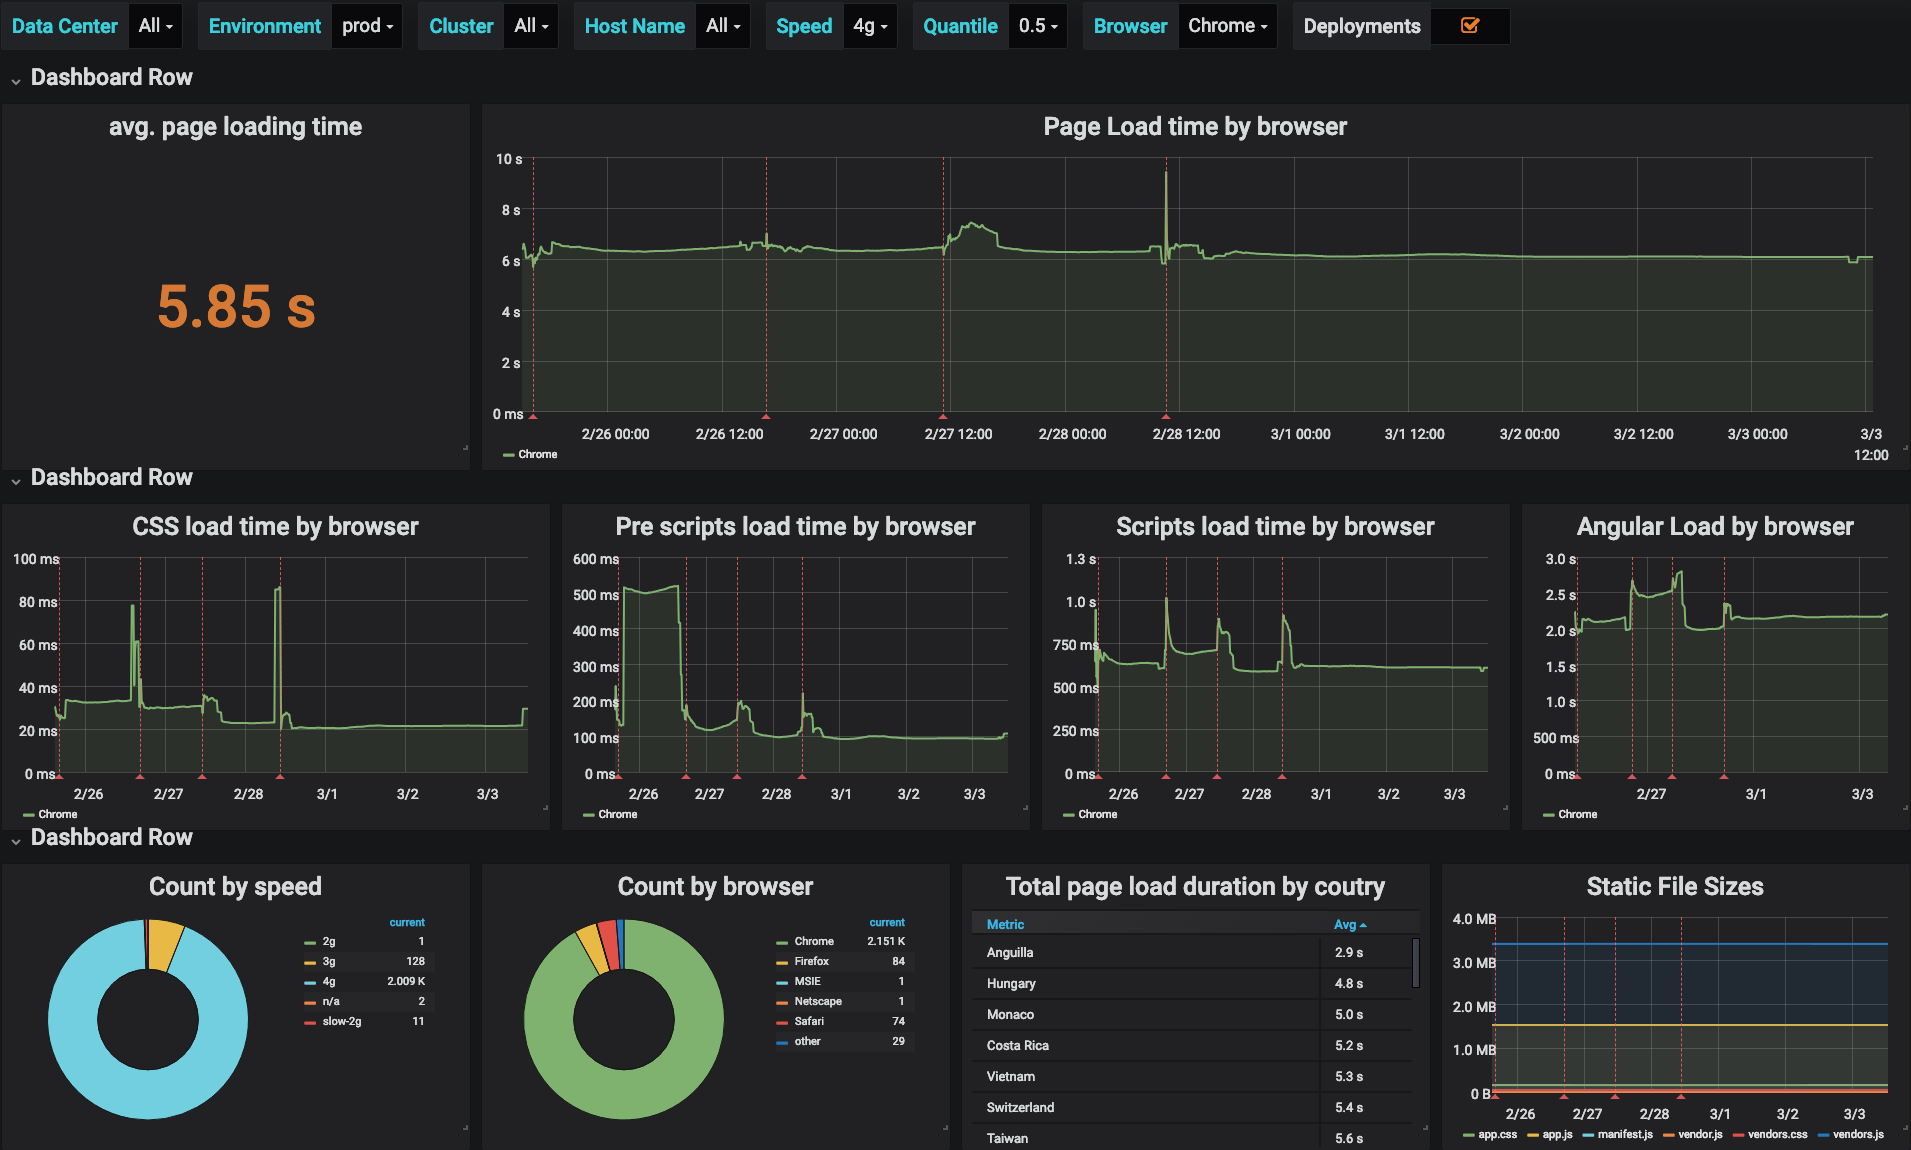
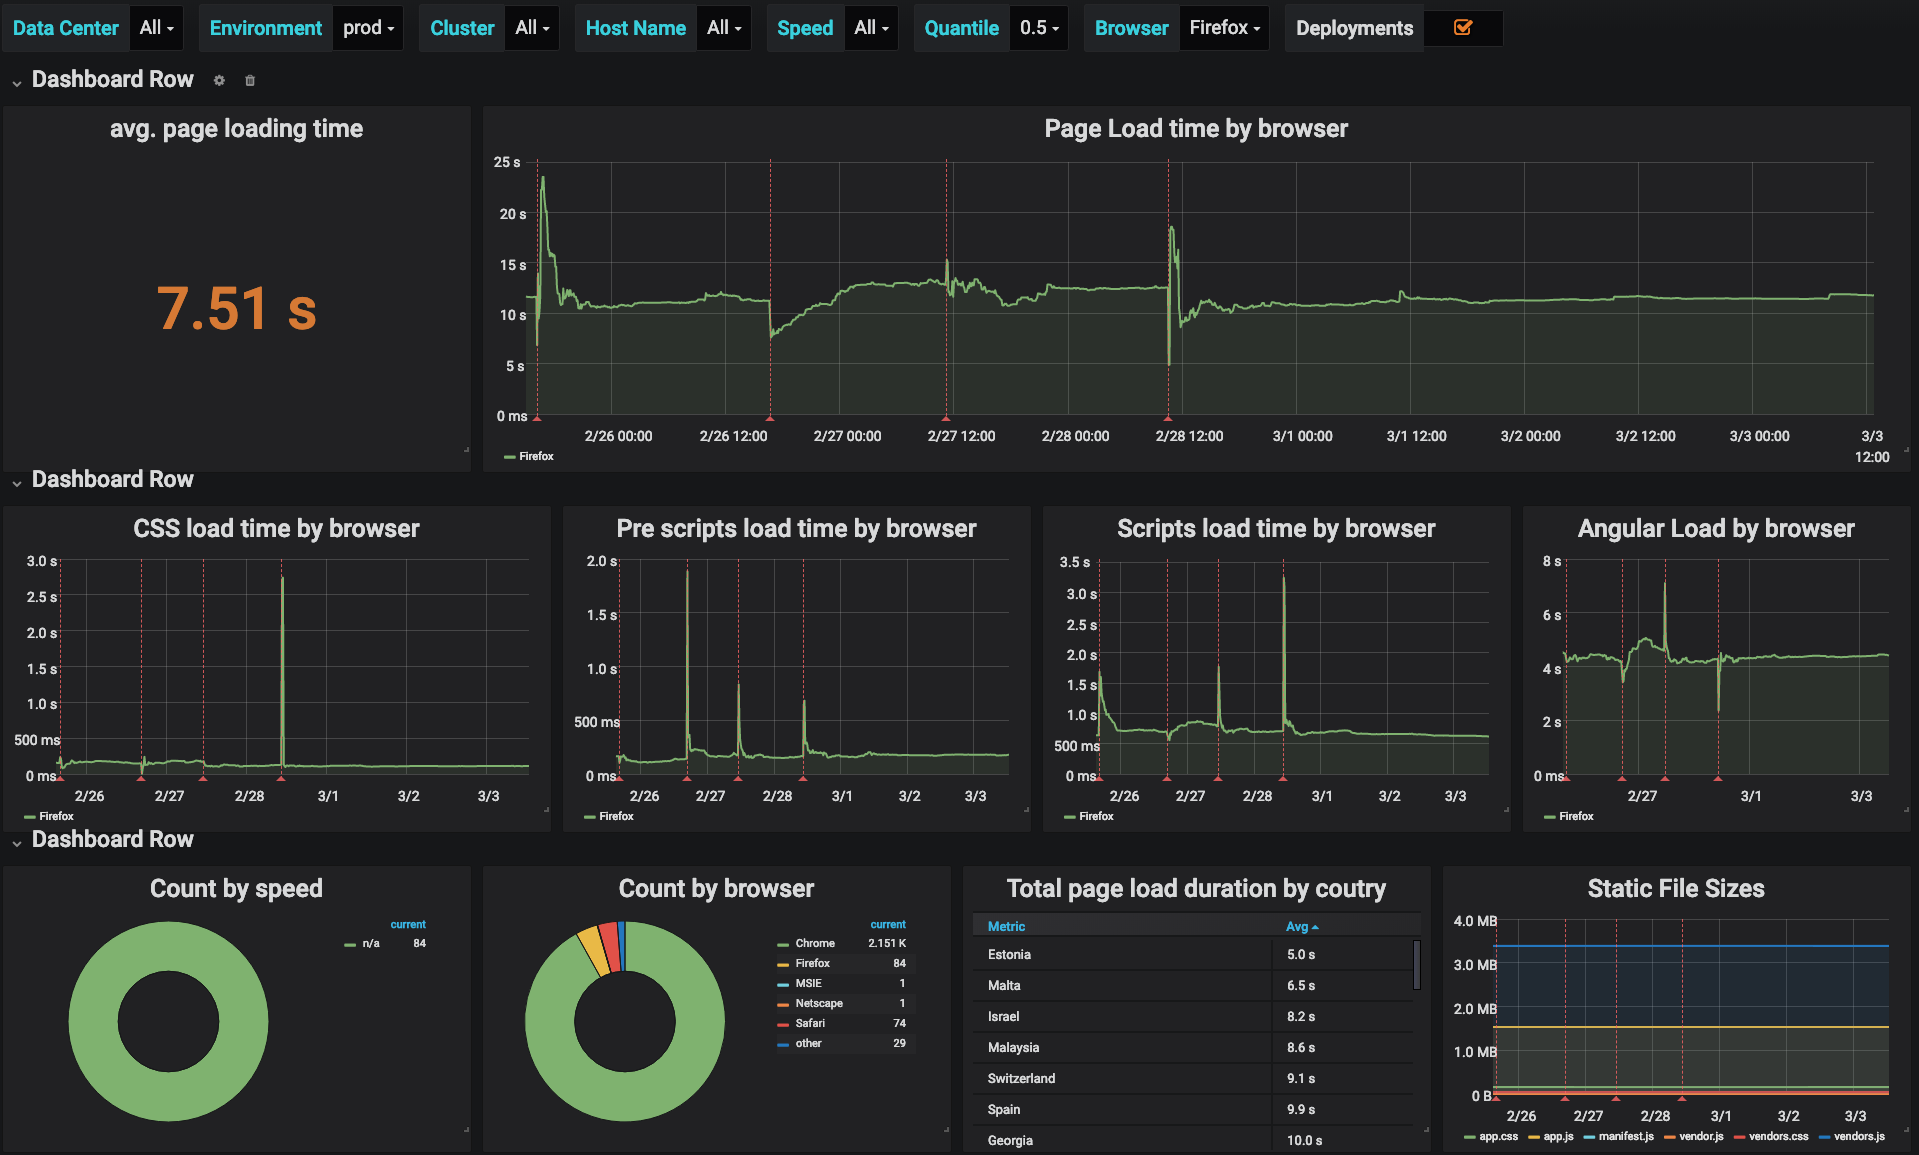
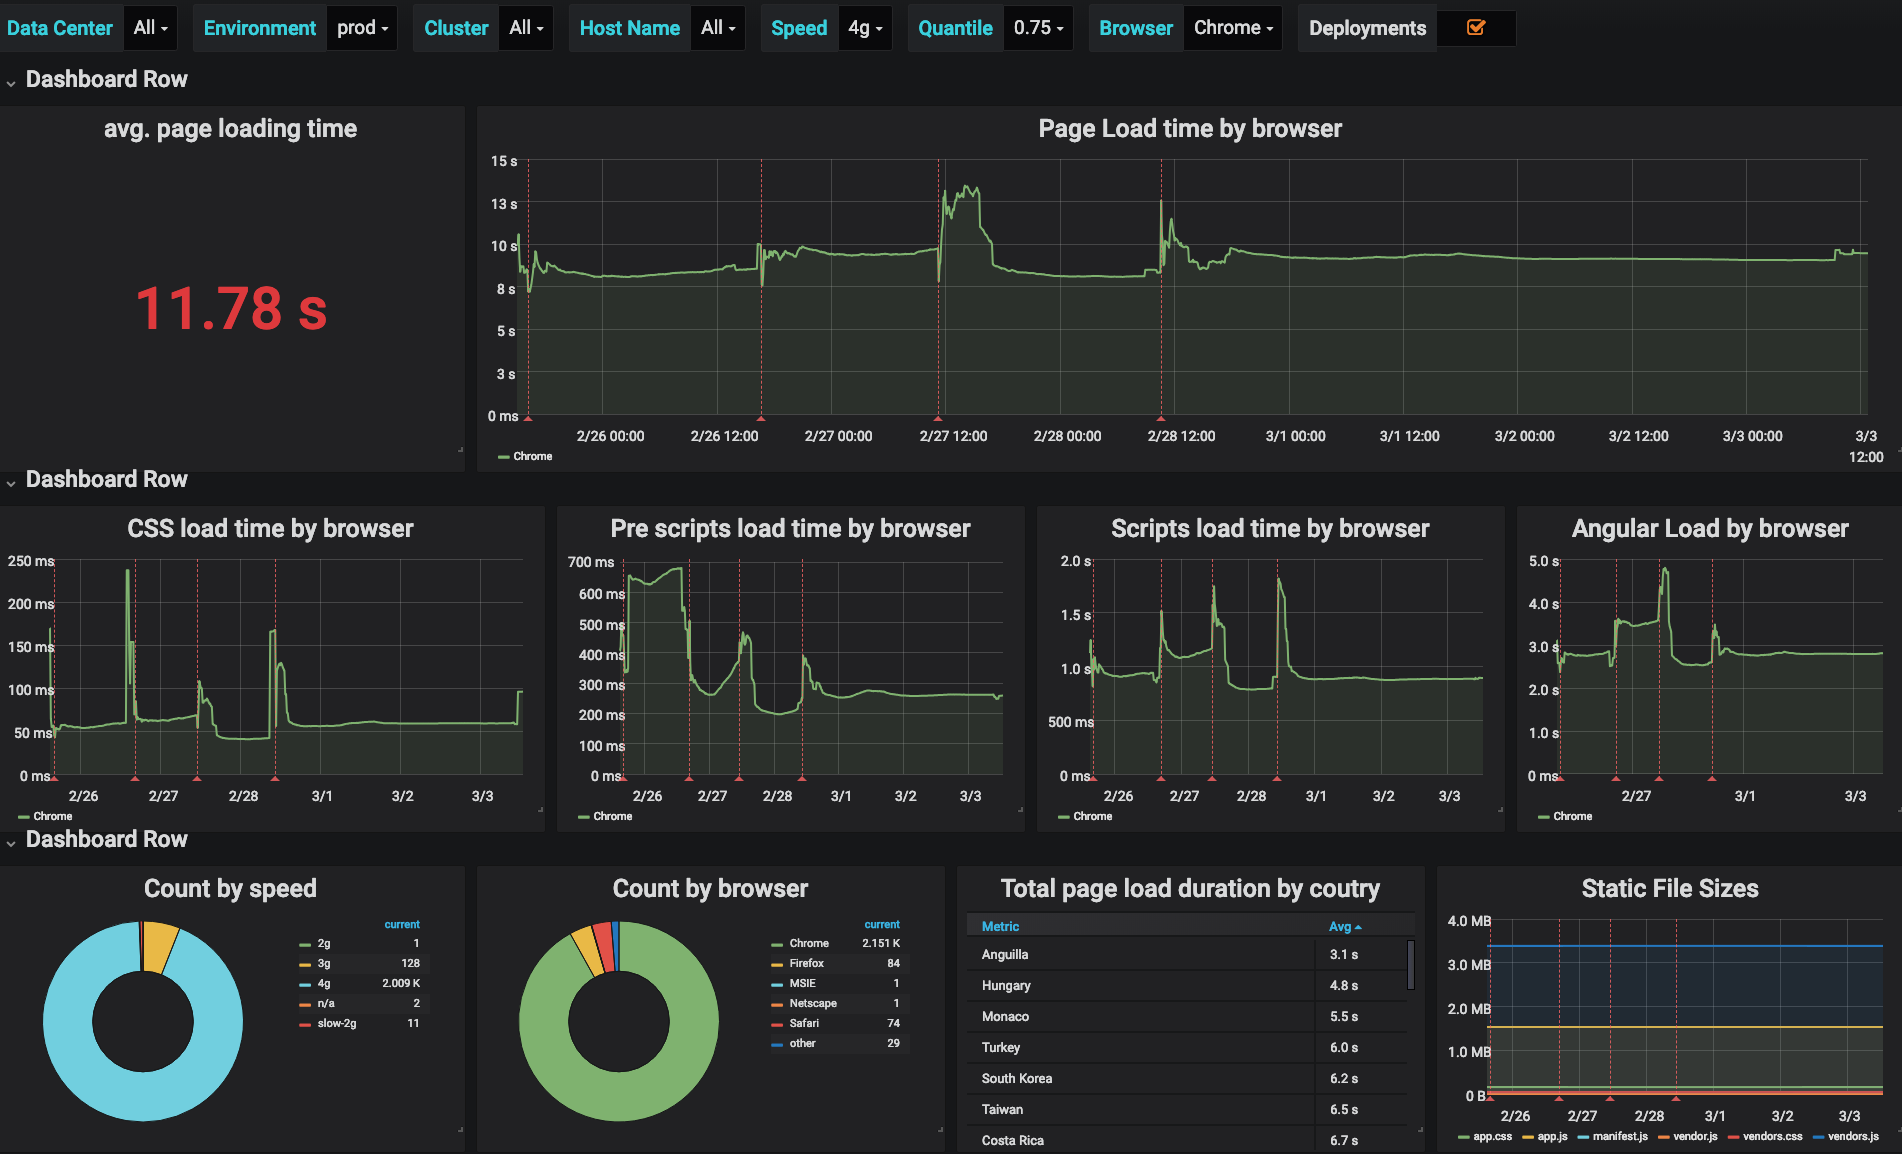
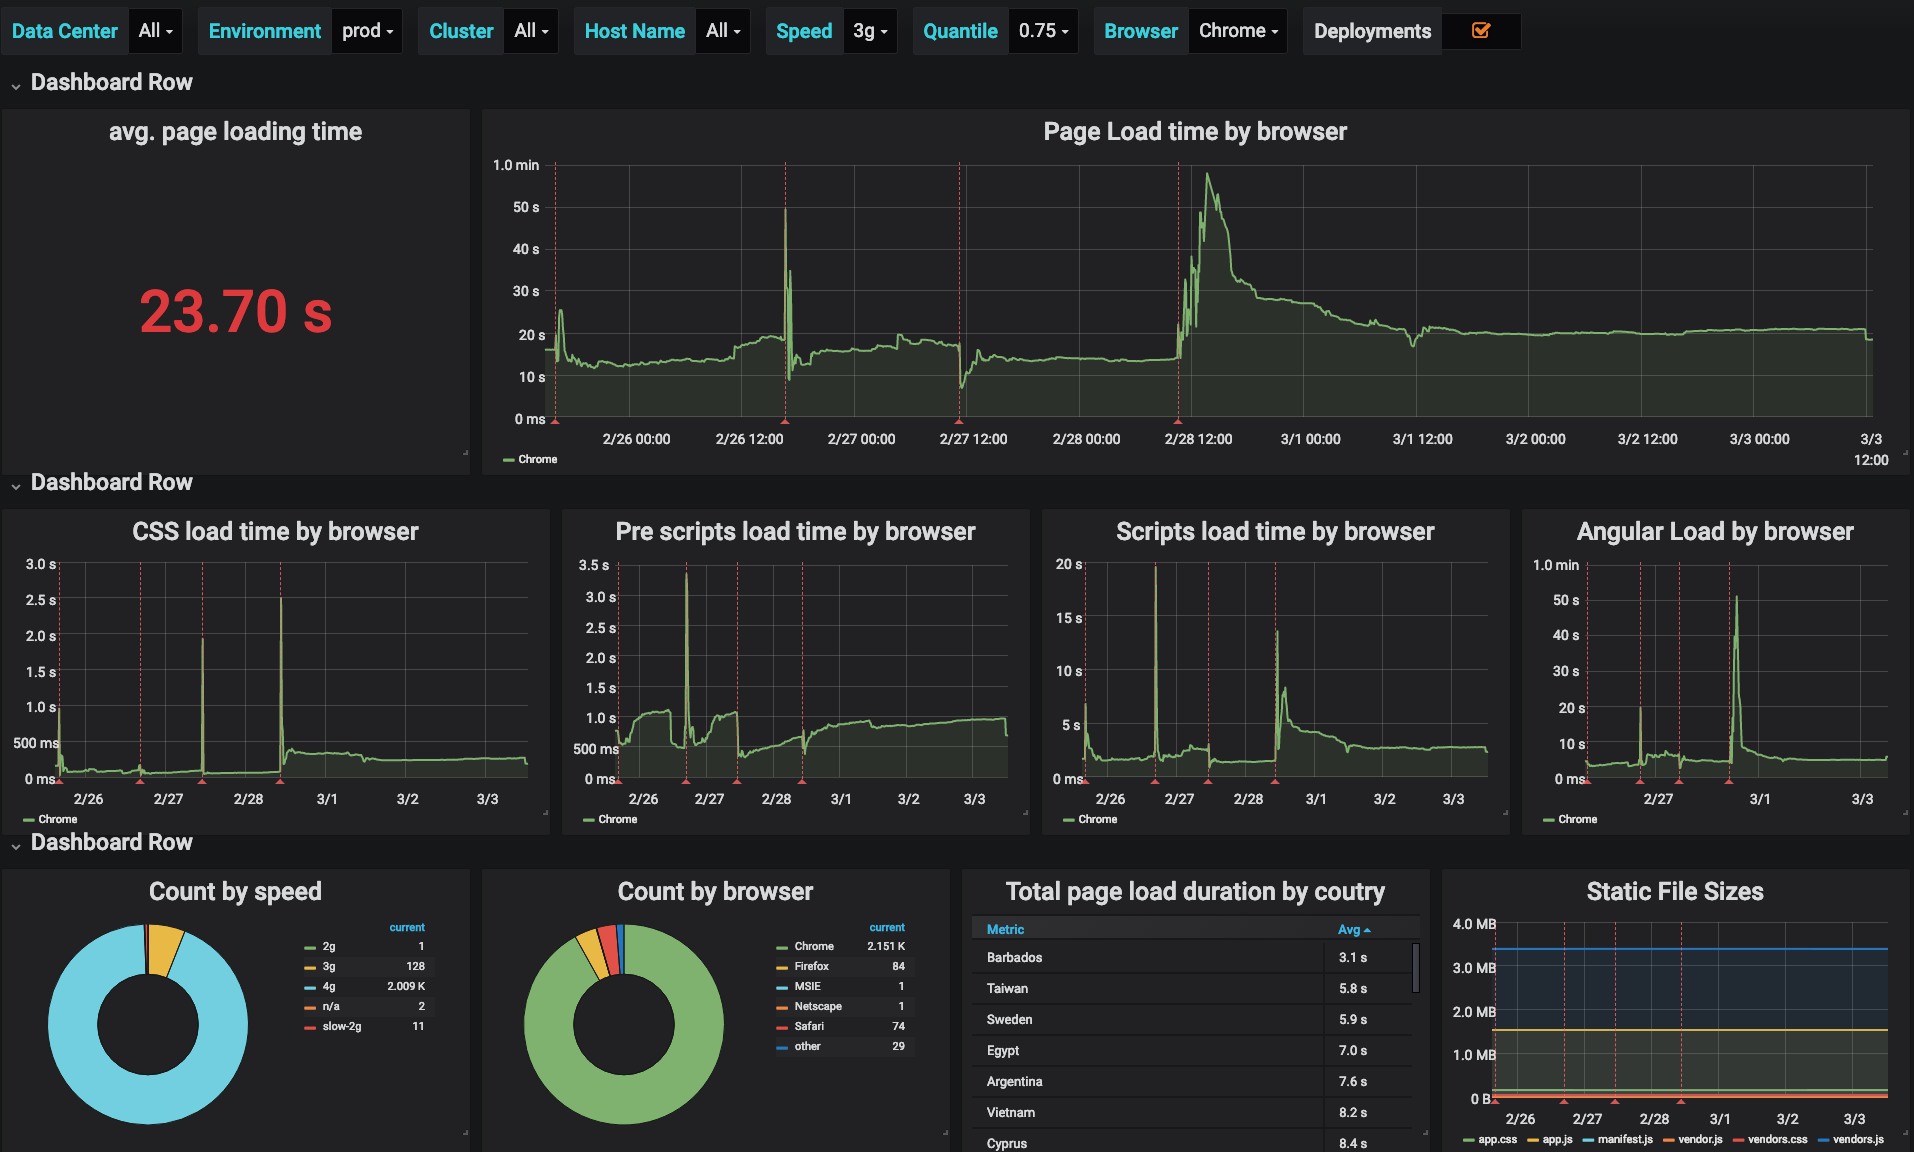
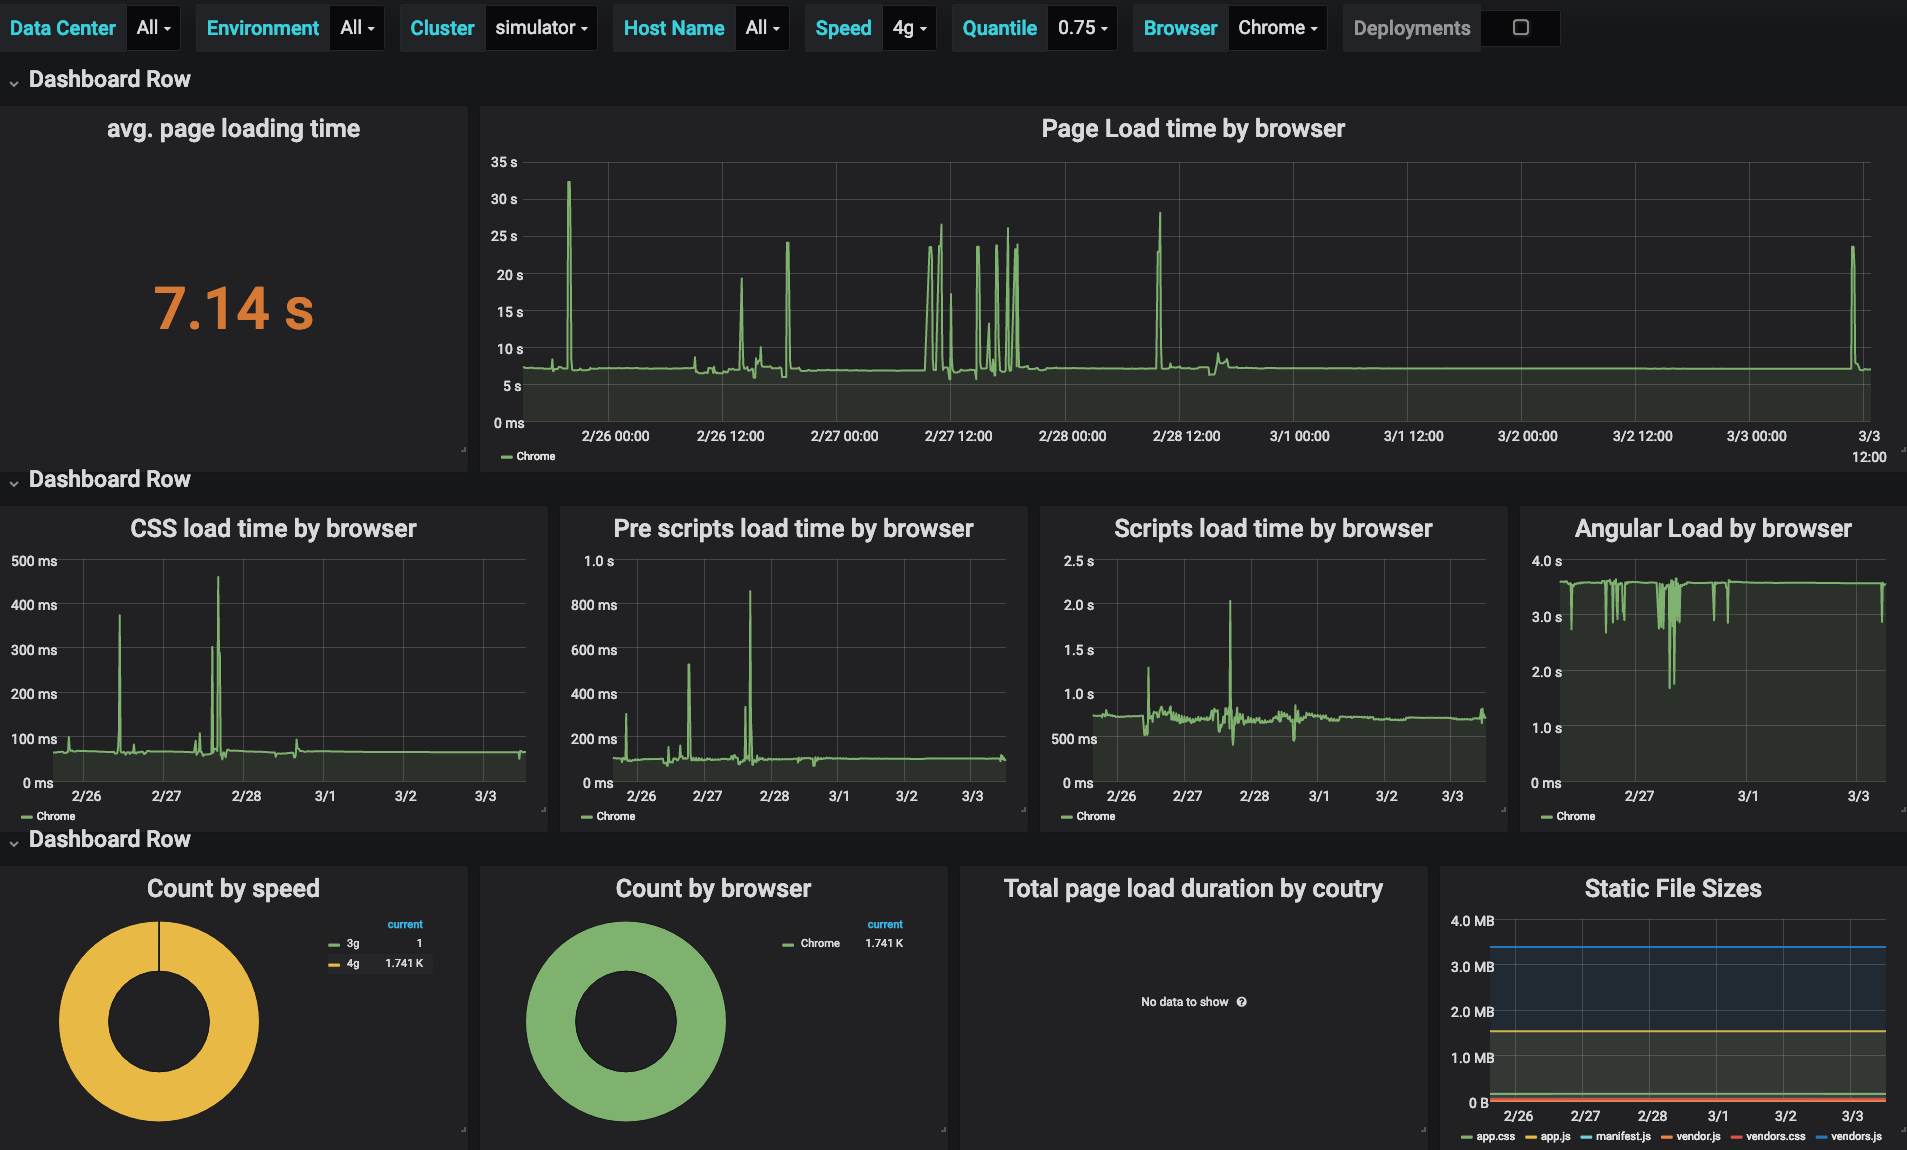
- Reduced load time from 20s to less then 9s (75 quentile)
- Raised developers awareness
- Better correlation between changes and performance issues
ETC...
- If your not monitoring it, it doesn't exist
- Dev time is not real time
- Before you pay for it, try to build it
QUESTIONS?
Thank You For Listening!

http://tinyurl.com/y4y4b64j
@Mr_Frankel
@MrFrank


Making your grandparents happy with web app performance monitoring
By Maor Frankel


