The future of FLUOR
nic scott
NASA ARC
FLUOR to JouFLU


Science Case: Exozodis
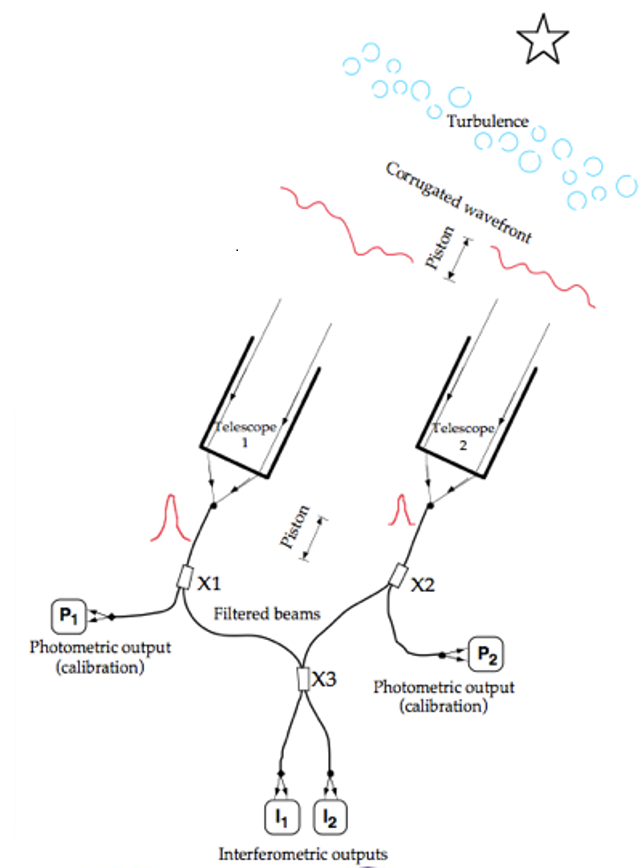
Exozodiacal Disks
- Not to be confused with debris disks
- Require interferometry to detect
- High levels (100-1000 zodi) even in >100 Myr systems
- Confound the detection of exoEarths
- Probe the structure of inner system
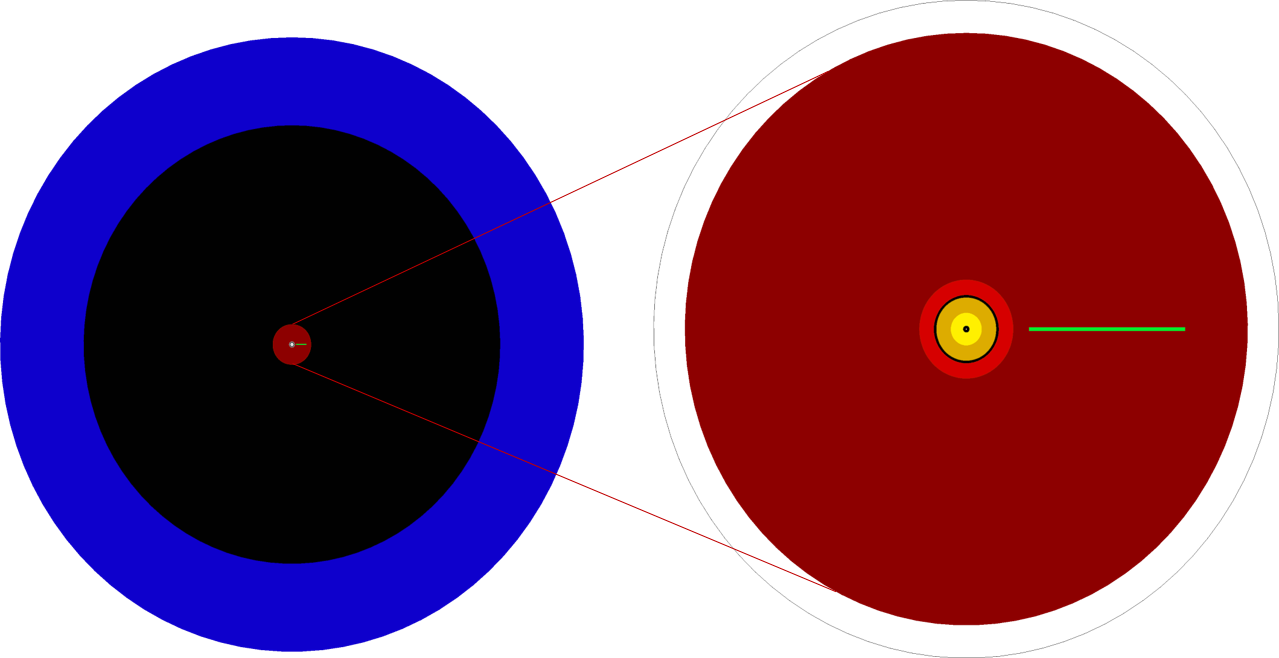
1 AU terrestrial planet with gap
0.5 – 1.5 AU warm dust disk 500K
0.1 – 0.5 AU hot dust disk > 1000K
Center A0 star @ 10 pcc
< 100K
100 AU
100-1400K
< 10 AU
HZ
Resonant structures could indicate planets indirectly [7]
Zodi levels of dust affect Earth detection
Our disk is the most luminous object in SS after the Sun.
Earth would be a clump in the zodi at visible and IR [1]
10-20 zodi would compromise exoEarth detection [2,3] Interferometric, astrometric, direct, photometric, ...
exoEarth detection is divided by factor of 2 for exozodi level increase of 10 [5]
exoEarth detection becomes challenging if exozodi level is ~20 zodis and clumpy [4]
\(\geq\)10% of Gyr old MS stars may have enough exozodi dust to complicate exoEarth imaging [6]
Correlation with spectral type or outer reservoir?


\(\leftarrow\) tentative correlation with stellar rotation supports the magnetic trapping model but not conclusive.
Nuñez et al. 2017

6/33 new circumstellar excesses at \(\geq\)1% level
- 2 of these detections can be attributed to uniform CSE
- 4 are known or suspected binaries.
The difference of between the instrumental noise and the JouFLU significance distribution yields an estimate of 9 undetected excesses.
Nuñez et al. 2017
NIR
VLTI - PIONIER
Ertel et al 2014 merged FLUOR+PIONIER samples (n~125) reaching 0.25% precision
-
Rate decreases across spectral type
-
Matches cold disk trend. Common origin?
-
-
No correlation b/t hot dust and cold dust.*
-
Different origin for hot and cold discs?
-
-
Slight increase in exozodi detection with stellar age
-
Stochastic rather than steady-state process [46,33,34,35]?
-
-
No correlation b/t exoplanets and exozodi.


HD 7788 shows variability
-
excess disappeared for a year
Near Infrared Exozodi Variability Study
Dust production mechanism poorly understood
Destruction factors:
- Sublimation
- Radiation Pressure
- Poynting-Robertson (P-R) drag
Models:
- Steady state/continuous replenishment
- Steady state/trapped nano-grains
- LHB & outgassing
- Keplerian time scale ~weeks/months


iot Psc
ups And
kap CrB
gam Ser
HD 98058
- \(\Phi\) Leo spectra shows signs of exocomet infall and evaporation [45]
HD 210418
- A-type with 1.7 ± 0.5% excess from 2013
HD 222368
-
F-type with 1.3 ± 0.3% excess from 2013
Tet Boo
-
Solar type star with no previously known dust excess
-
Significant excess at 10 micron with the LBTI nuller.
-
Potentially huge implications on our understanding of exozodi level upper limits, and dust generation mechanisms around such stars.
| From LBTI | |||
|
10700 | exoplanet host | |
| 13 Uma | 78154 | LBTI excess | |
| kap01 ceti | 20630 | exoplanet host | |
| 1 Ori | 30652 | ||
| tau Boo | 120136 |
The Problem
Signs of problems


differential polarization rotation
differential polarization phase delay
Added Lithium Niobate plates to correct polarization, but decreases throughput.
Limiting Kmag ~4.5-5.2 from 2015-2016 is now ~3

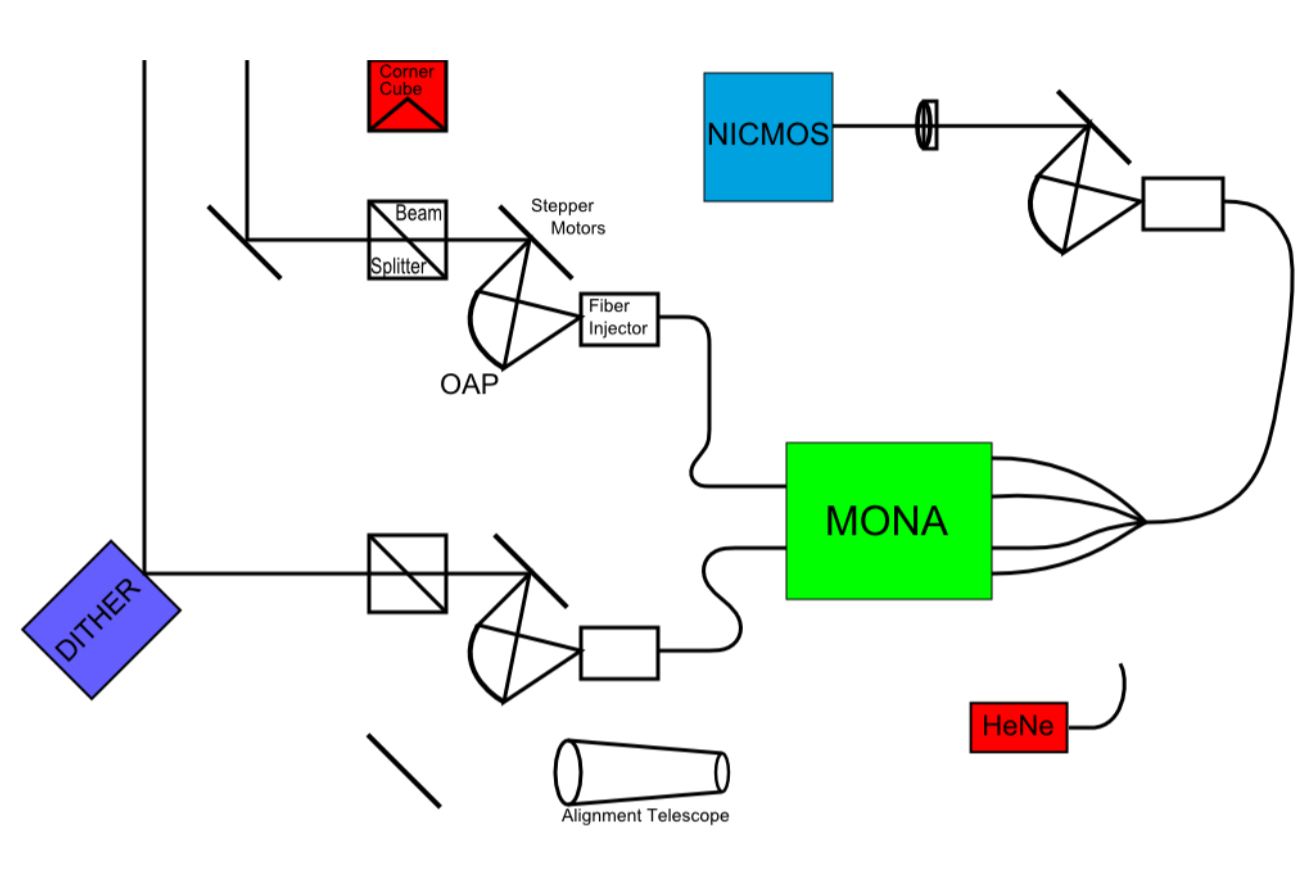
1. Connect Beam 5 fiber to input A and Beam 6 fiber to input B. (default arrangement)
2. Close the beam 6 shutter and measure the four outputs.
3. Open the beam 6 shutter, close the beam 5 shutter, and measure the four outputs.
4. Open both shutters and measure the four outputs.
5. Move the beam 5 fiber to input B, move the beam 6 fiber to input A, and repeat all 3 measurements.
6. Swap beam 5 and beam 6 on the beam sampler and repeat the complete set of 6 measurments.
determined beam ratio and coupling efficiency for each input
I2 interferometric channel does not see anything from beam A. Could be a broken fiber in MONA?
- no sig difference in coupling efficiency of the two stages.
- no sig difference in light in beam 5 and beam 6
- Most significant difference:
- input A 80% to photometric output
- input B 13% to the photometric output
-
Each branch of the fiber bundle transmits basically the same (max counts well w/i +/- 8%)
- Bundle still seems fine
- Confirms that the two stages have essentially the same efficiency.
- MONA seems to be the problematic part.

The ratio of light reaching the interferometric output from input A and Input B.


"The conclusion we seem to converge upon is that the problem is in the MONA box.
Not enough light coming from Input A to the inteferometric channels."
MONA_Normalized_Count
This shows the total amount of light getting through normalize for Kmag, ie Count / 10\(^{(mag/-2.5)}\). Decline in 2016 after we put the polarization corrector plates in.
Percentage of light from input A(top) and B(bottom) reaching it's photometric output and the two inteferometeric outputs. There is a clear change after the unit was sent back to France. It seems much more light is going to the photometric channel and much less to the interferometric outputs.

Possible Solutions
JouFLU upgrade paths
JouFLU prior limit

JouFLU potential
JouFLU present
Getting to 5th mag could more than double the number of targets observable
CHARA AO is now coming online \(\rightarrow\) greatly improved obs efficiency
- ZBLAN IO chip
- losses ~0.4 db/cm
- get H band IO chip as "bonus"
- v-groove and coupling optics (Ozoptics)
- input and output mounts
- option: 4 beam H+K simultaneous
Saphira Selex detector
- will enable drastically better spectrally dispersed results
- +350k
| transmission | <0.01 | db/m |
| bandpass | 2 - 2.3 | \(\mu\)m |
| NA/lambda_c | 0.089 | \(\mu\)m |
|
20-30% to photom, 70-80% to Interferometric. I1 & I2 balanced |
| NA | 0.17 ± 0.01 |
| cutoff | < 1.95 \(\mu\)m |
| bandpass | 2.0 - 2.4 \(\mu\)m |
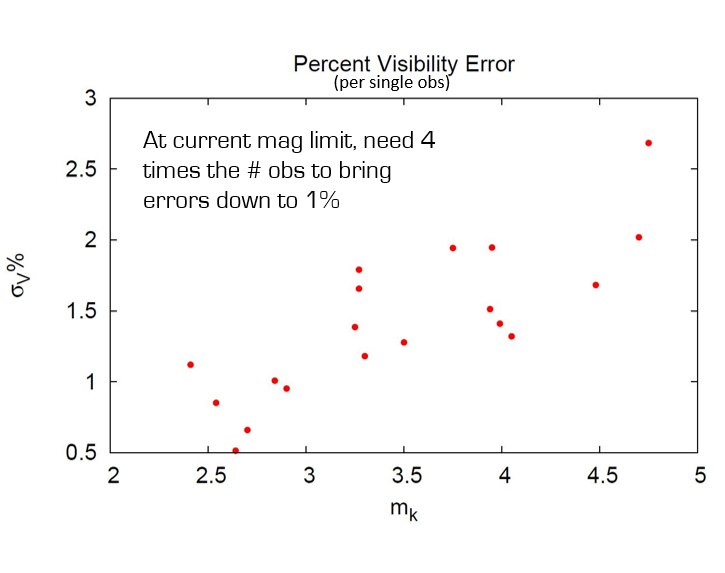
Goal is 1% excess detection at 5σ to mK < 5.

Takeaway
-
Explore the apparent variability of known exozodis
- long-term monitoring
- clues to source and formation of the dust
-
Expand strong exozodi sample
- leveraging LBTI and prior surveys
- from ~100 \(\rightarrow\) ~1000 objects
- Use spectral dispersion to resolve the thermal/scattered dilemma
- Risk mitigation for coronagraphy/starshade missions
-
Target selection and characterization for mid/large missions (TESS, LUVOIR, HabEx, etc)
- exozodis likely to be dominant noise source
- Precision diameters and fundamental astrophysics
Science gaps on Exoplanet program office list
-
Science gap Number 4
- Planetary System Architecture
- Science gap Number 6
- Yield estimation for exoplanet direct imaging missions
- Science gap number 7
- Improve target lists and compilations of stellar parameters for exoplanet missions in operation or under study
- Science gap number 10
- Precursor surveys of direct image targets
- Science gap Number 11
- Understanding the abundance and distribution of exozodiacal dust
NN-Explore/NASA
ExoZodiacal
Monitoring
Observatory

References
[1] Kelsall et al. 1998
[2] Beichman et al. 2006 ApJ 652
[3] Roberge et al. 2012
[4] Defrère et al. Proc. SPIE 2012
[5] Stark et al. 2014
[6] Kennedy & Wyatt 2013
[7] Wyatt et al. 1999
[8] Fajardo-Acosta et al. 2000
[9] Mannings & Barlow 1998
[10] Laureijs et al. 2002
[11] Lawler et al. 2009
[12] Wyatt et al. 2007 ApJ 658
[13] Defrère et al. 2015
[14] Mennesson et al. 2014
[15] Absil et al. 2013
[16] Ciardi et al. 2001
[17] di Folco et al. 2004
[18] Absil et al. 2006
[19] di Folco et al. 2007
[20] Absil et al. 2008b
[23] Defrère et al. 2011
[24] Mennesson et al. 2011a
[25] Mawet et al. 2011
[26] Lisse et al. 2012
[27] Weinberger et al. 2011
[28] Defrère et al. 2012a
[29] Lisse et al. 2013
[30] Ertel et al. 2014
[31] Marion et al. 2014
[32] Nuñez et al. 2017
[33] Kral et al. 2013
[34] Krivov et al. 2006
[35] Wyatt et al. 2007 ApJ 663
[36] Defrère et al. 2012 A&A 546
[37] Marshall et al. 2016
[38] van Lieshout et al. 2014 A&A 571
[39] Jackson et al. 2012
[40] Rieke et al. 2016
[41] Su et al. 2016
[42] Wyatt et al. 2008
[43] Su et al. 2013
[44] Lebreton et al. 2013
[45] Eiroa et al. 2016, A&A 594, Oct 2016
[46] Faramaz et al. 2016
[47] Ertel et al. 2018
Scott-CHARA_meeting_2019
By Nic Scott


