


Ramiz Qudsi
From state of caffeination to citation!
Preliminary analysis and observations
Prepared by:
Ramiz A. Qudsi
Updated on: 2025-04-10
All codes are available for access in the LEXI-GitHub repository: LEXI Data Analysis
For Data access, see the next slide
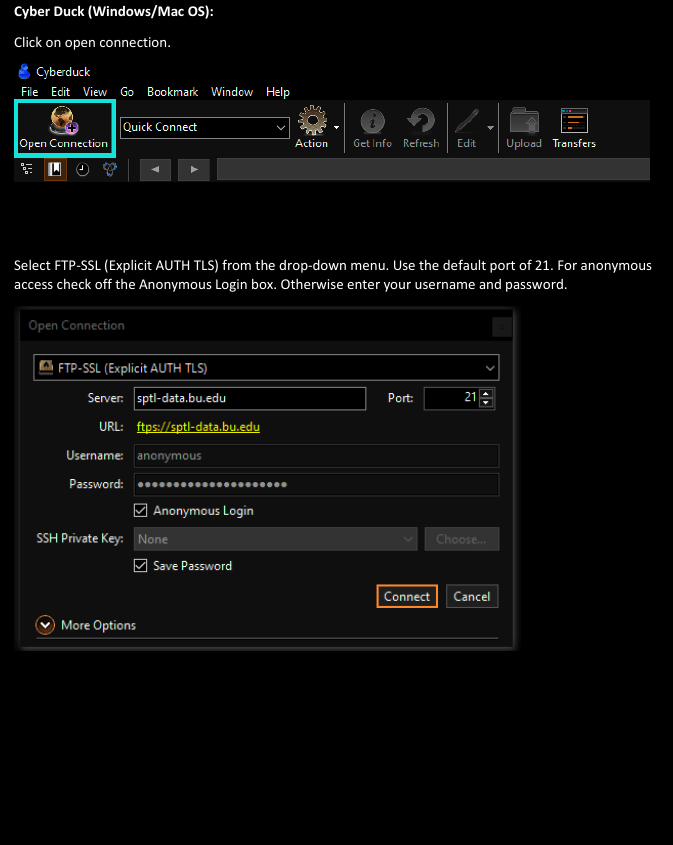
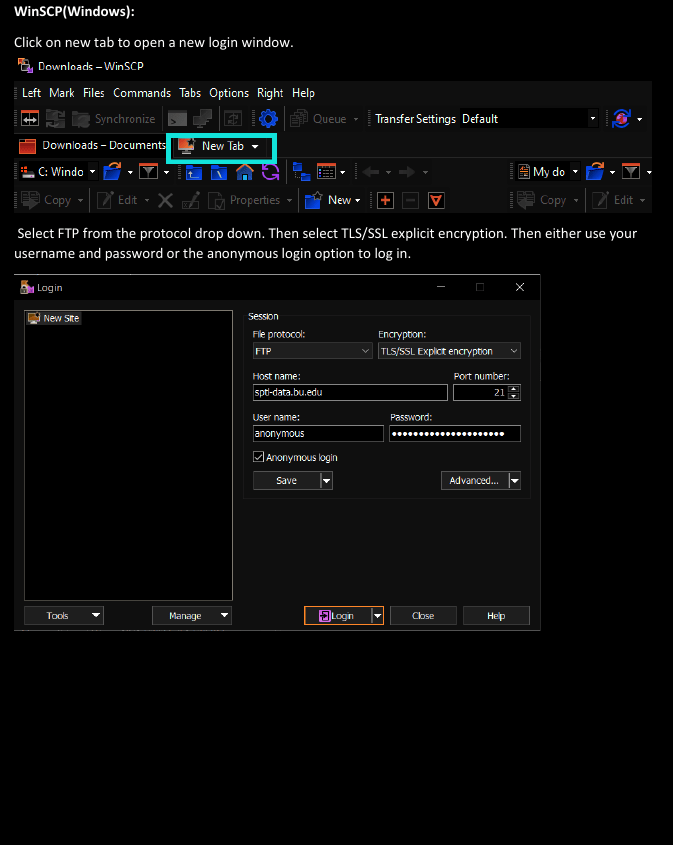
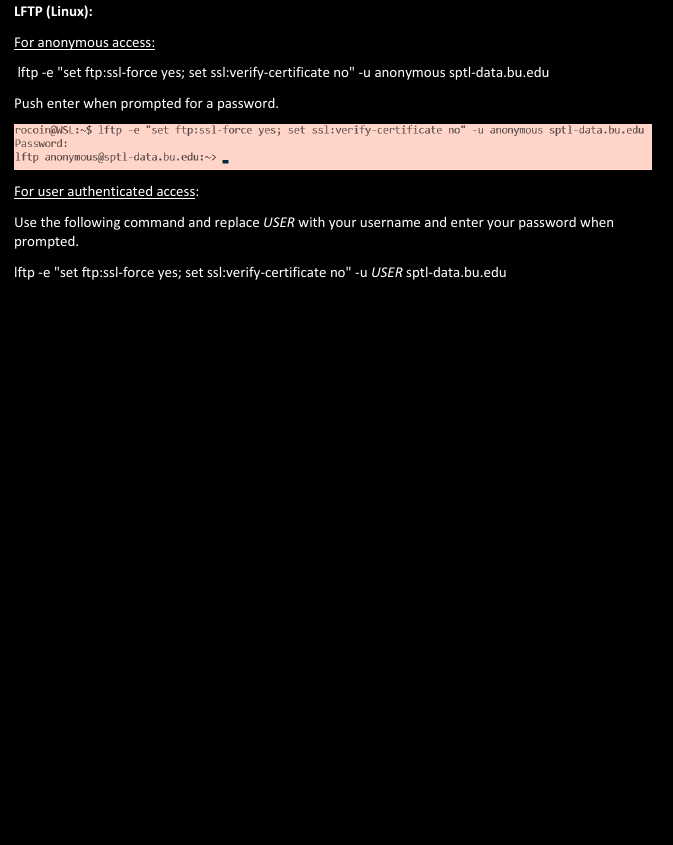
Accessing Codes and DATA
Histogram Diff analysis
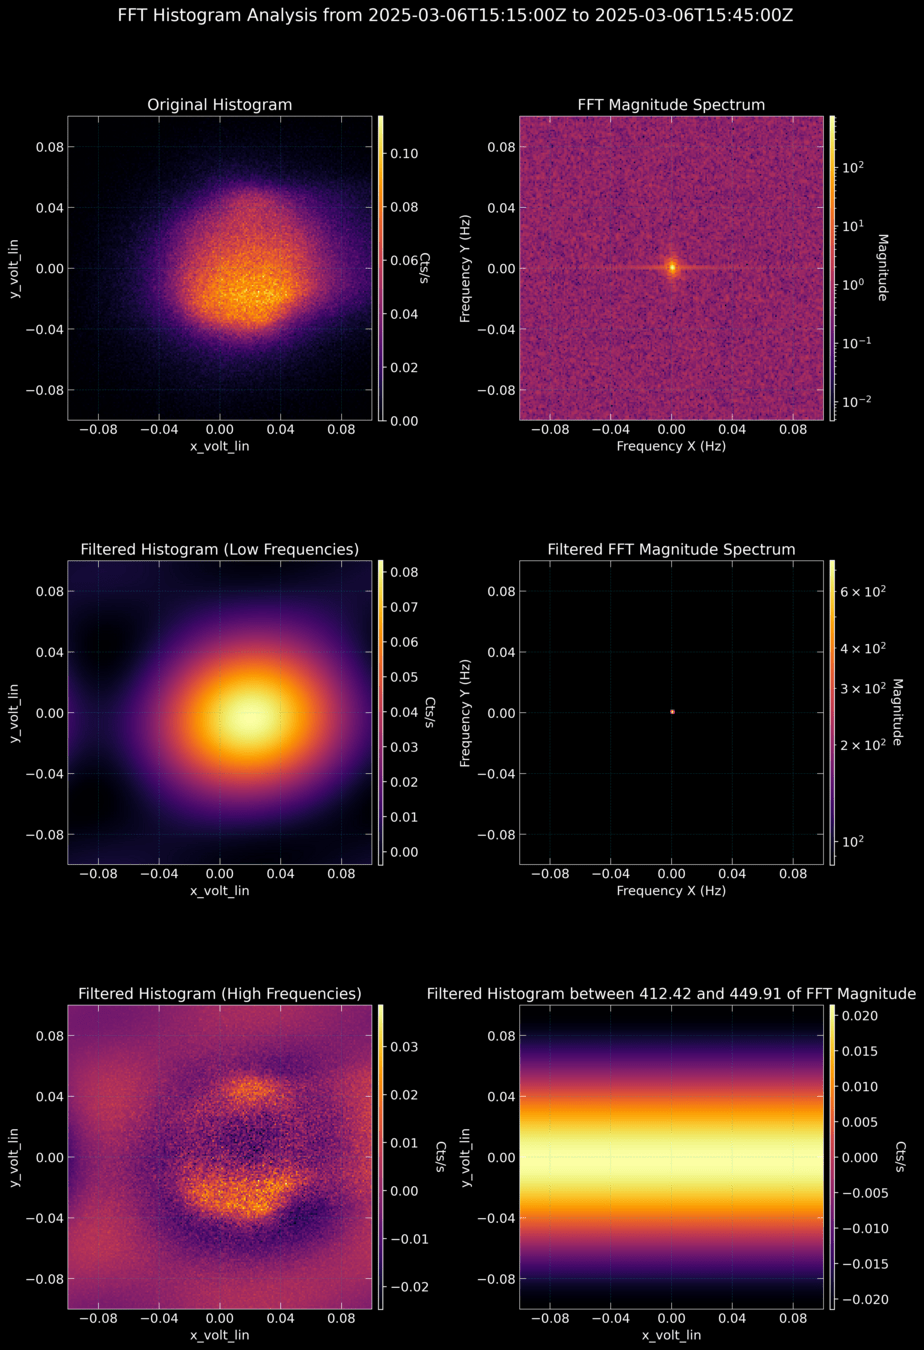
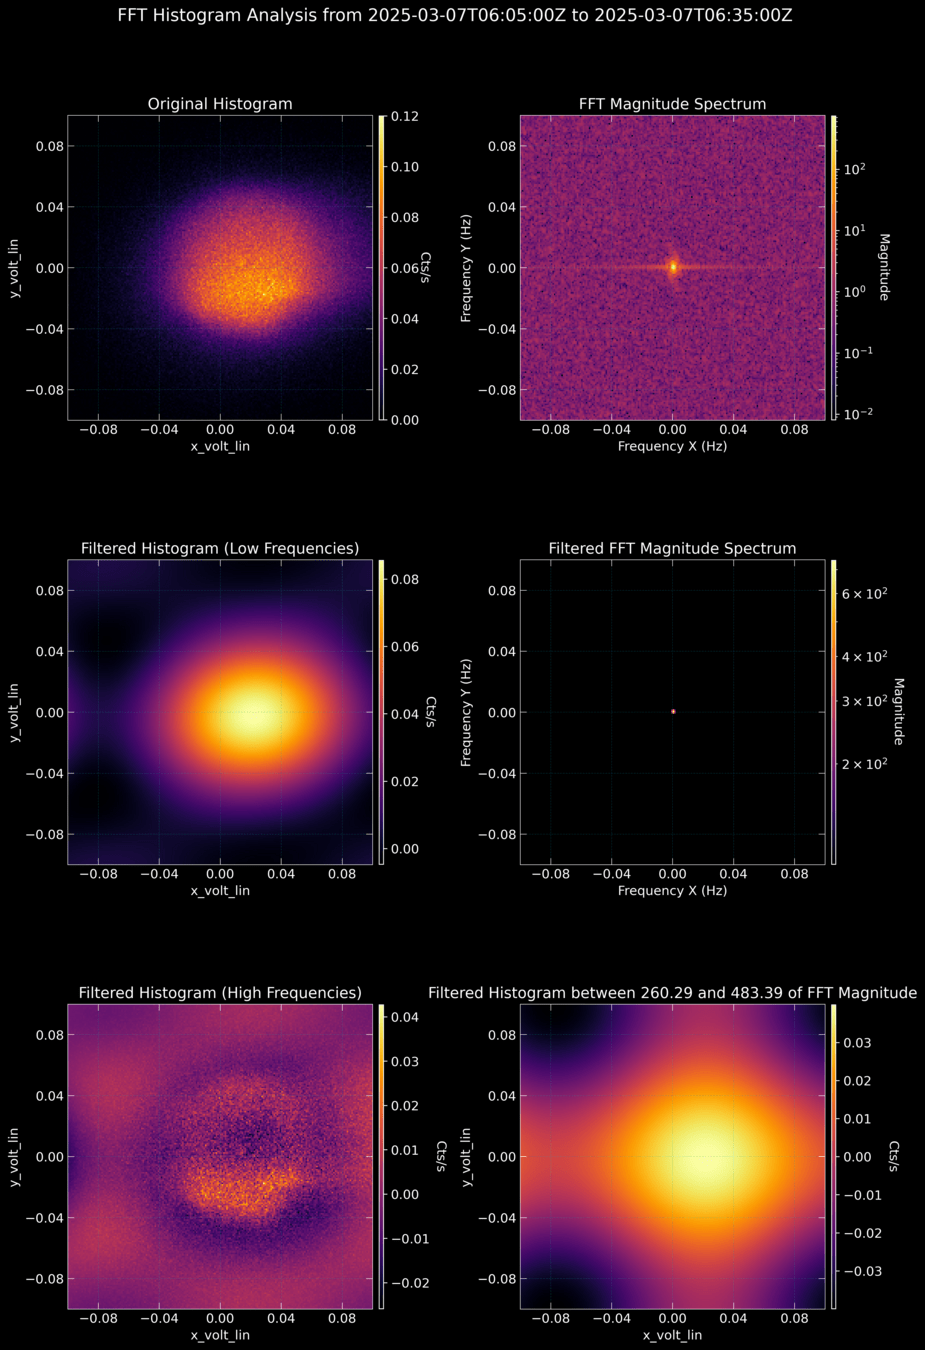
Histogram FFT analysis
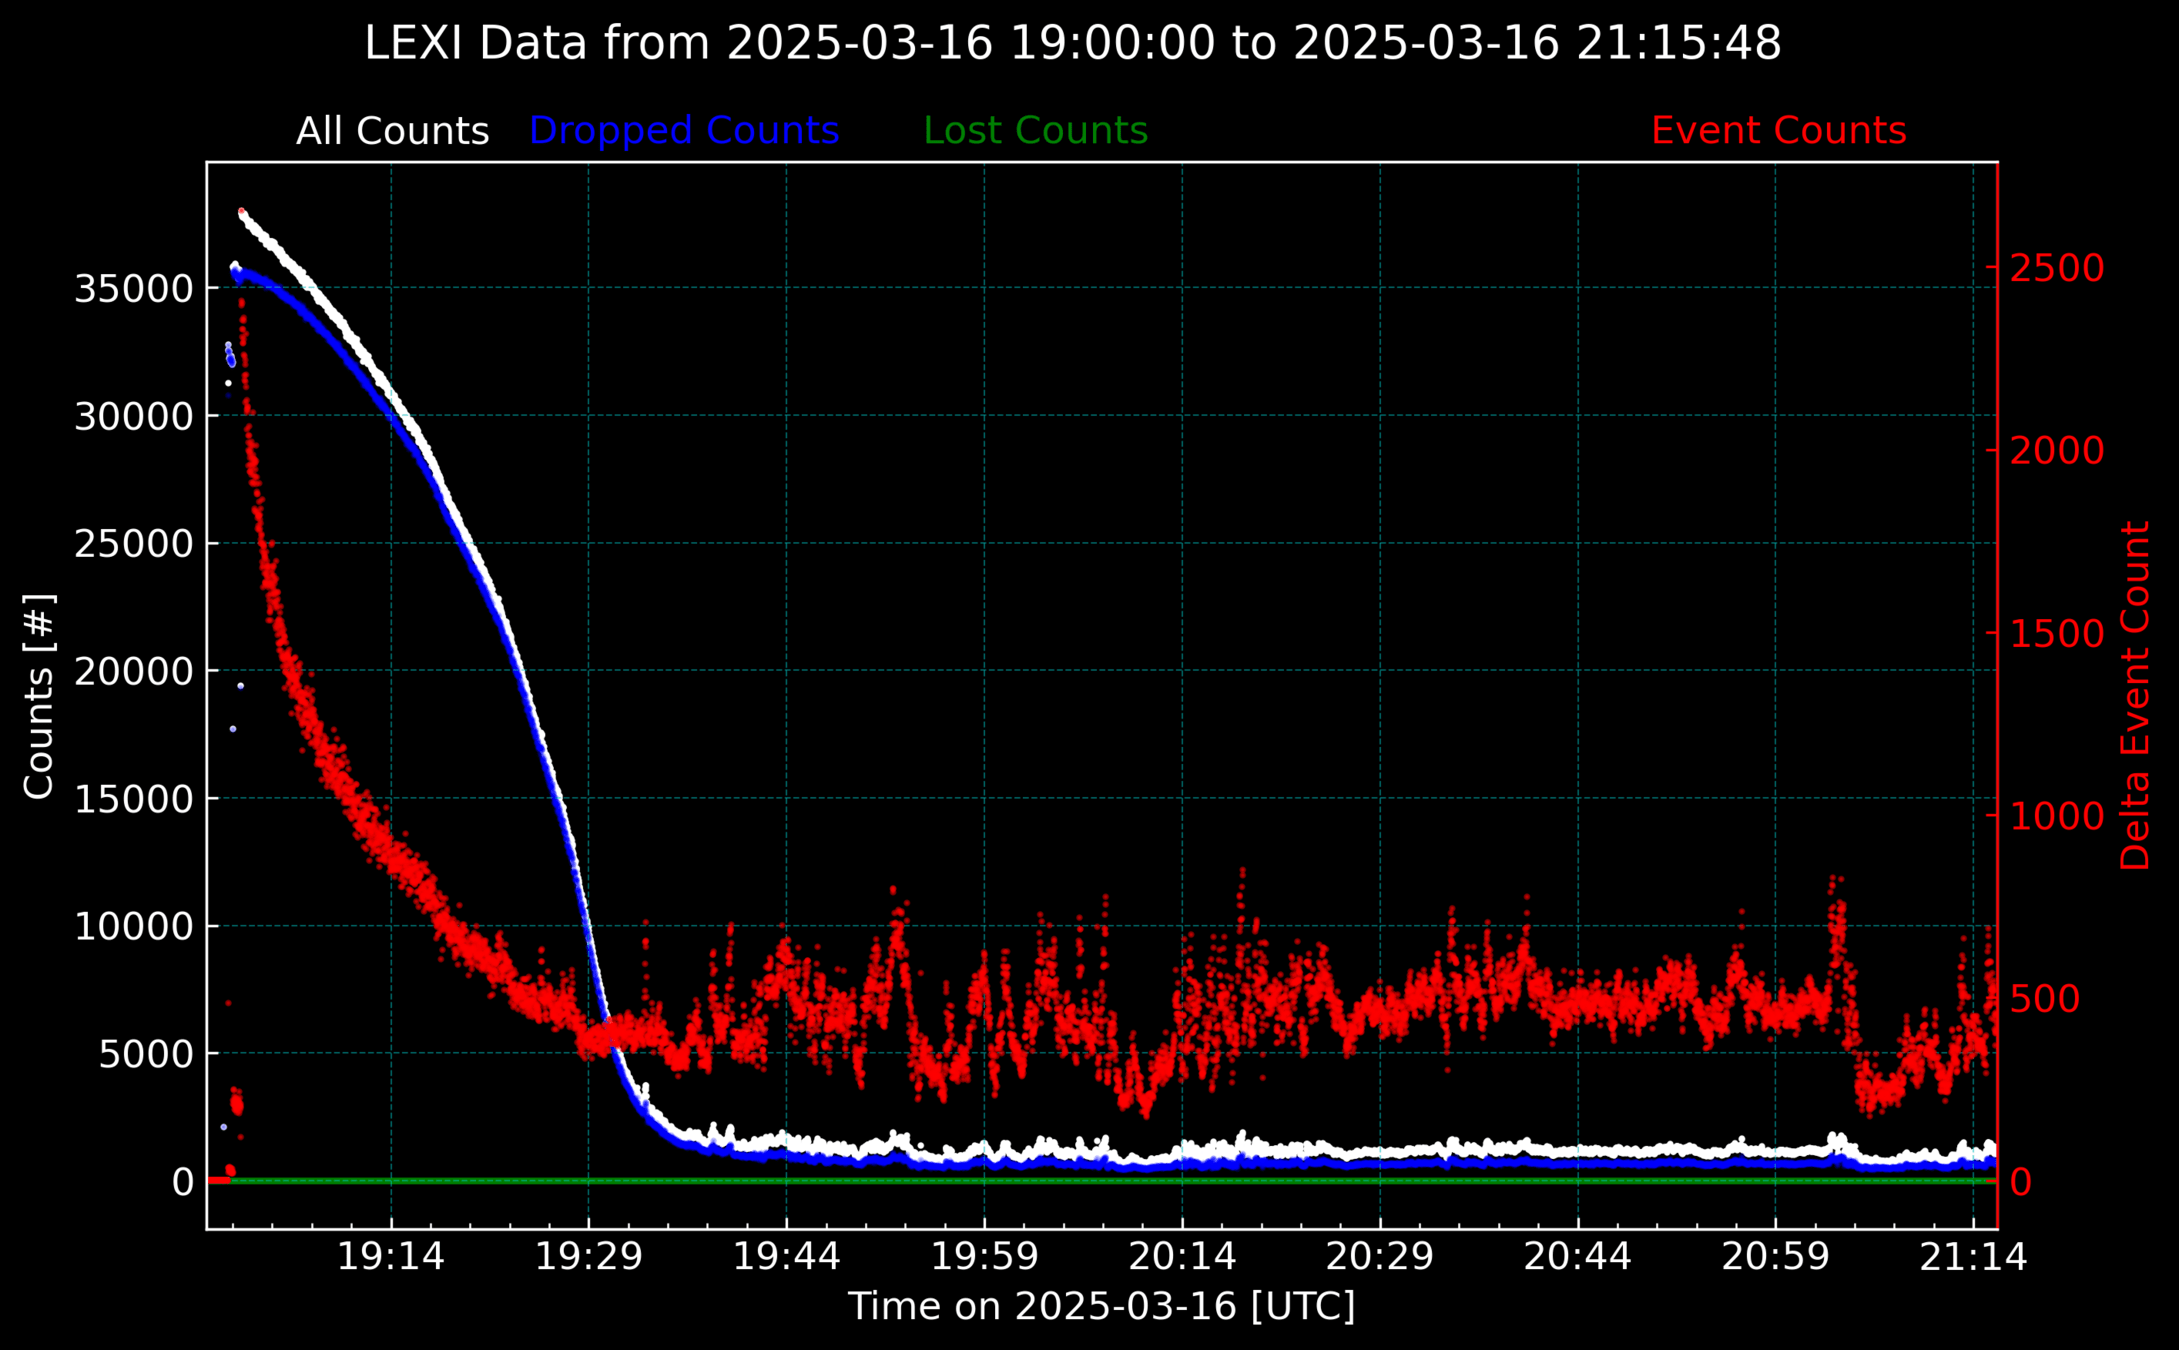
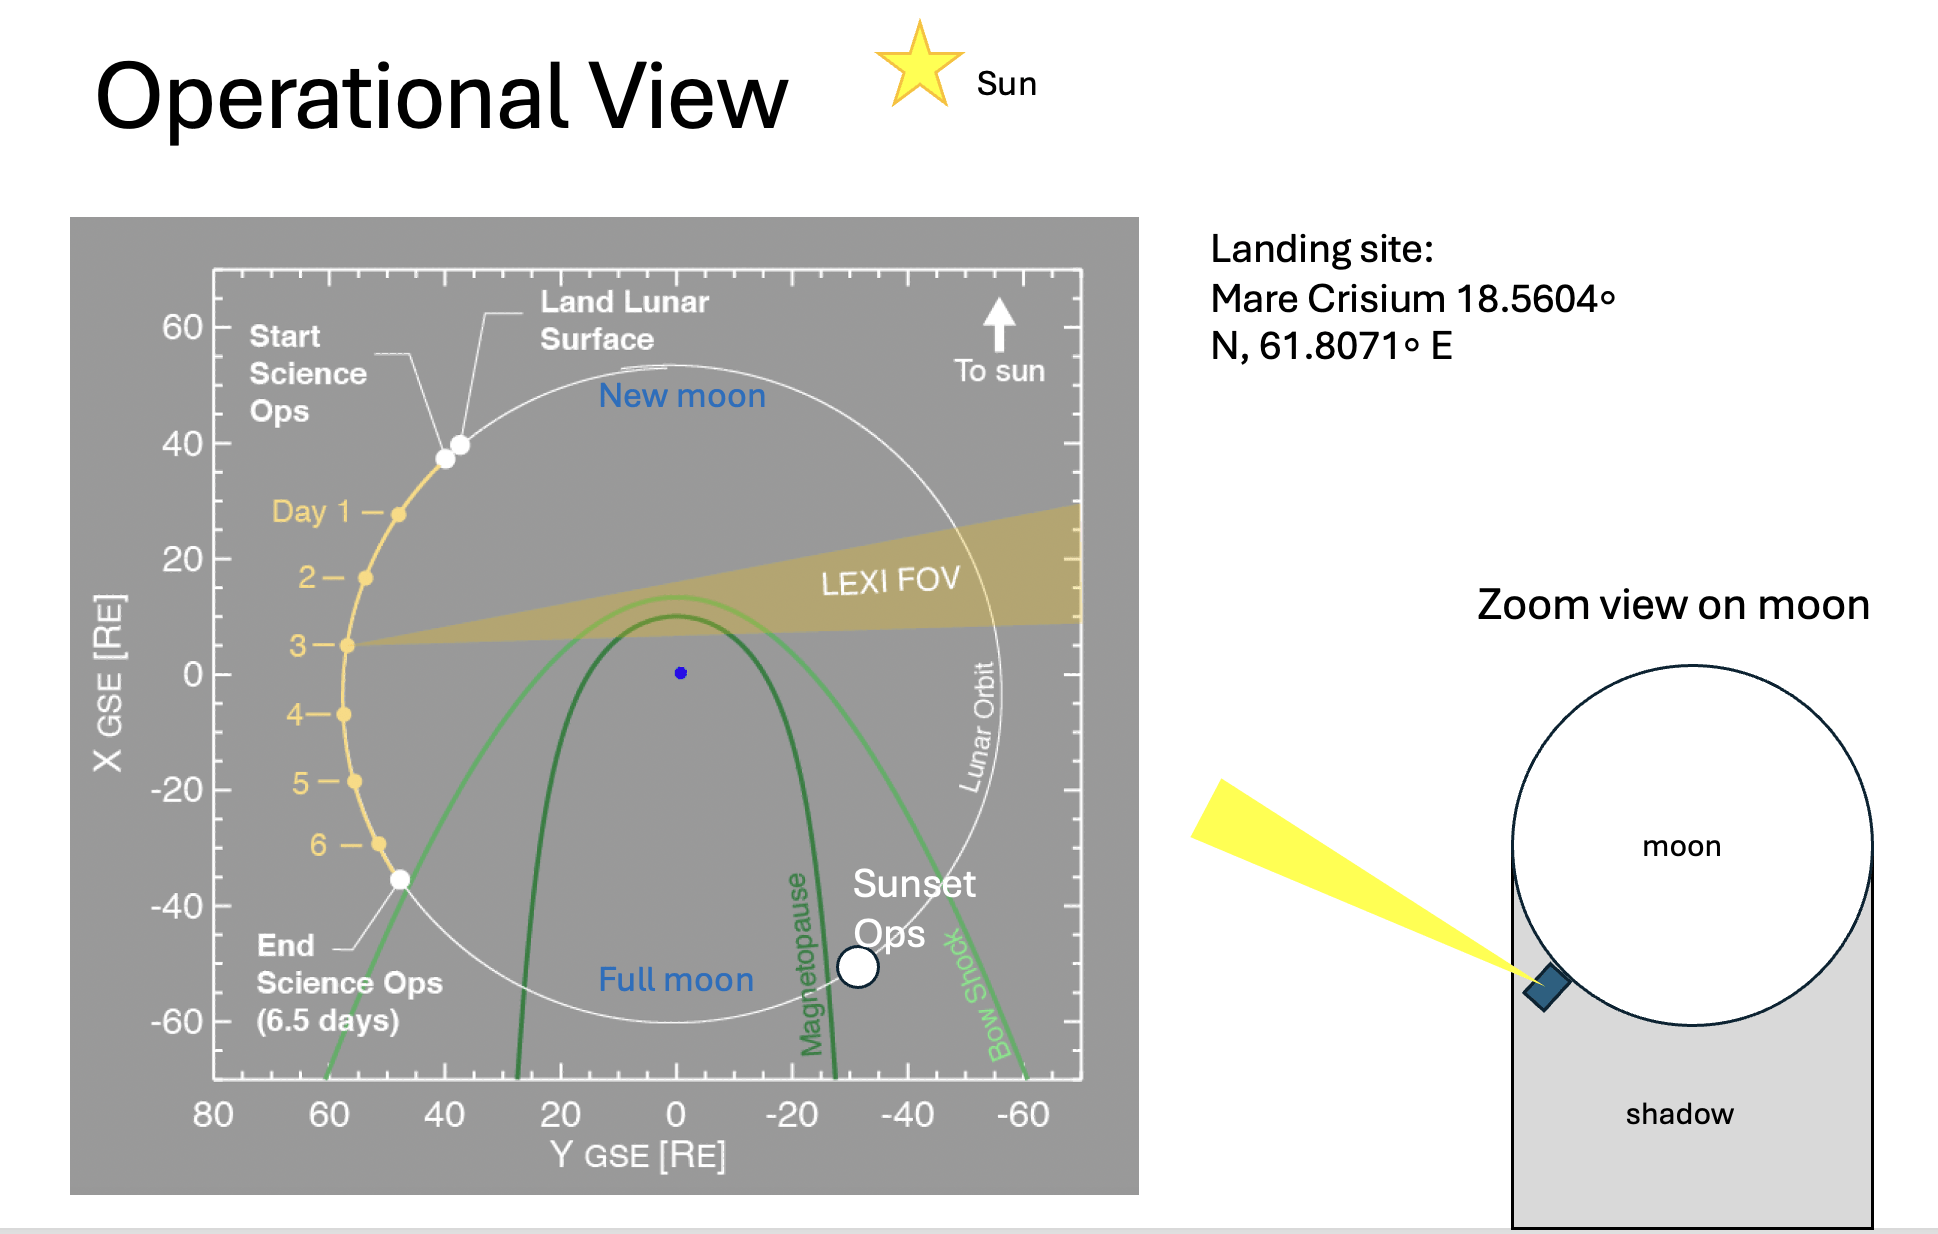
Analysis of post sun set data
Analysis of post sun set data
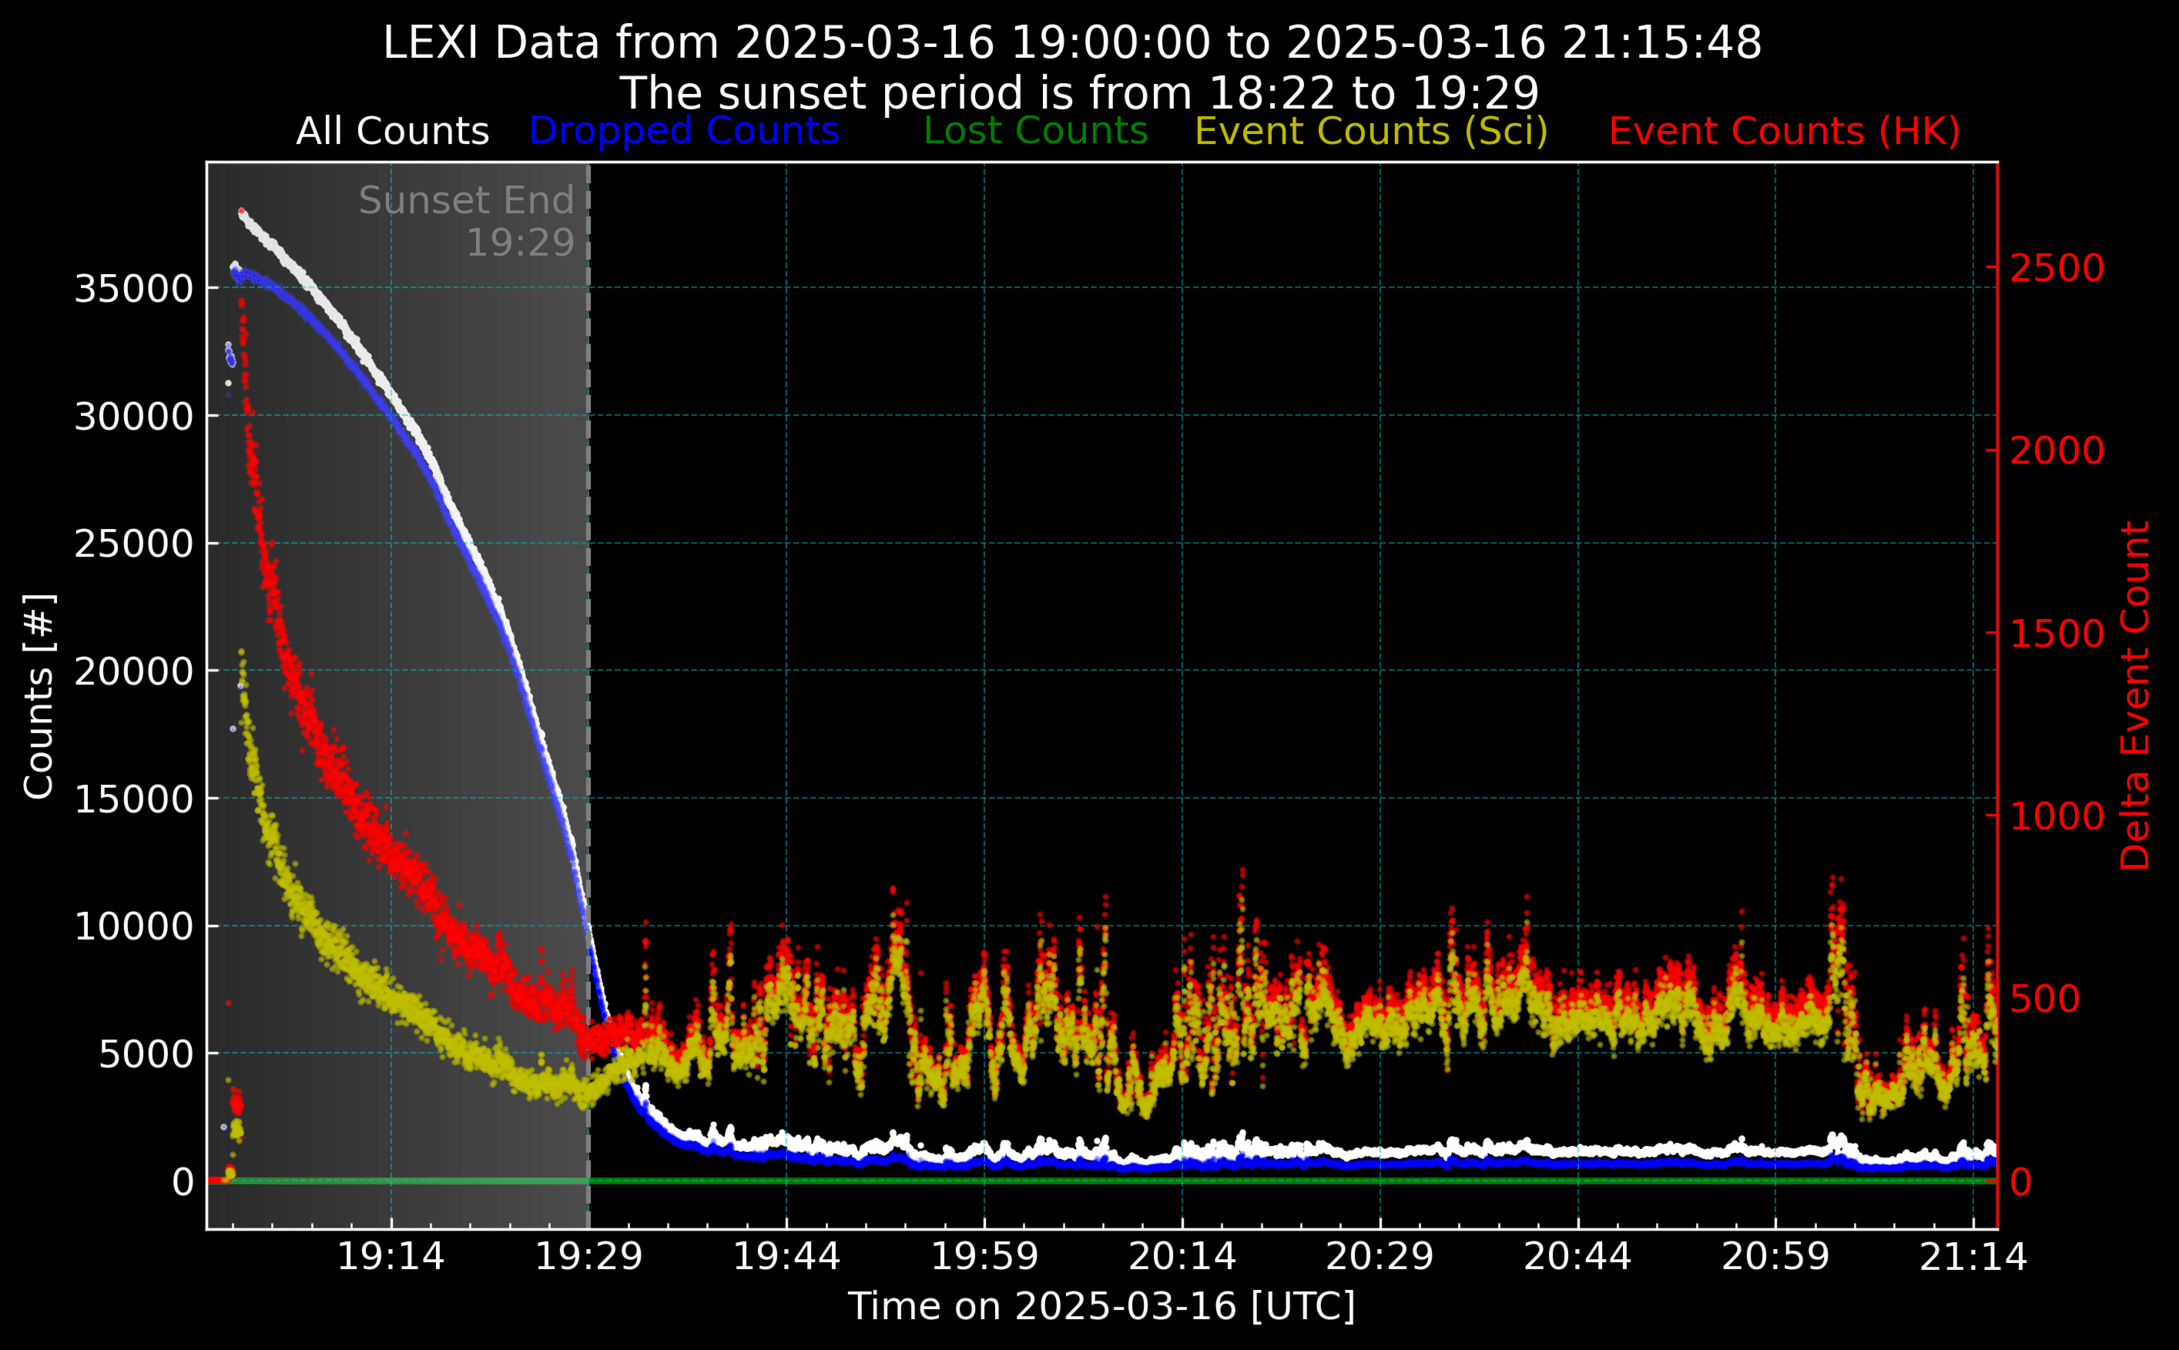
Post sun-set Data
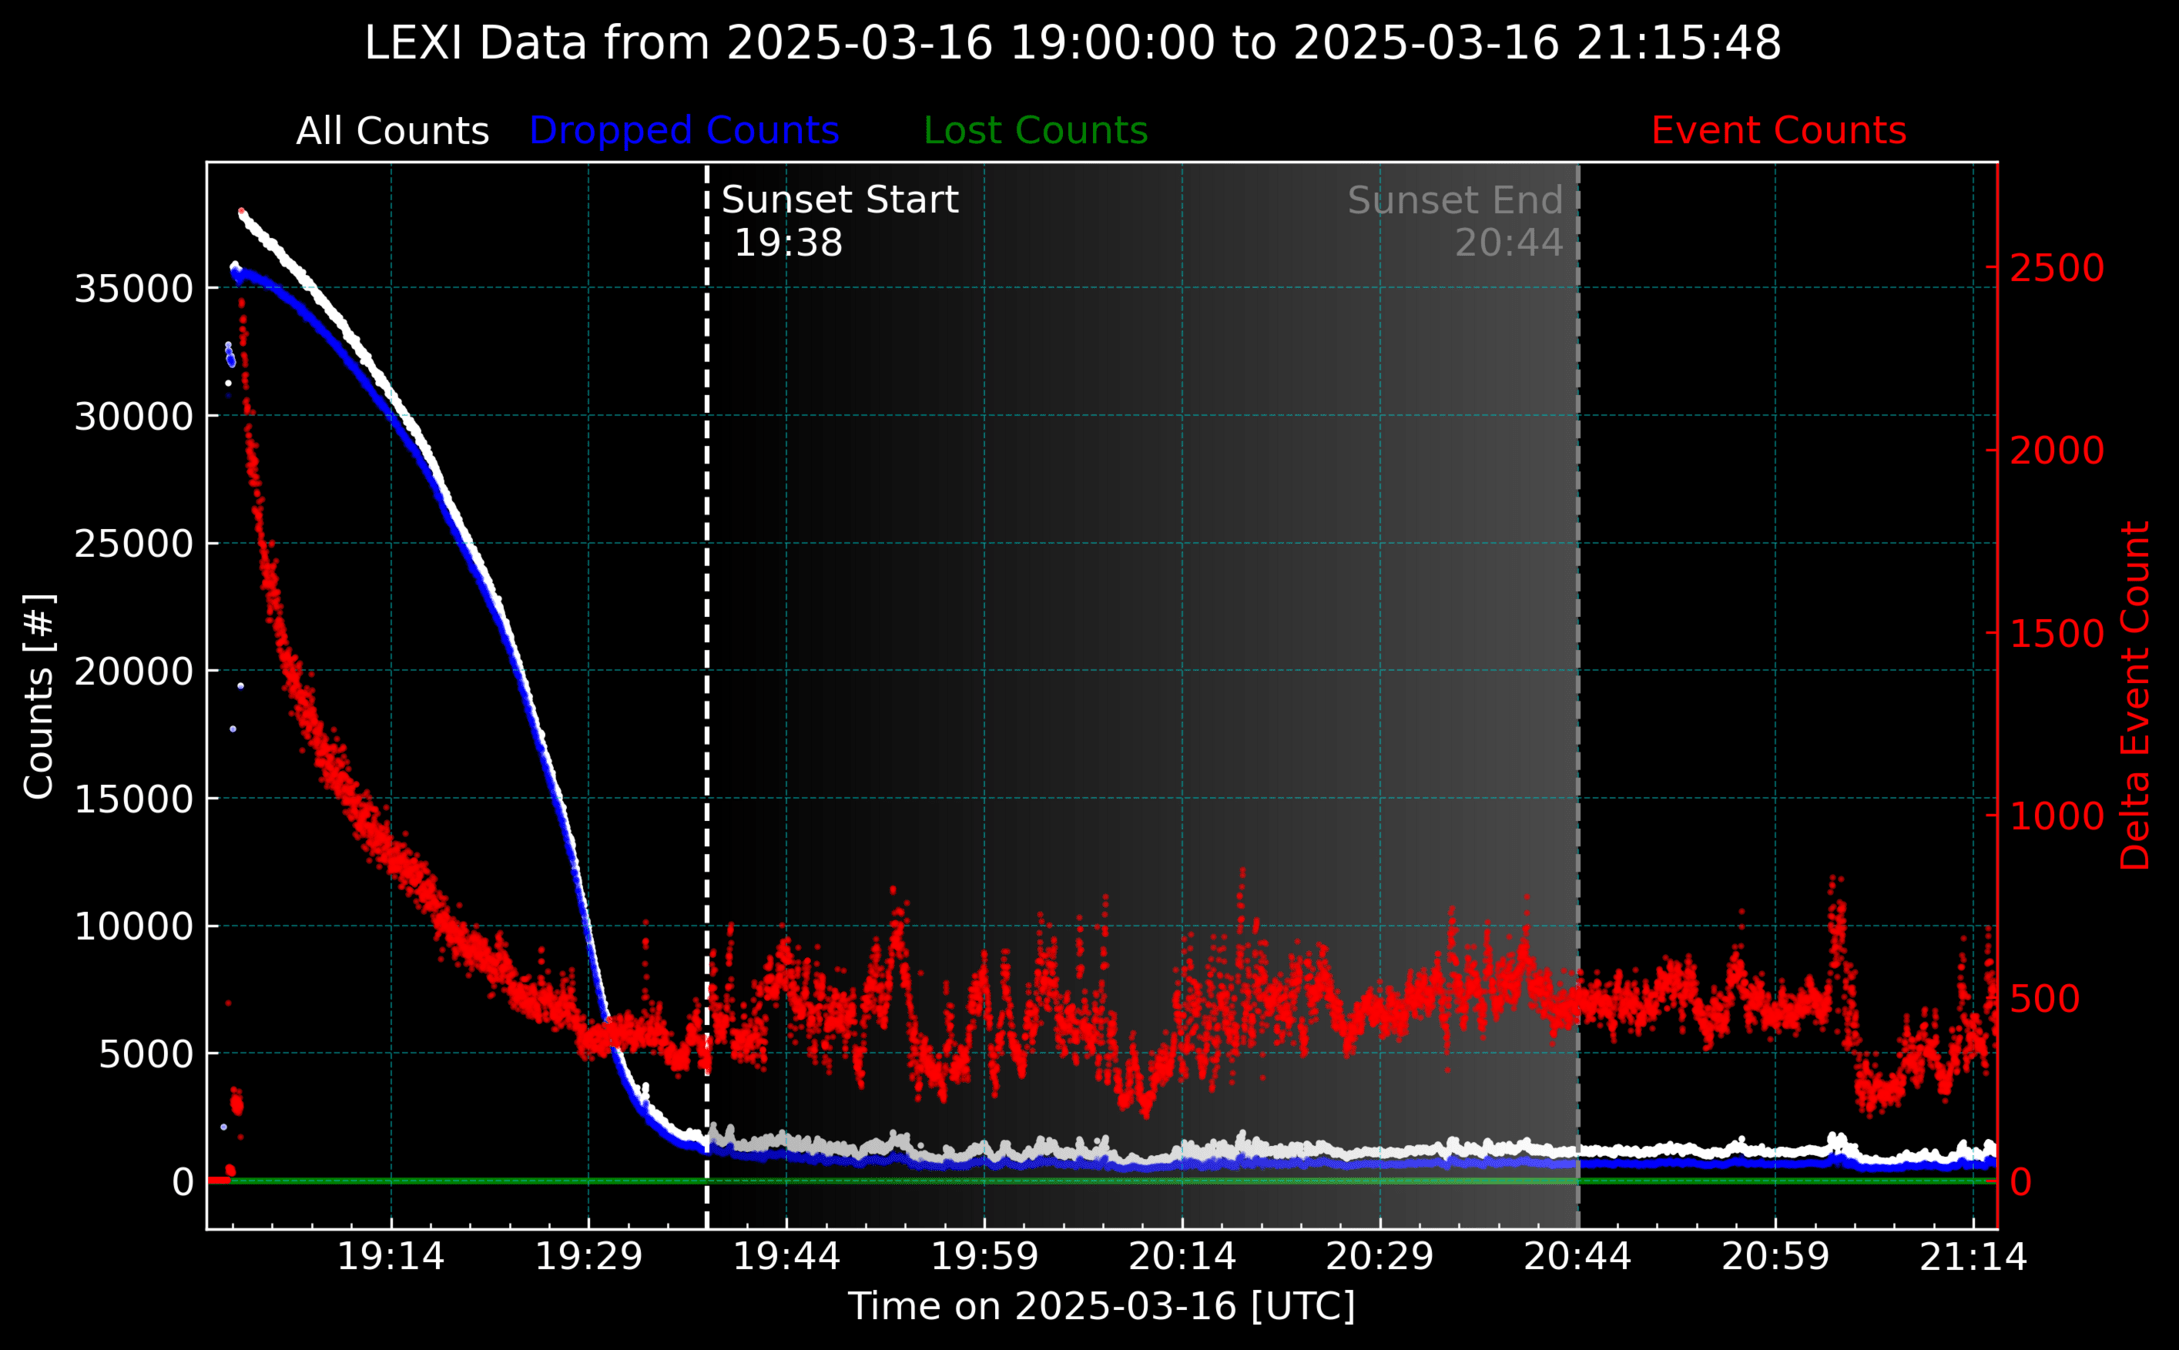
Analysis of post sun set data
Post sun-set Data
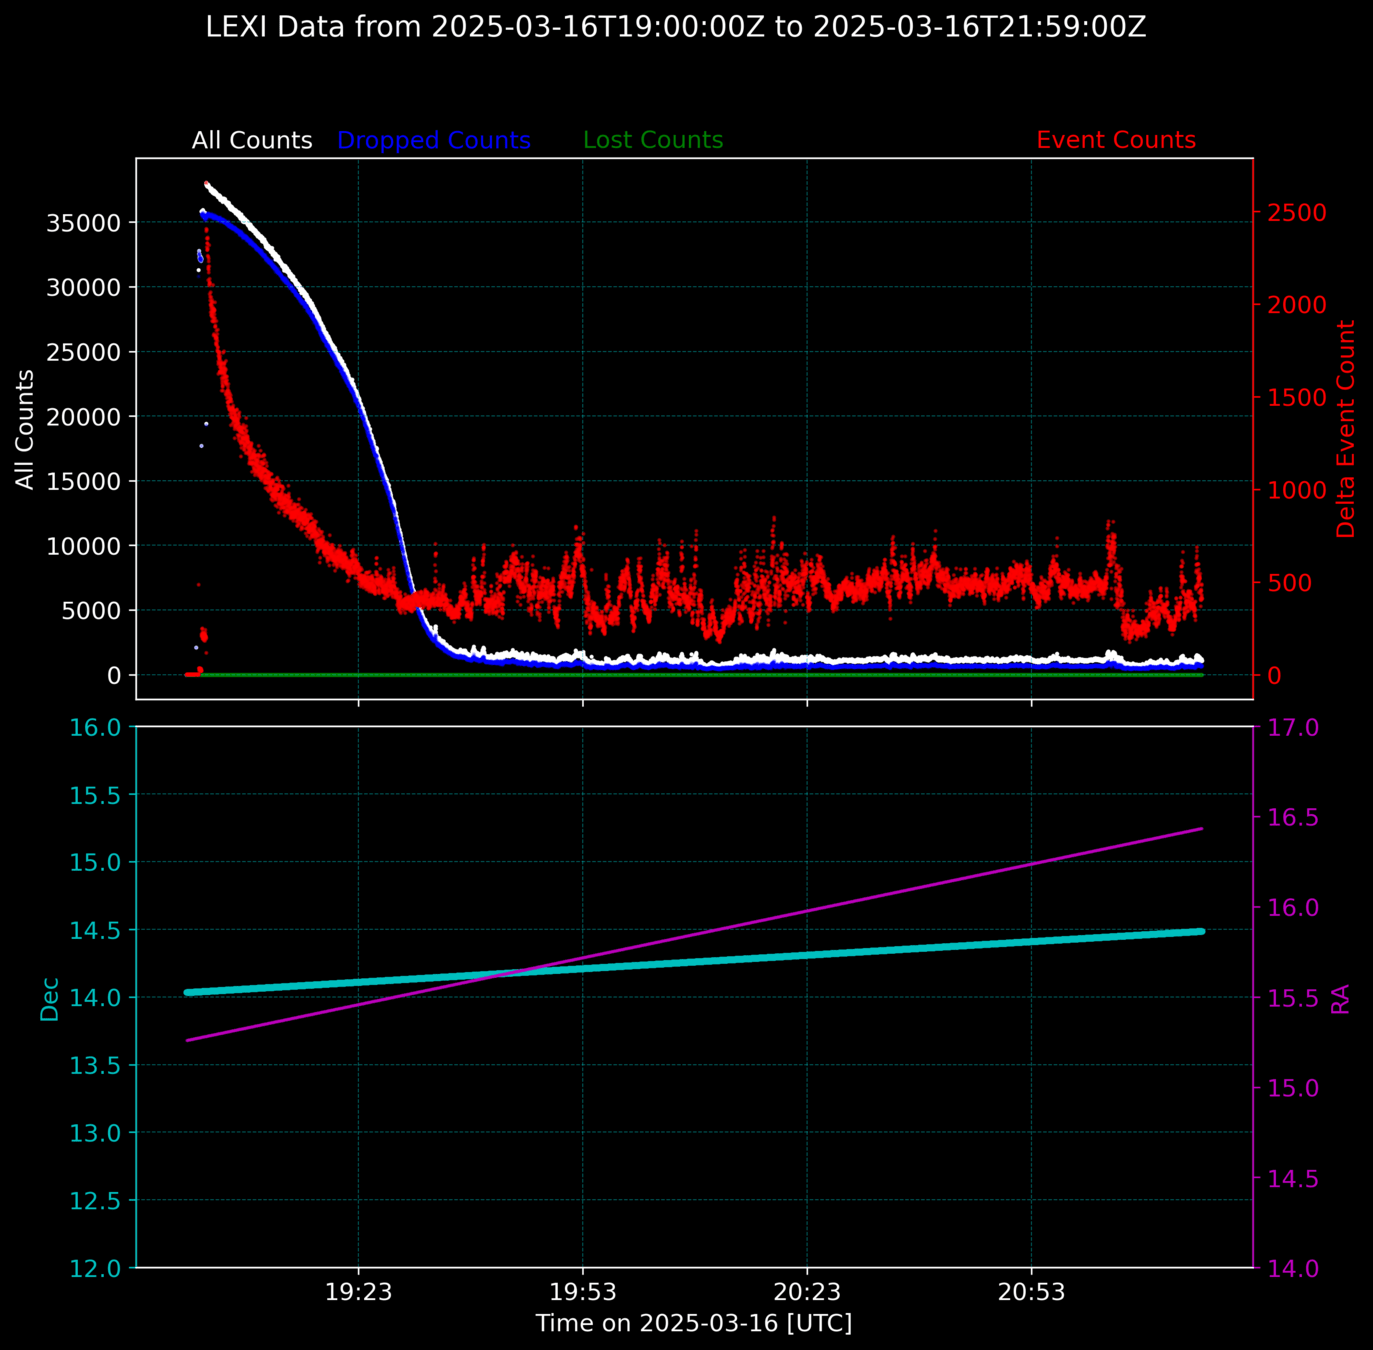
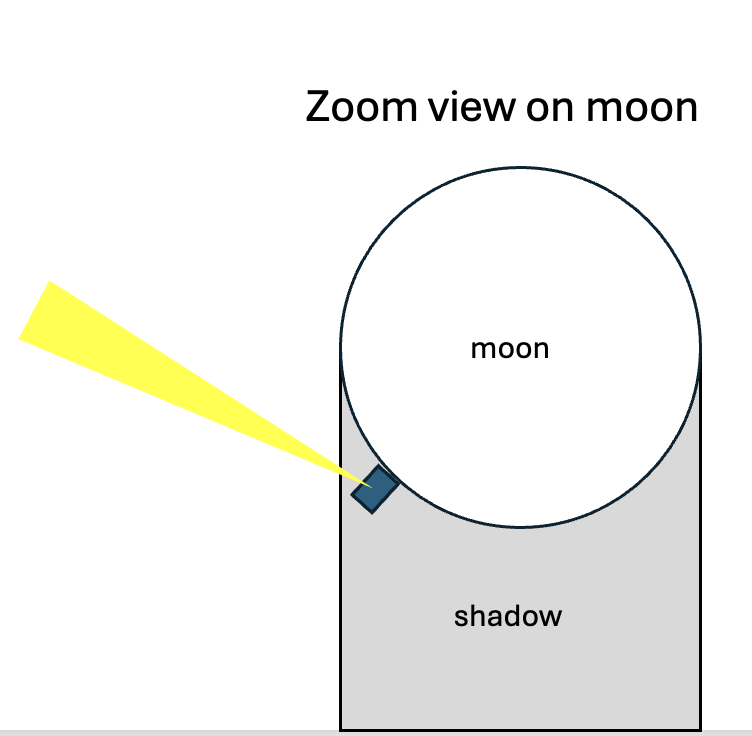
Analysis to see electron cloud distribution after sun-set.
Theory: There are a lot of electrons that are close to the surface of the moon. These electrons result in generation of x-ray.
Expected Observation: We should see a gradient in the LEXI images with highest value closest to the surface.
Analysis: We compute the sum of histogram values along different lines (explained in the next slide) and check for gradient.
Result: Inconclusive result. More analysis needed.
/s
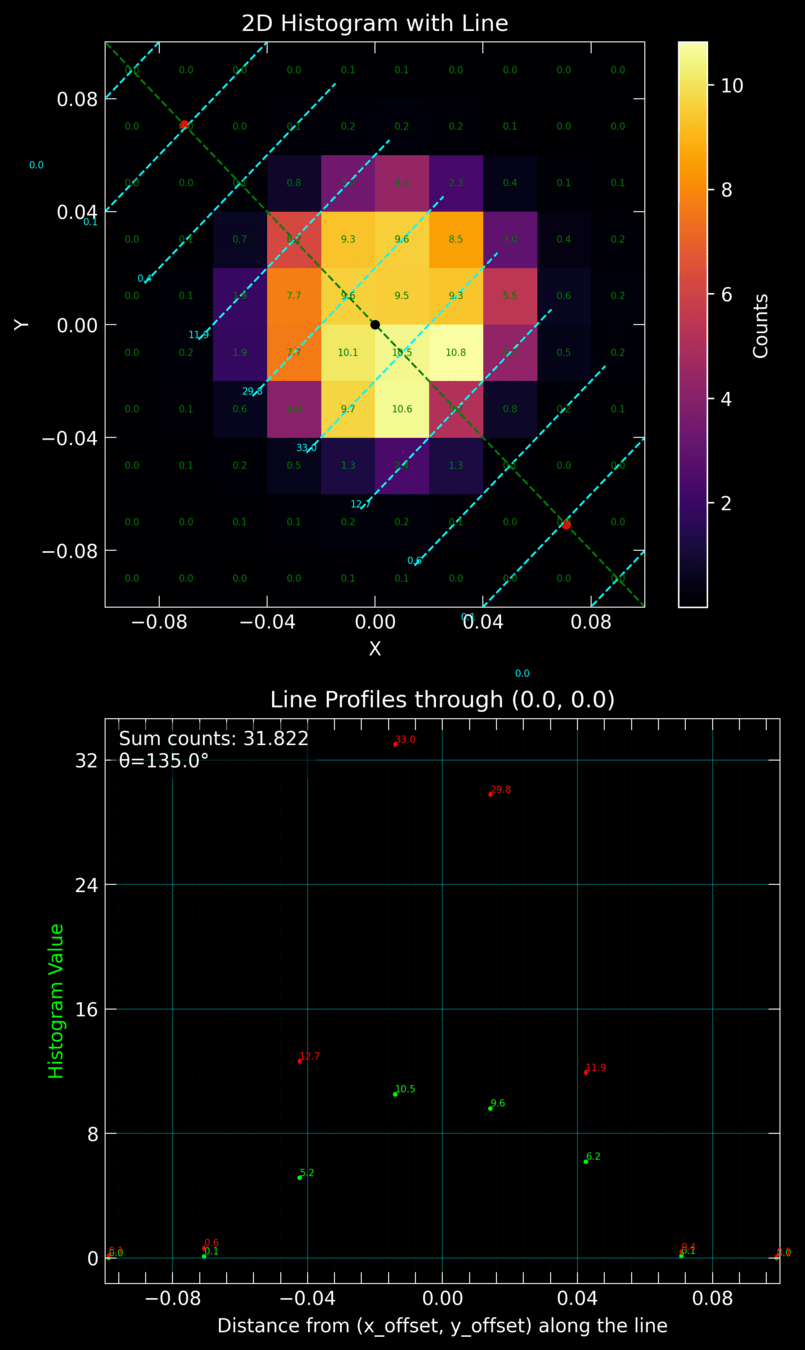
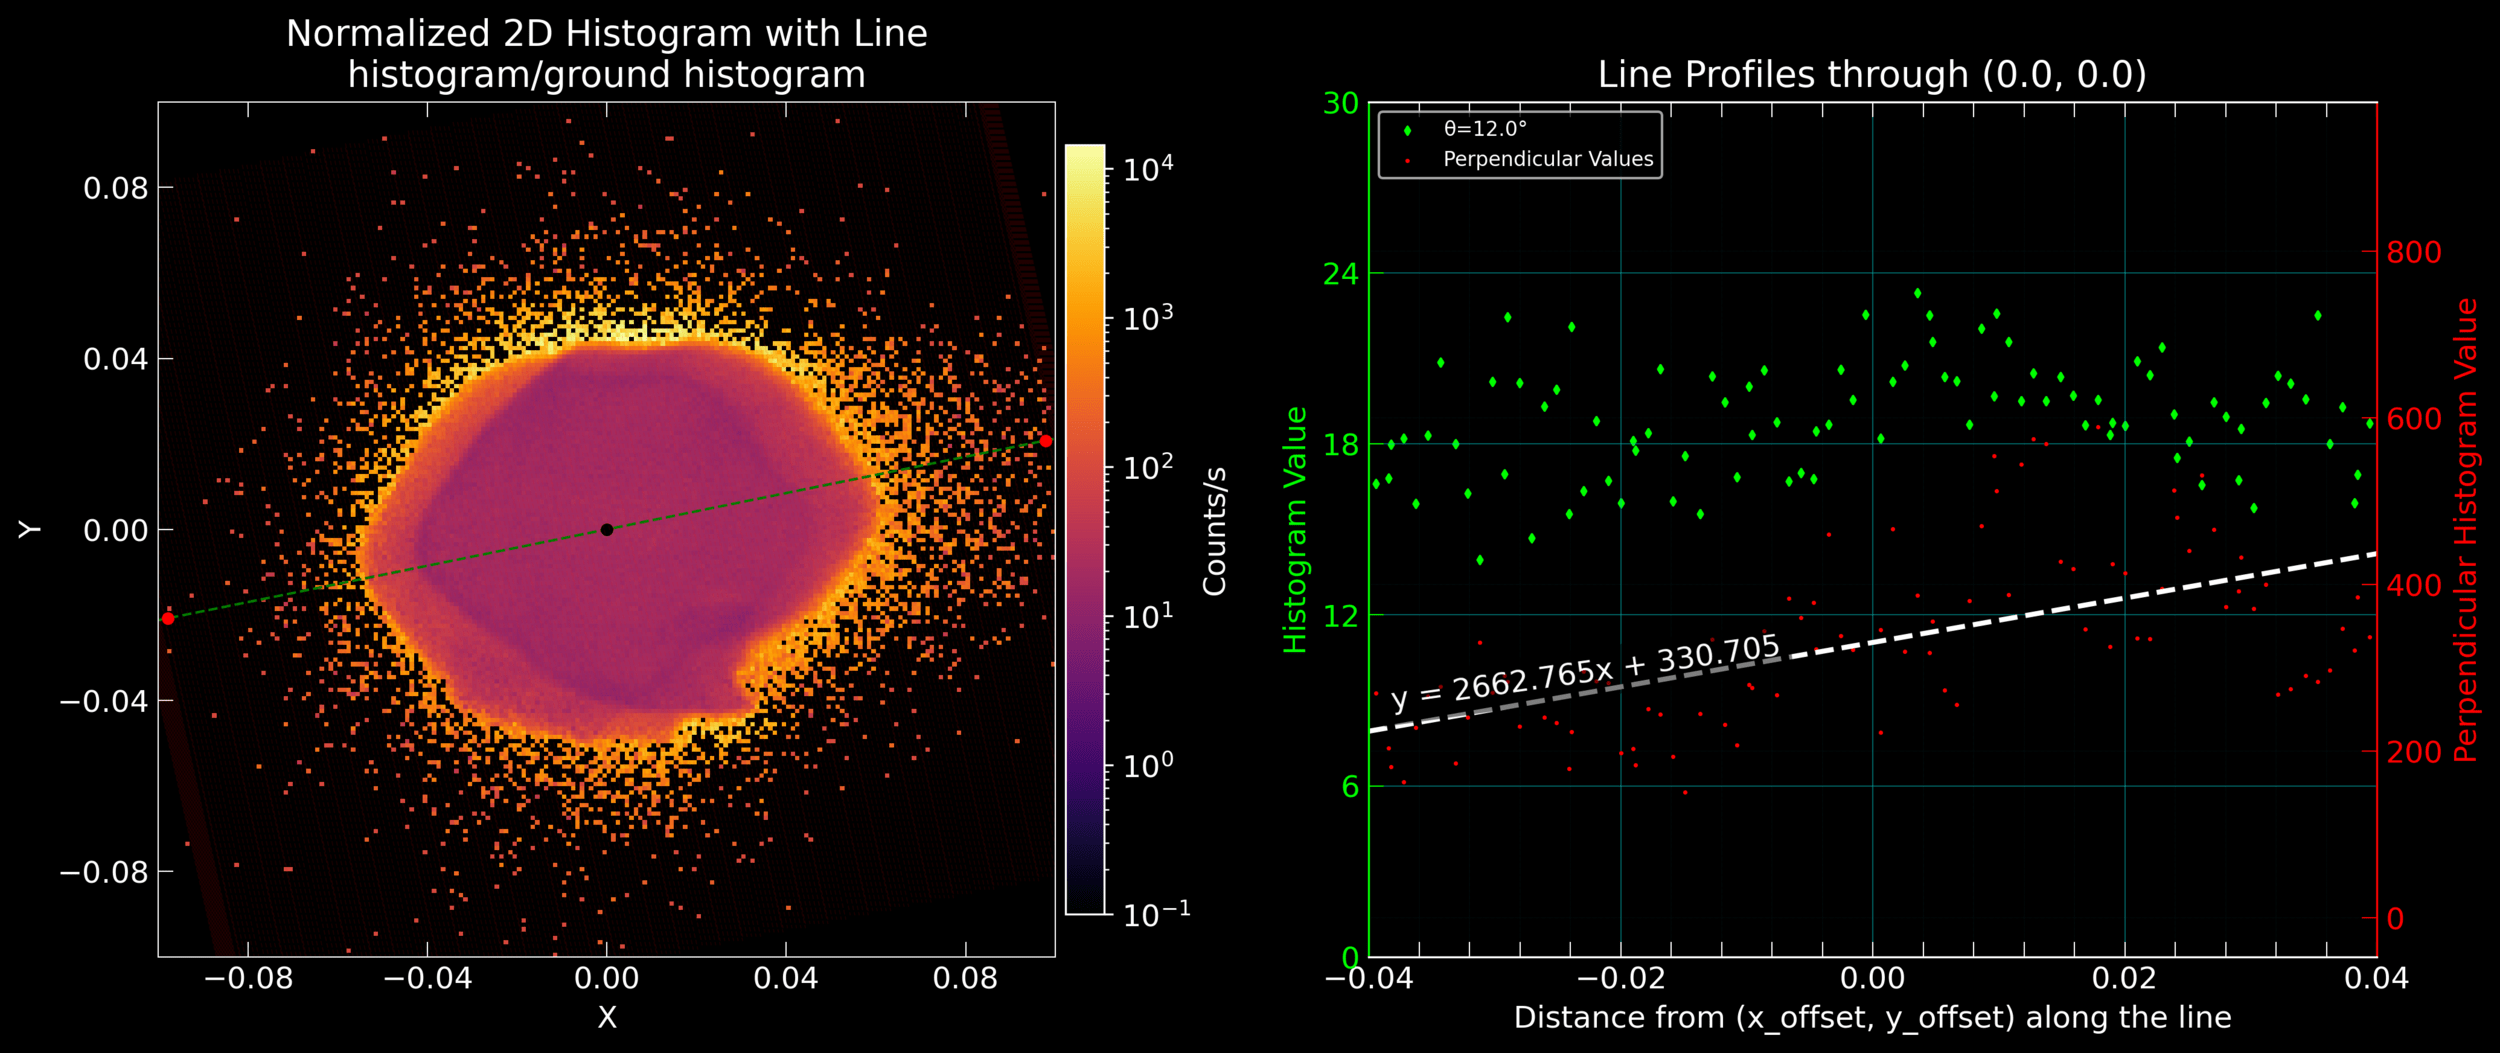
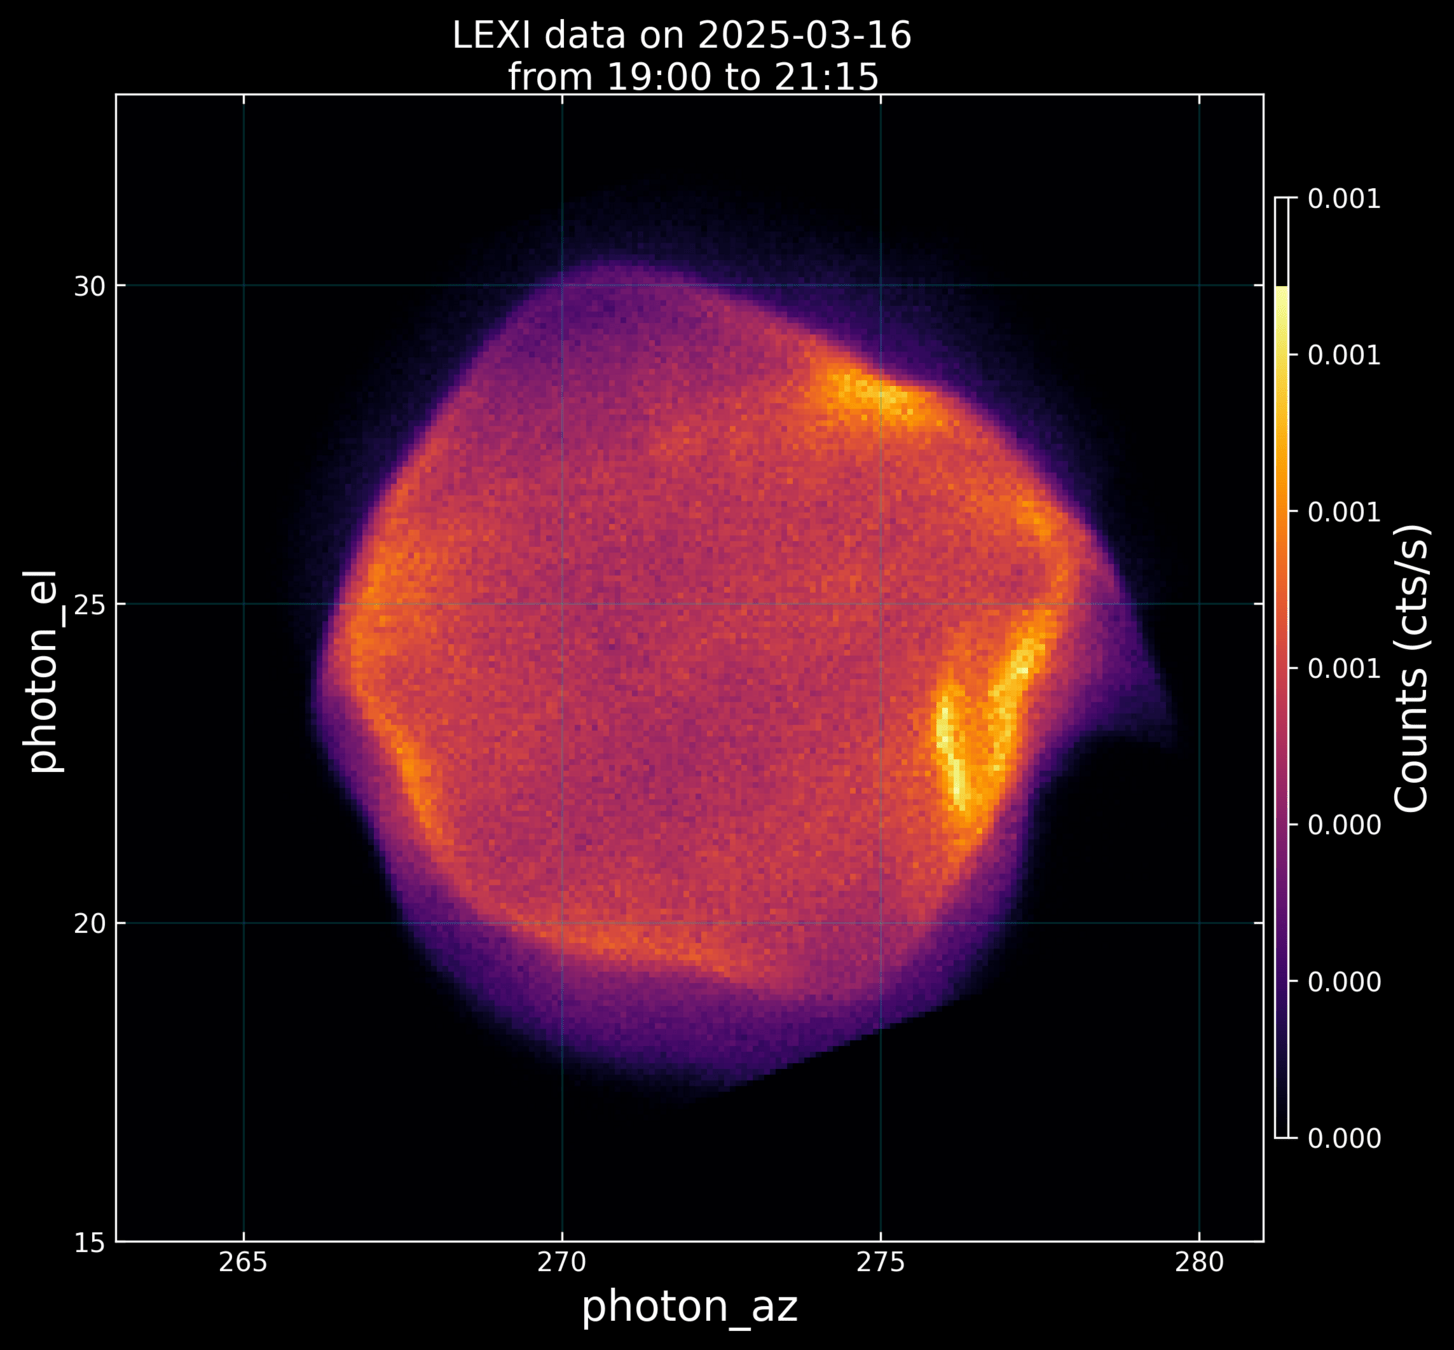
LEXI sample image/histogram.
The histogram value (counts/sec) of the bin
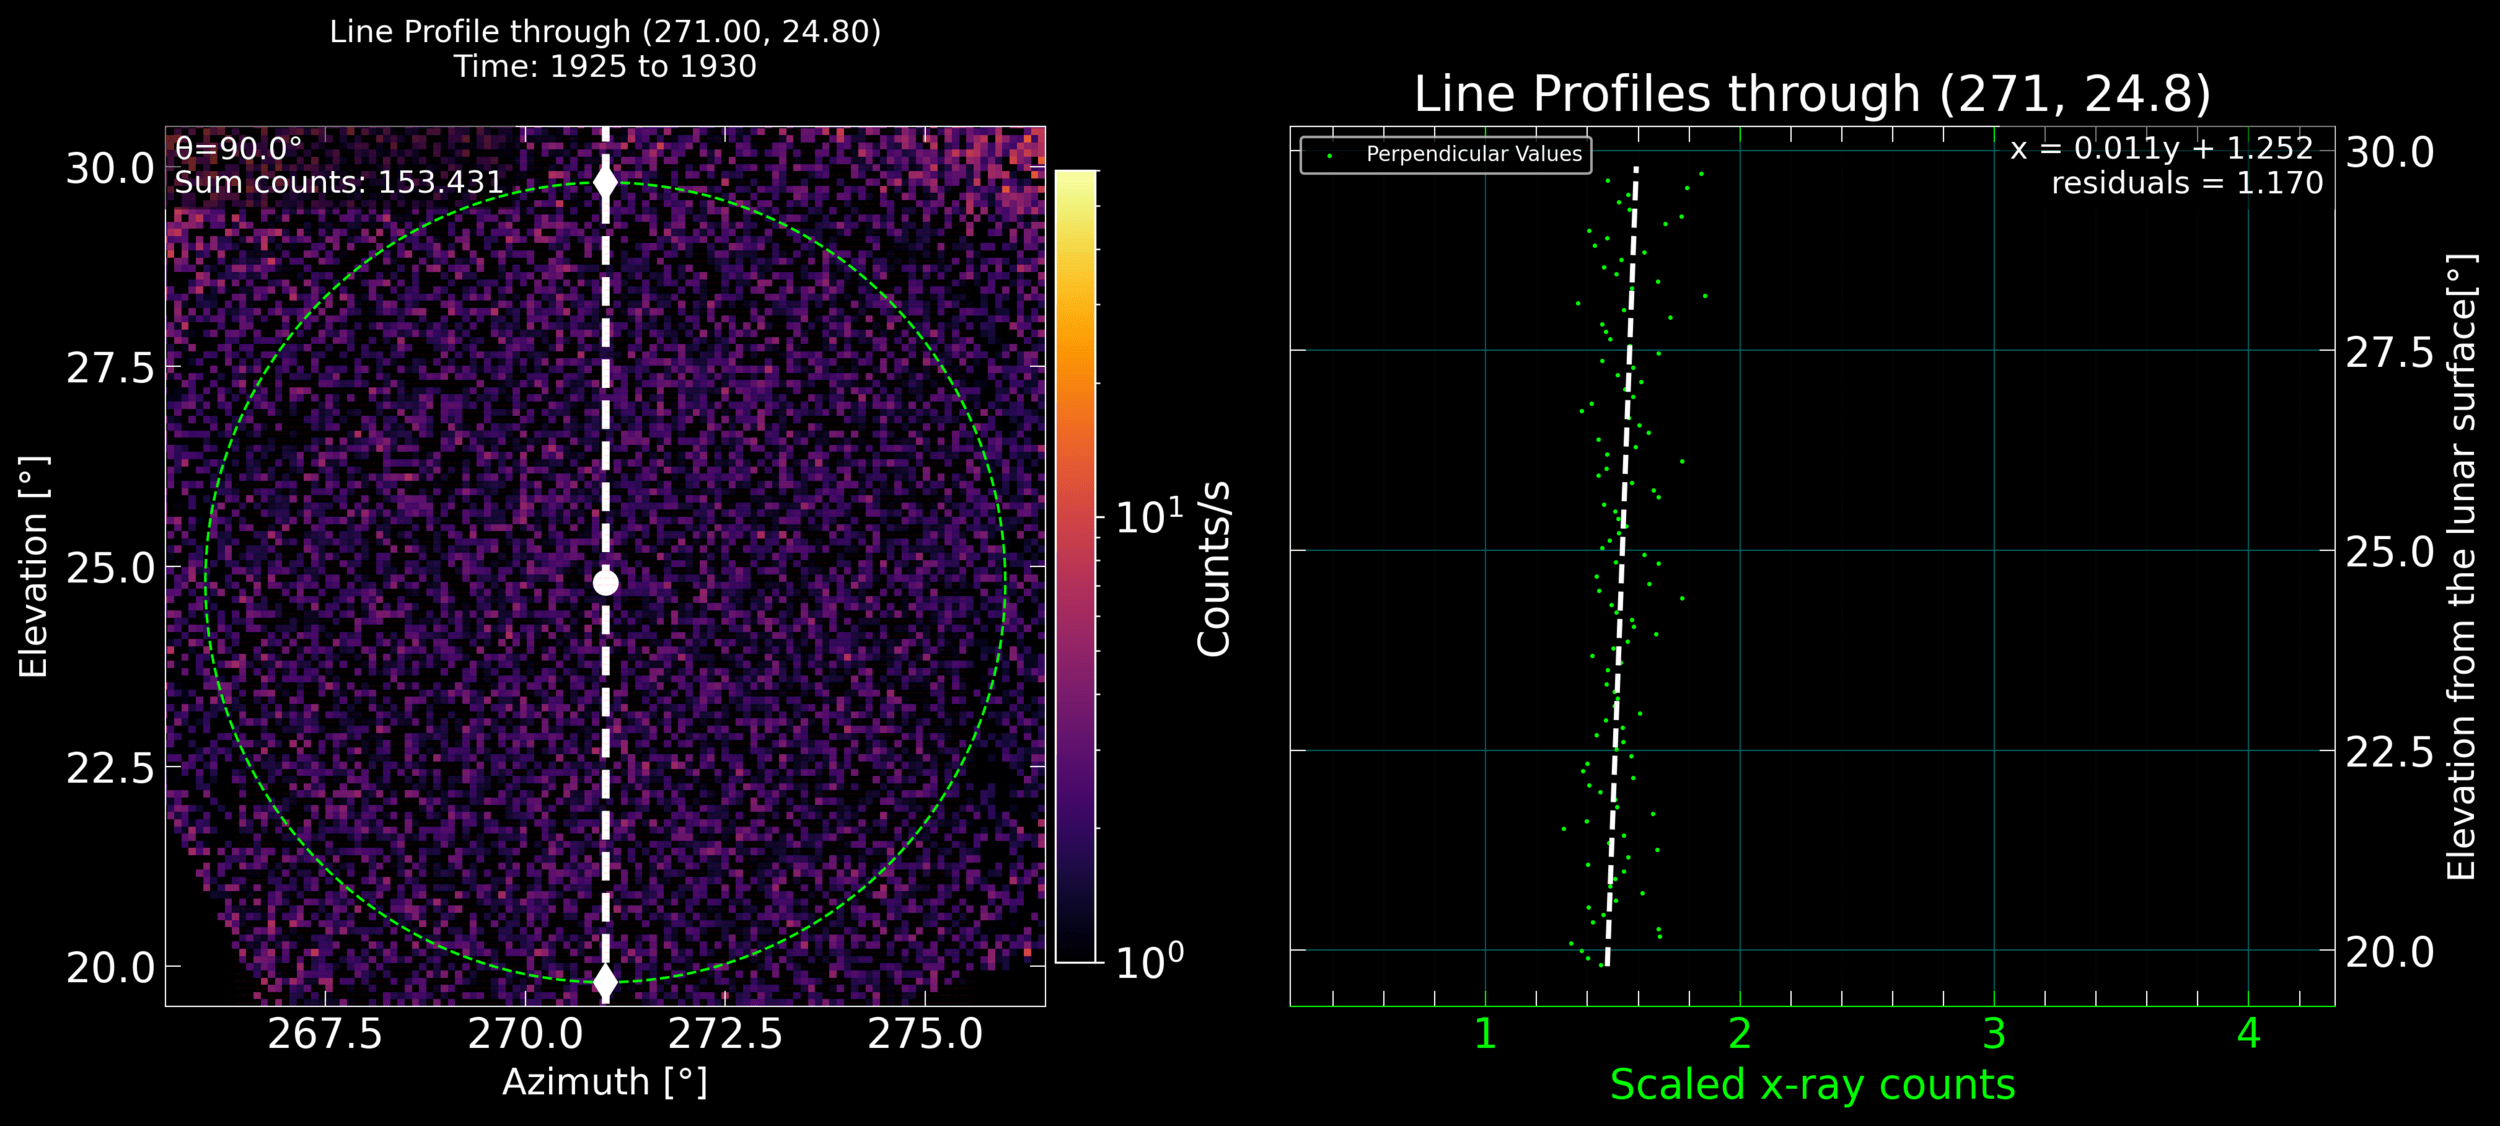
The perpendicular line along which the summation of all the bin values is carried out. The sum value is represented here. All the perpendicular lines have same length. And in the final version, the sum value is normalized against the number of bins along the line.
Line along which we are checking if there is a gradient present in the image
/s
LEXI sample image/histogram.
The values along perpendicular (cyan) lines
Sum values along the green line
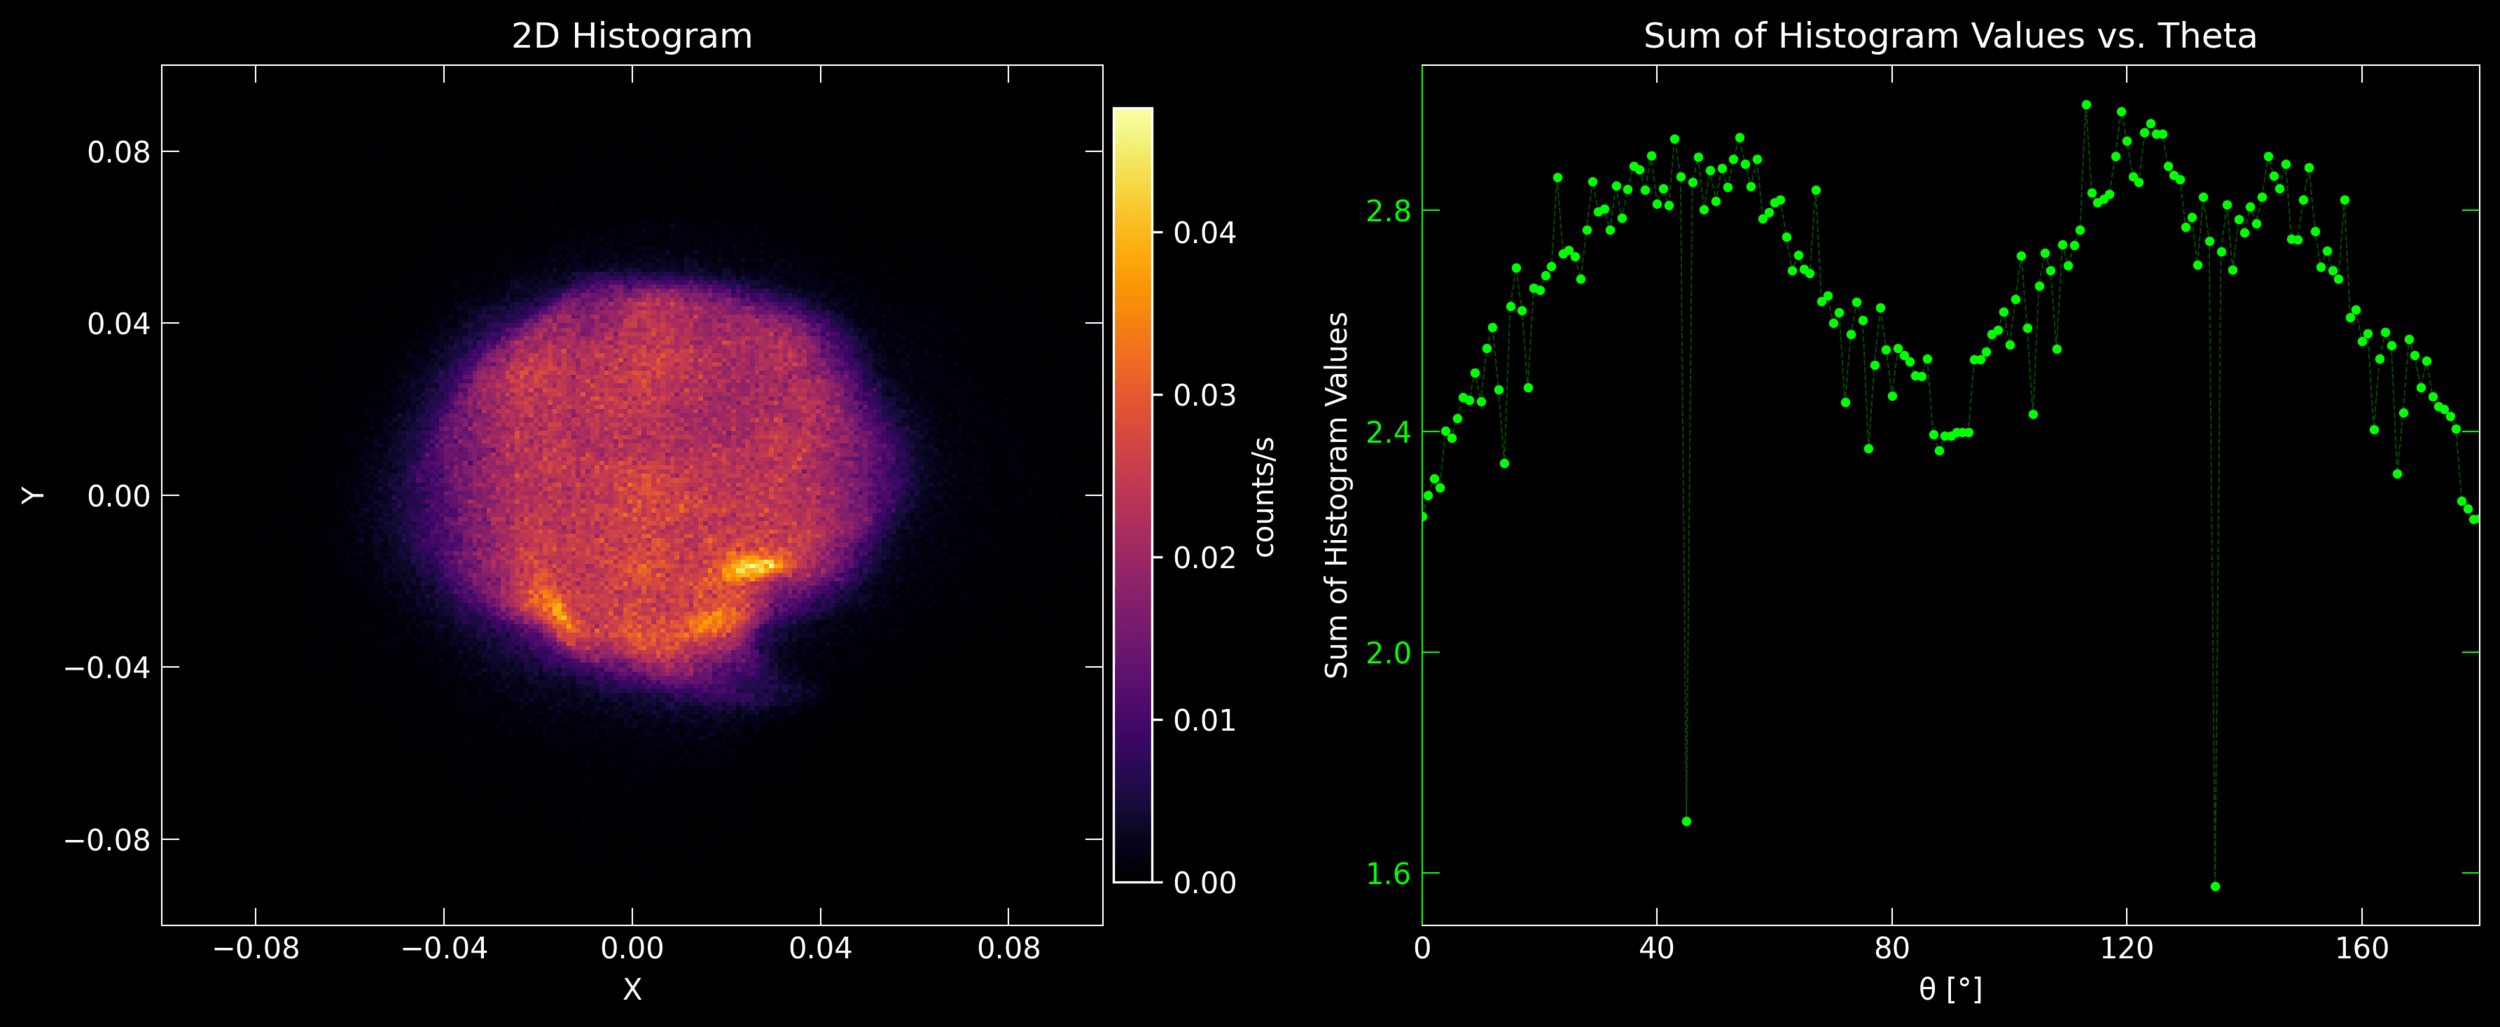
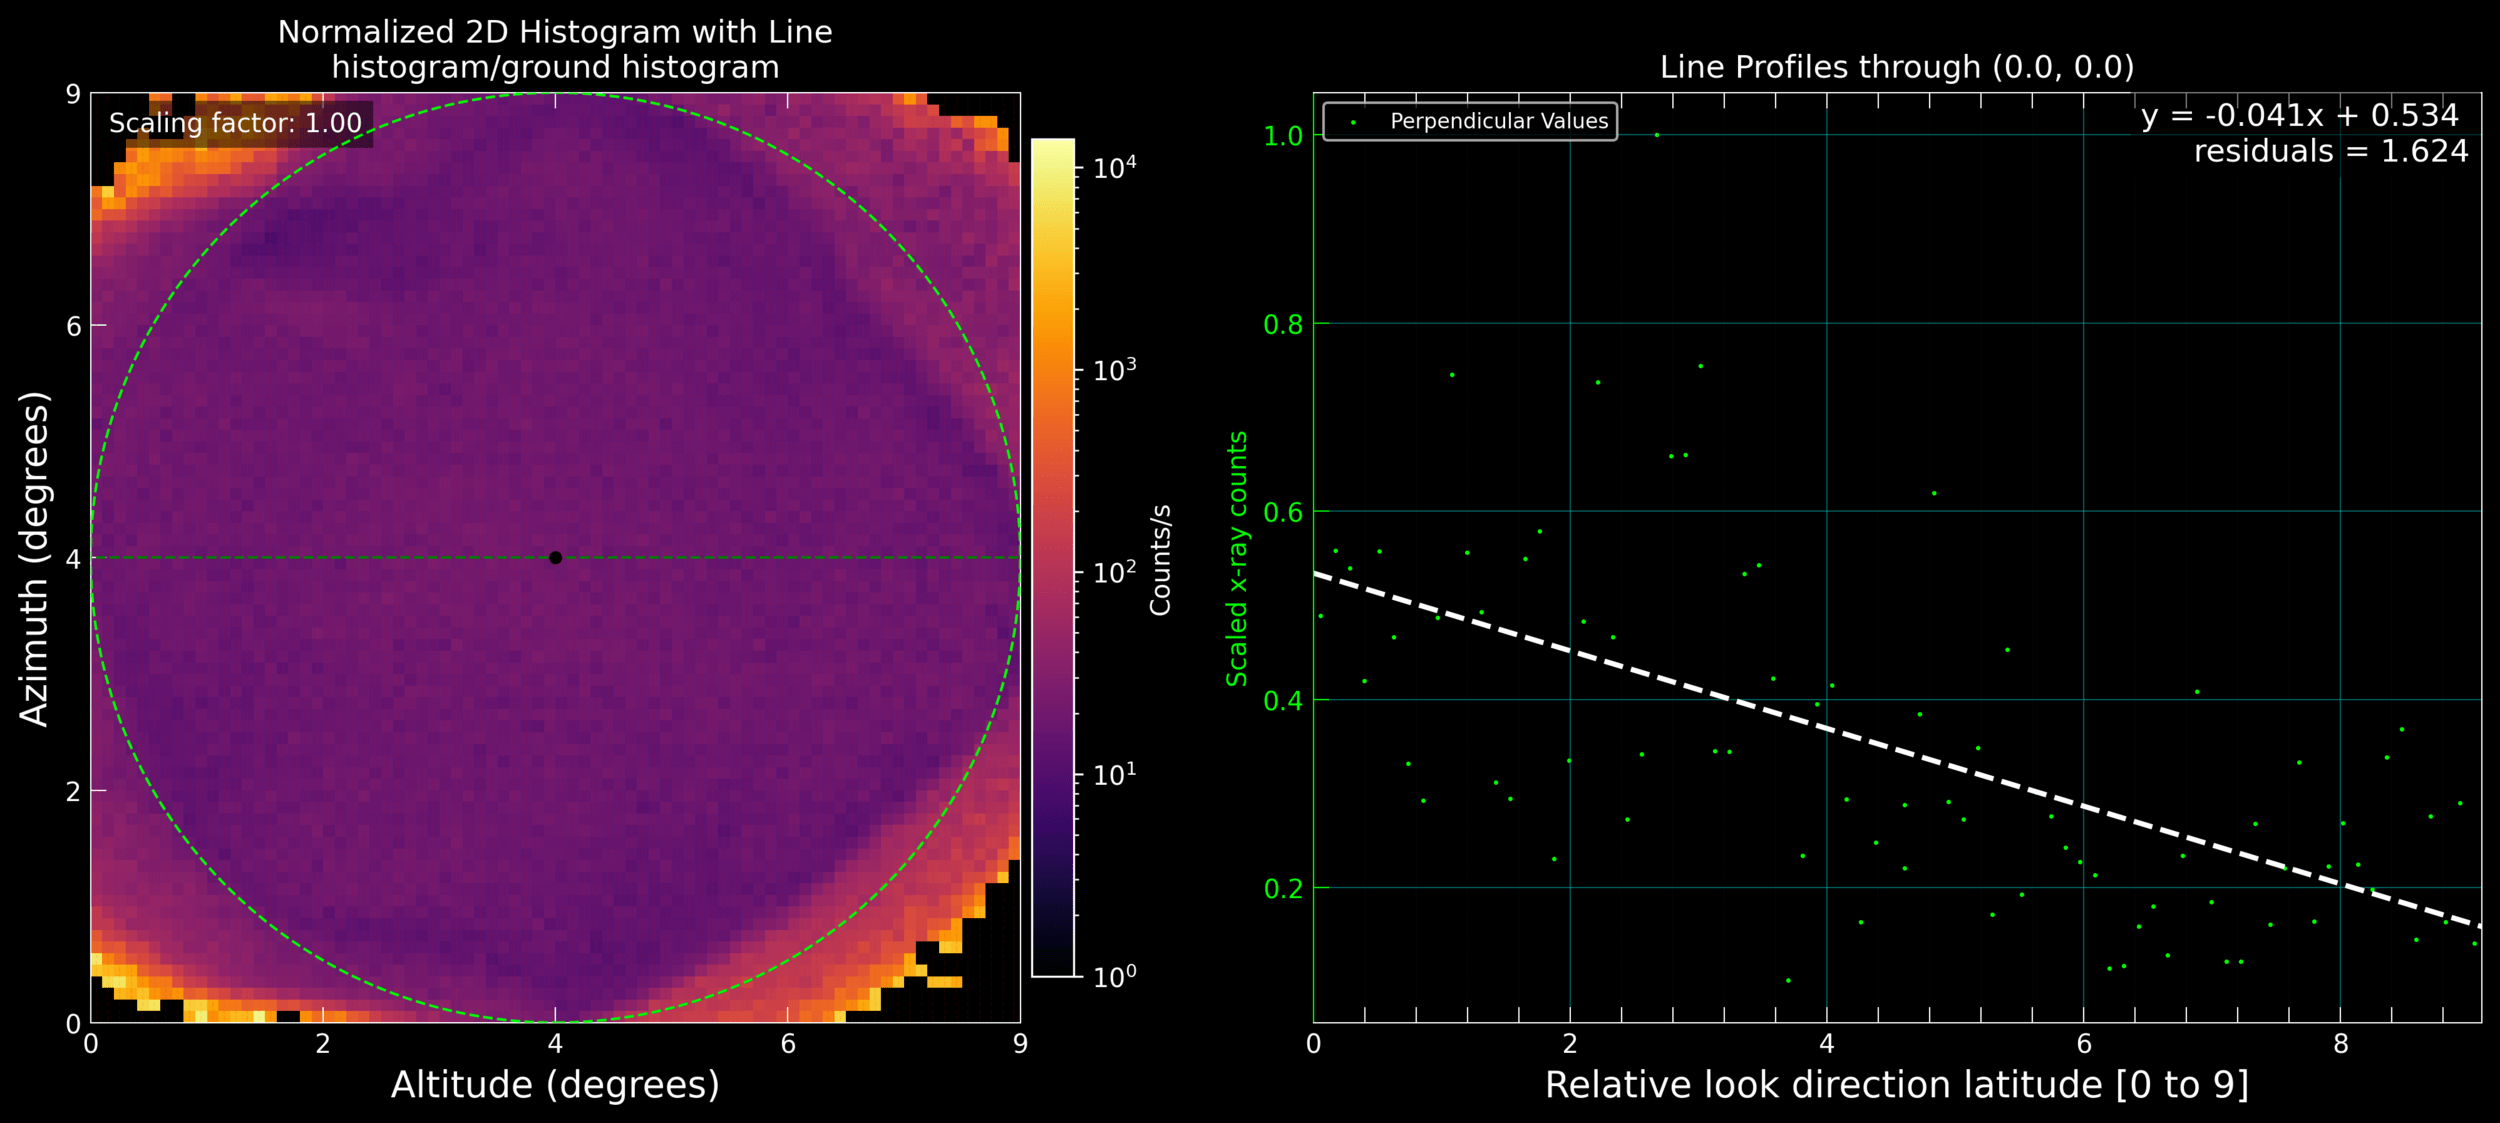
LEXI sun set image data
2025-03-16 19:45:00 to 2025-03-16 21:15:00
Sum of histogram values along different directions
LEXI sun set image data
2025-03-16 19:45:00 to 2025-03-16 21:15:00
Sum of histogram values along different directions
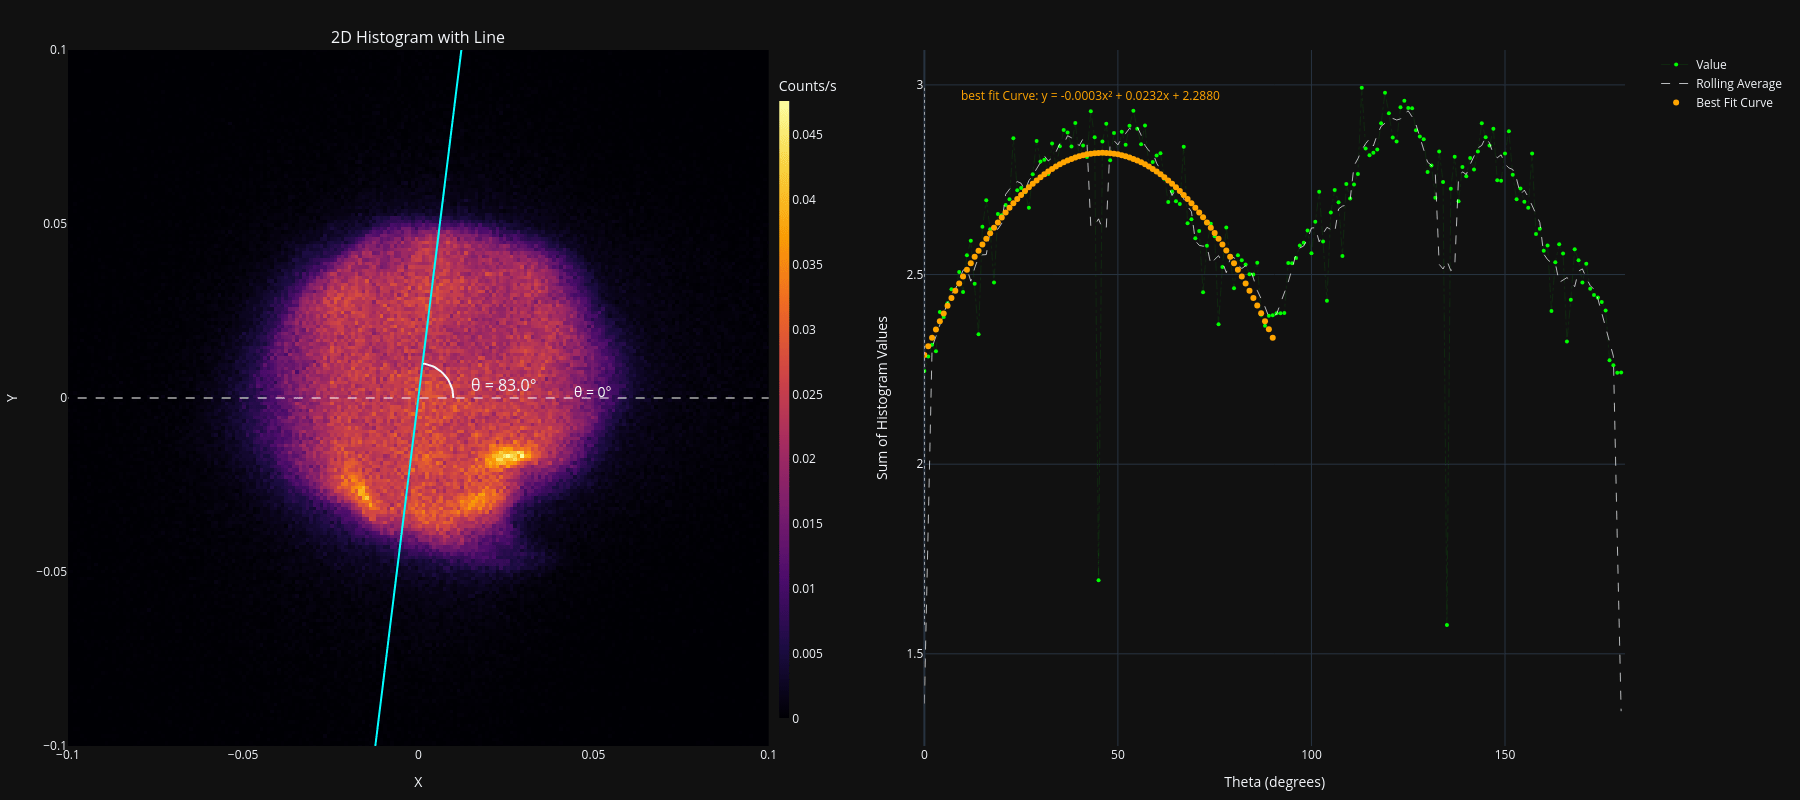
LEXI sun set image data
2025-03-16 19:45:00 to 2025-03-16 21:15:00
LEXI sun set image data
2025-03-16 19:45:00 to 2025-03-16 21:15:00
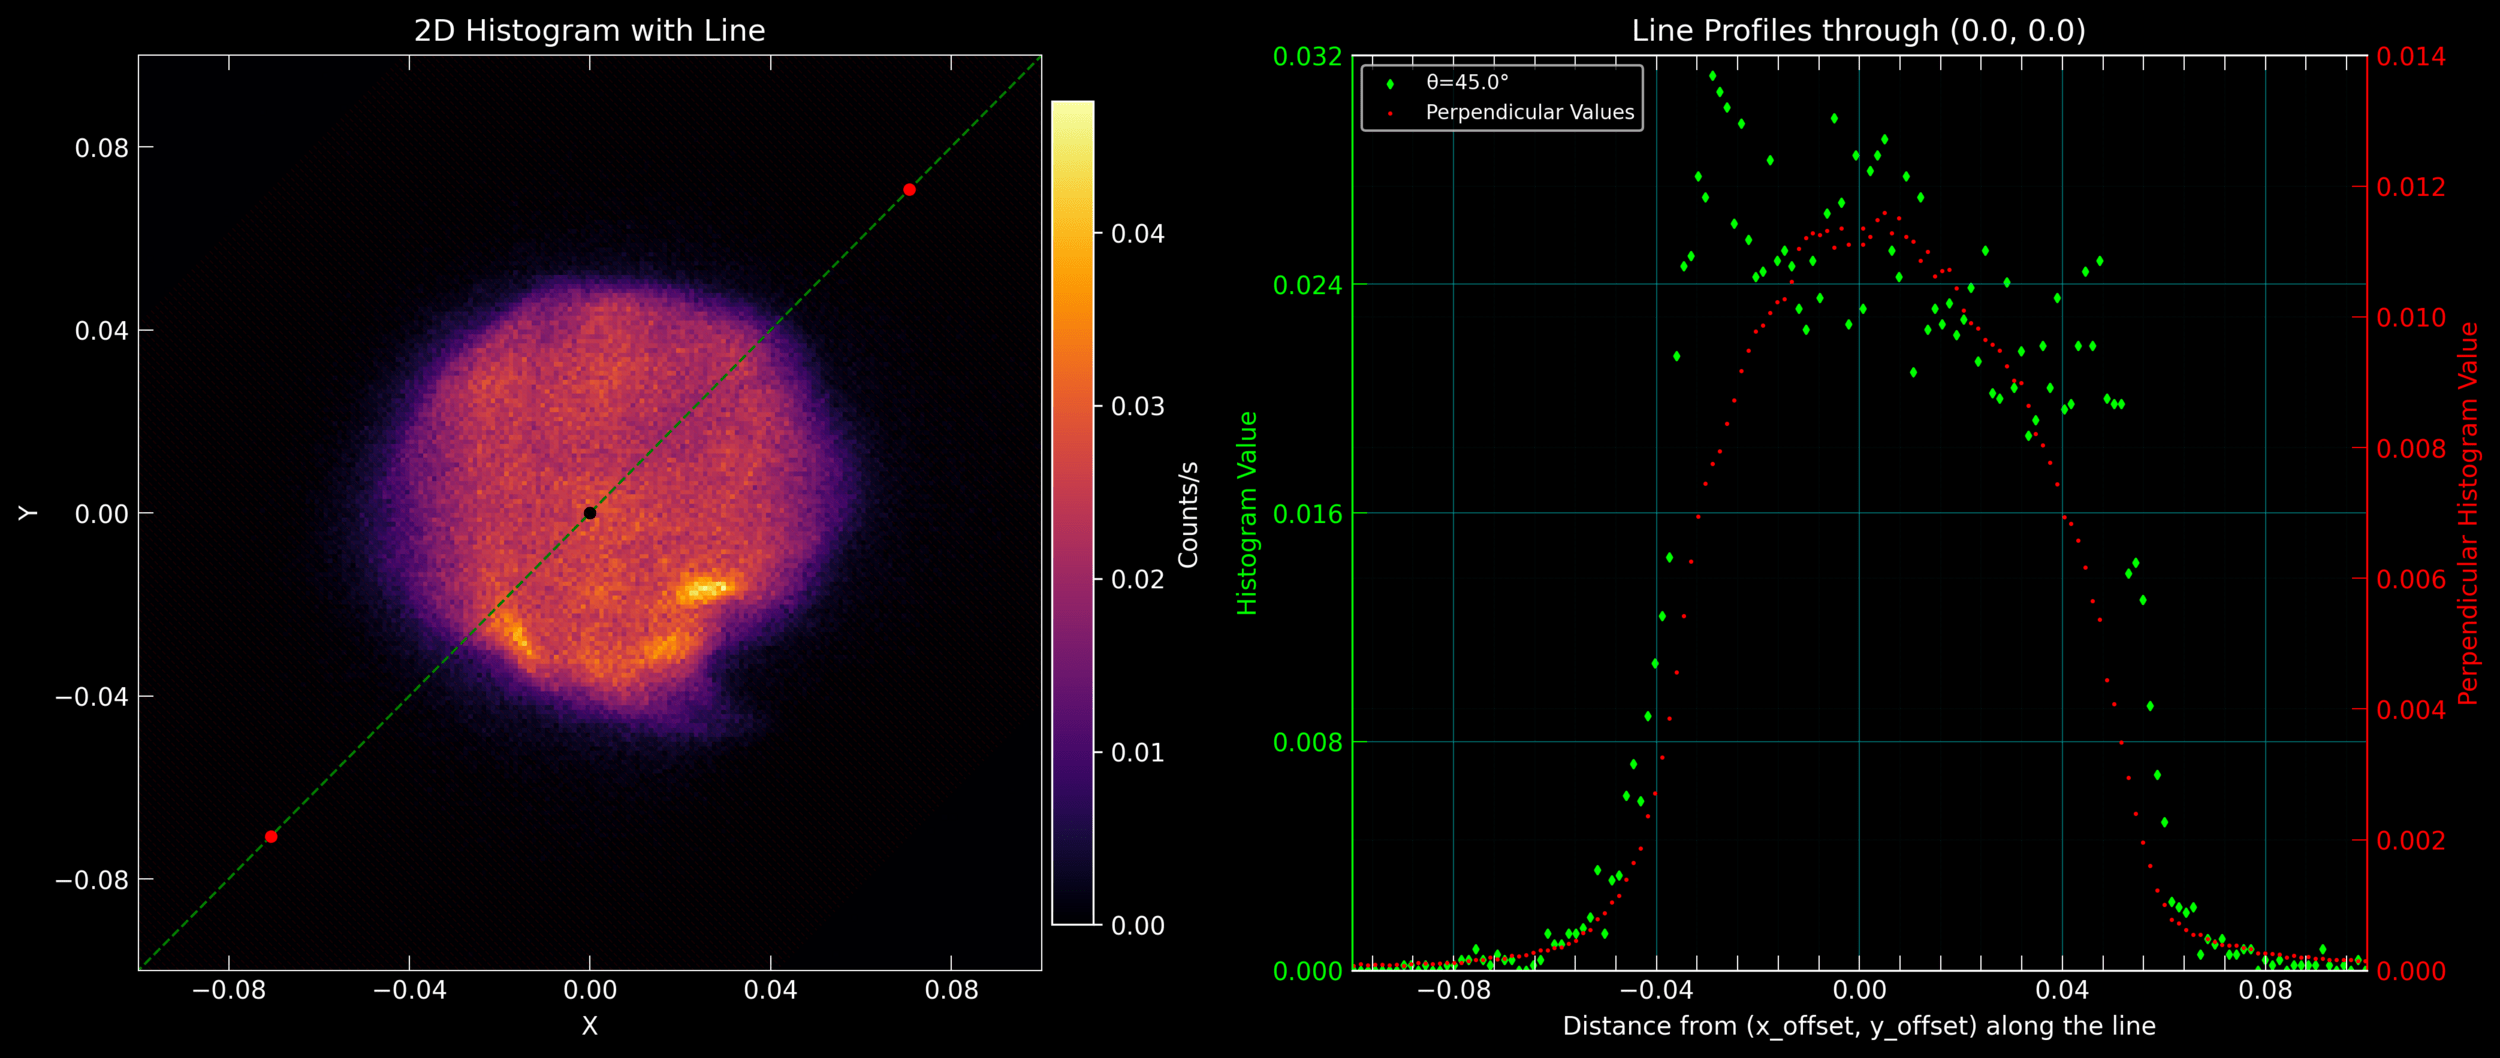
LEXI sun set image data
2025-03-16 19:45:00 to 2025-03-16 21:15:00
LEXI sun set image data
2025-03-16 19:45:00 to 2025-03-16 21:15:00
LEXI sun set image data
2025-03-16 19:45:00 to 2025-03-16 21:15:00
LEXI sun set image data
2025-03-16 19:45:00 to 2025-03-16 21:15:00
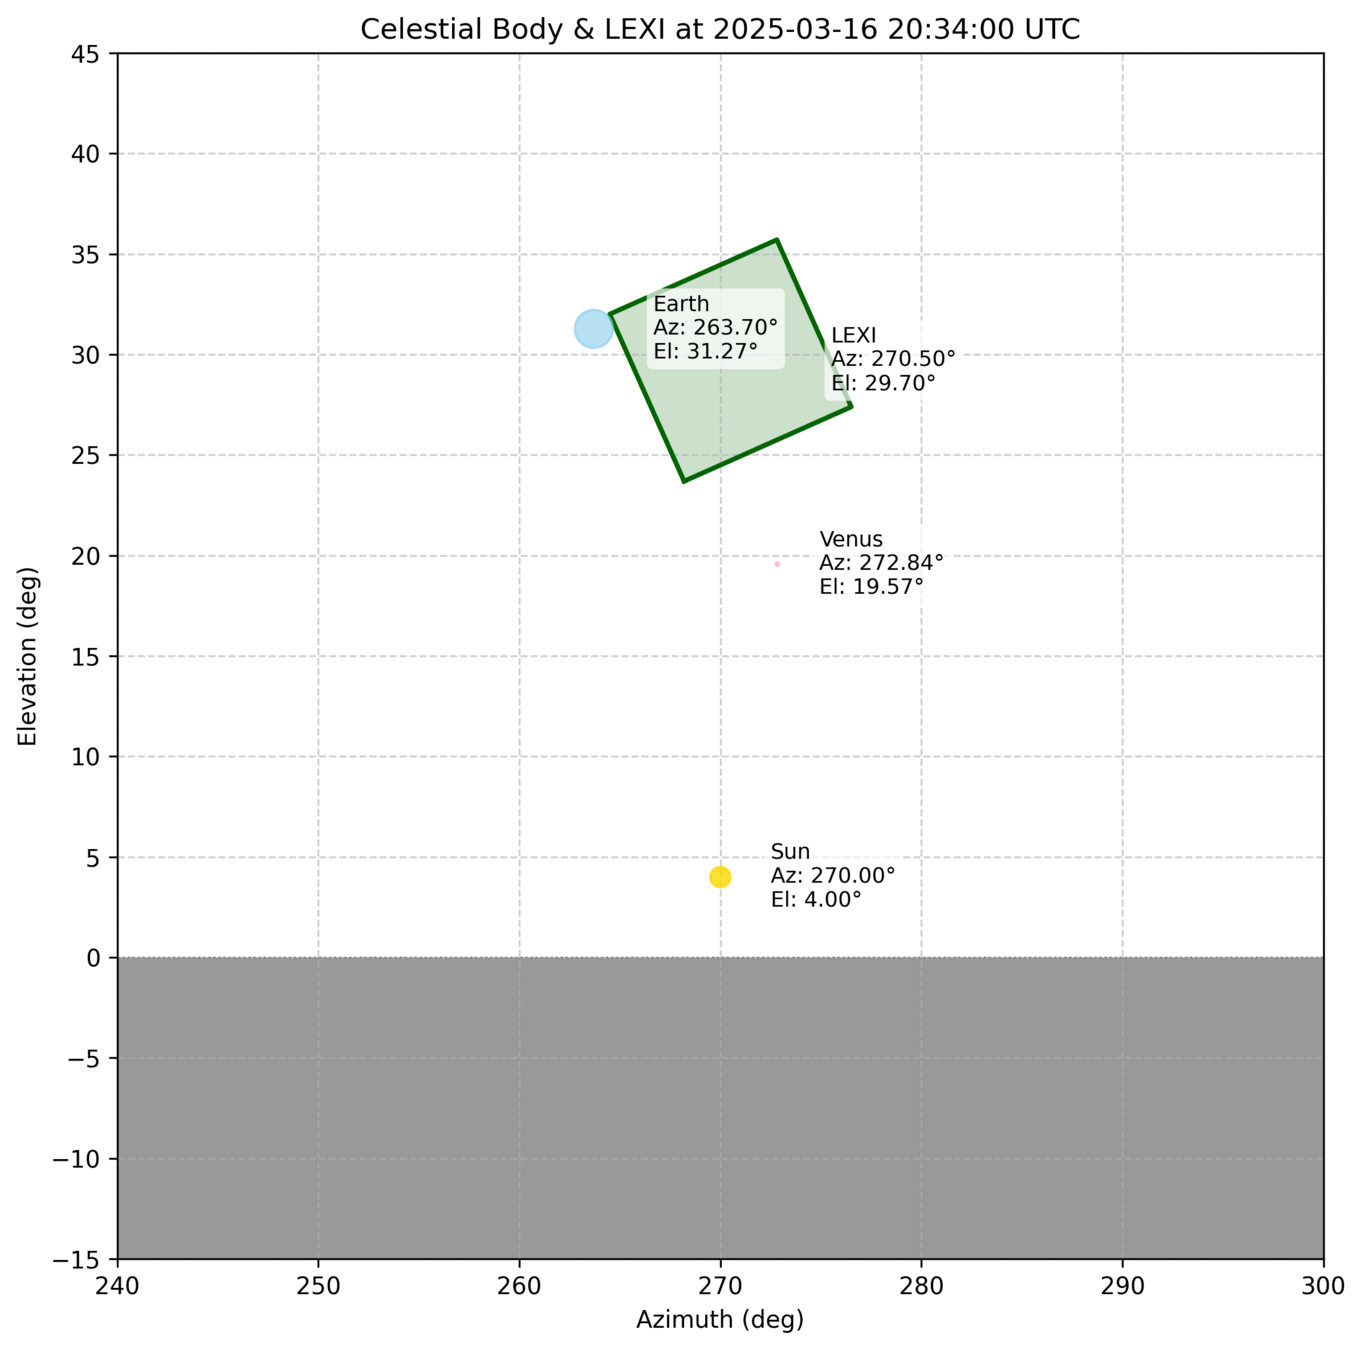
The x-axis refers to the altitude of the look direction with 0 being the lowest point in the detector coordinate plane. This direction is perpendicular to the lunar surface. Azimuthal direction is parallel to the surface. The sun is towards the left of the figure.
LEXI sun set image data
2025-03-16 19:45:00 to 2025-03-16 21:15:00
LEXI sun set image data
2025-03-16 19:45:00 to 2025-03-16 21:15:00
Analysis to see electron cloud distribution after sun-set.
Theory: There are a lot of electrons that are close to the surface of the moon. These electrons result in generation of x-ray.
Expected Observation: We should see a gradient in the LEXI images with highest value closest to the surface.
Analysis: We compute the sum of histogram values along different lines (explained in the previous slides) and check for gradient.
Result: Inconclusive result. More analysis needed.
Analysis of post sun set data
Post sun-set Data
V0.0
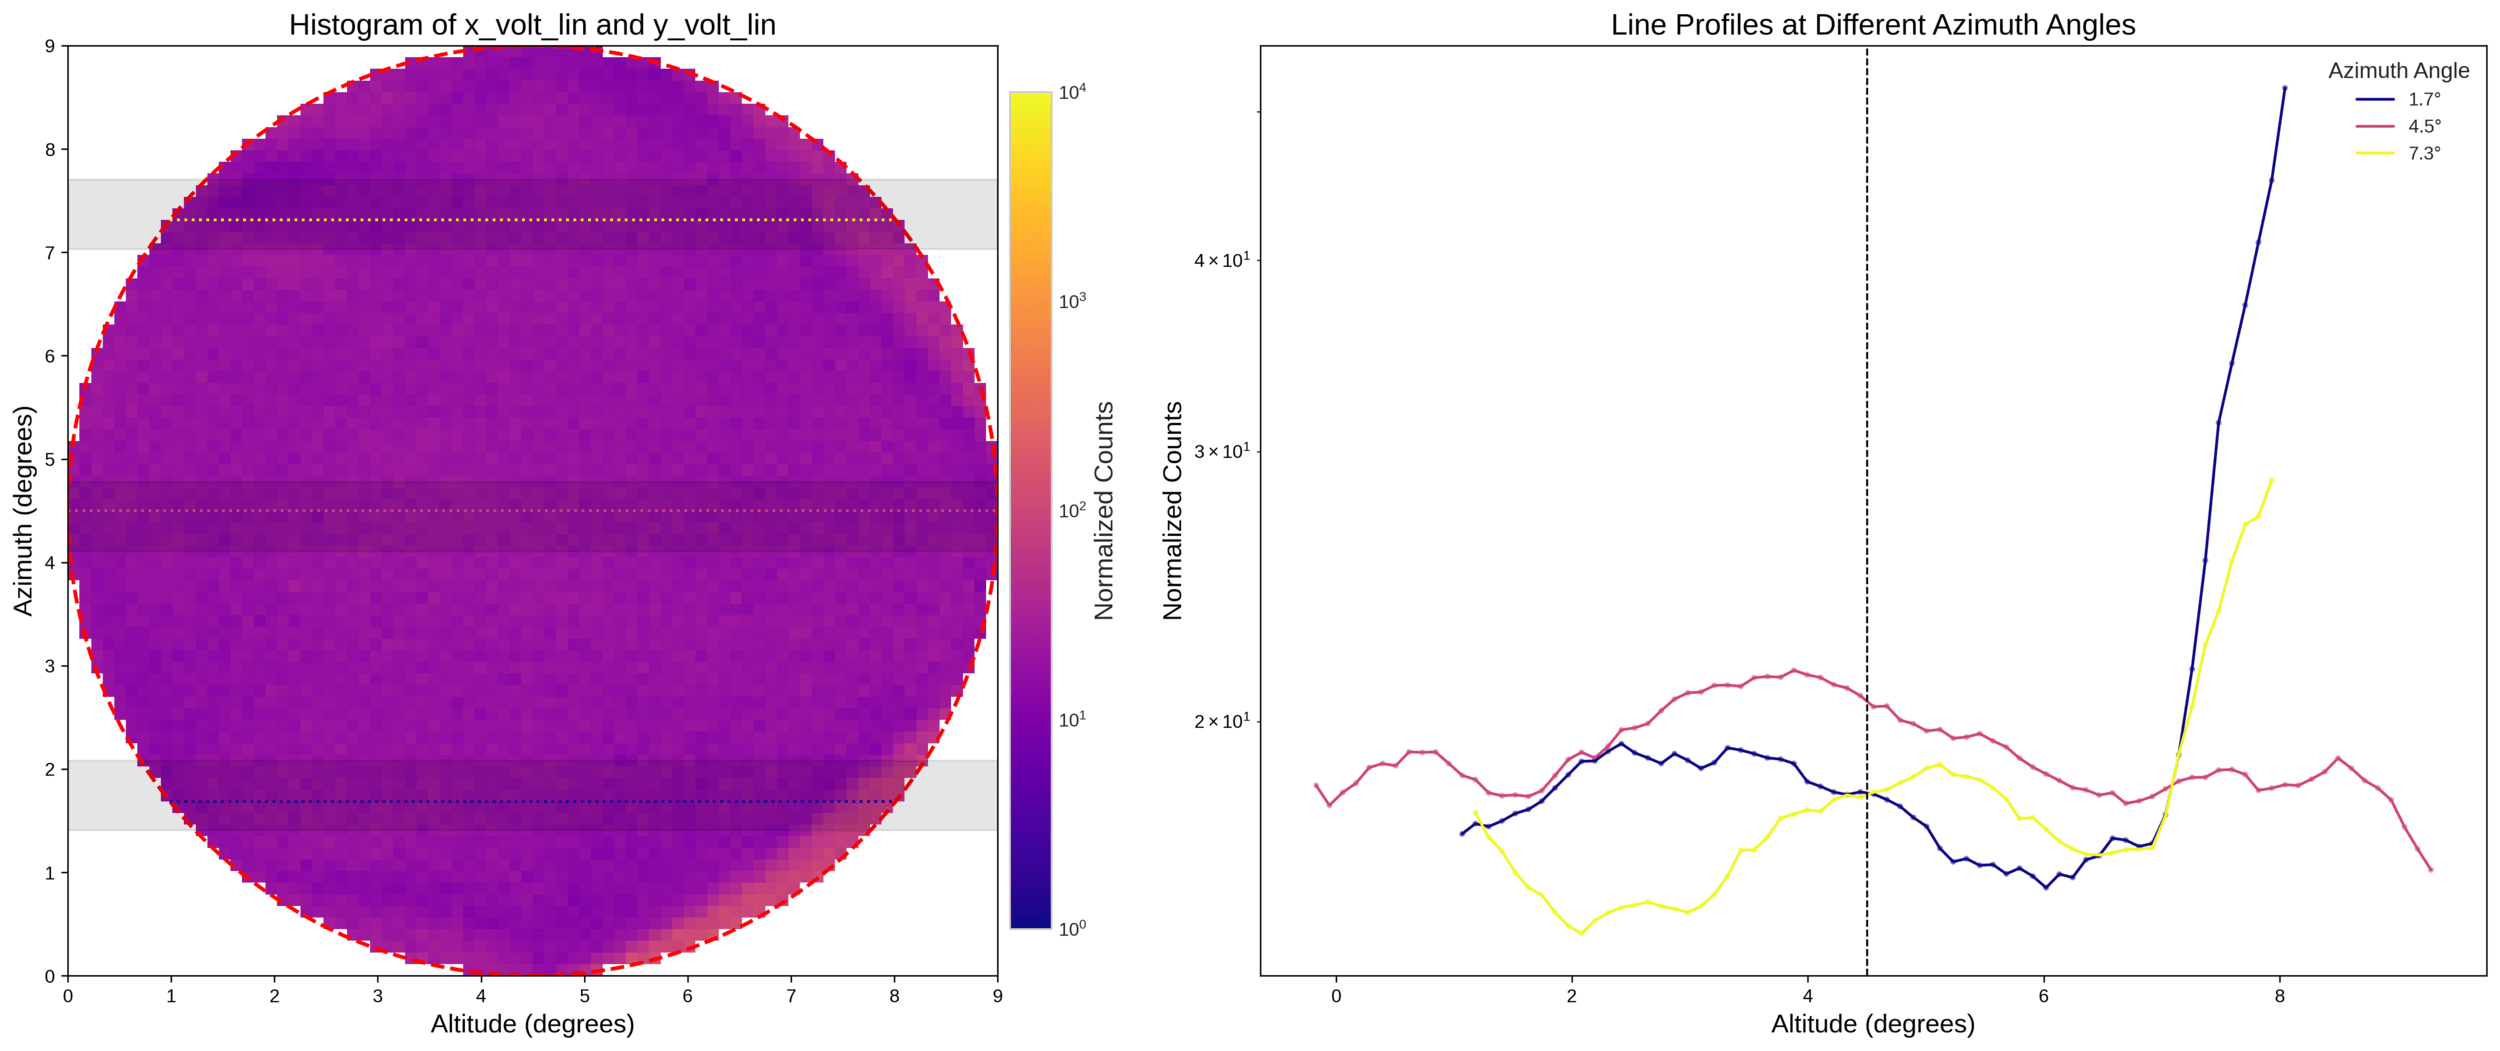
Line profile for the field of view
V0.0
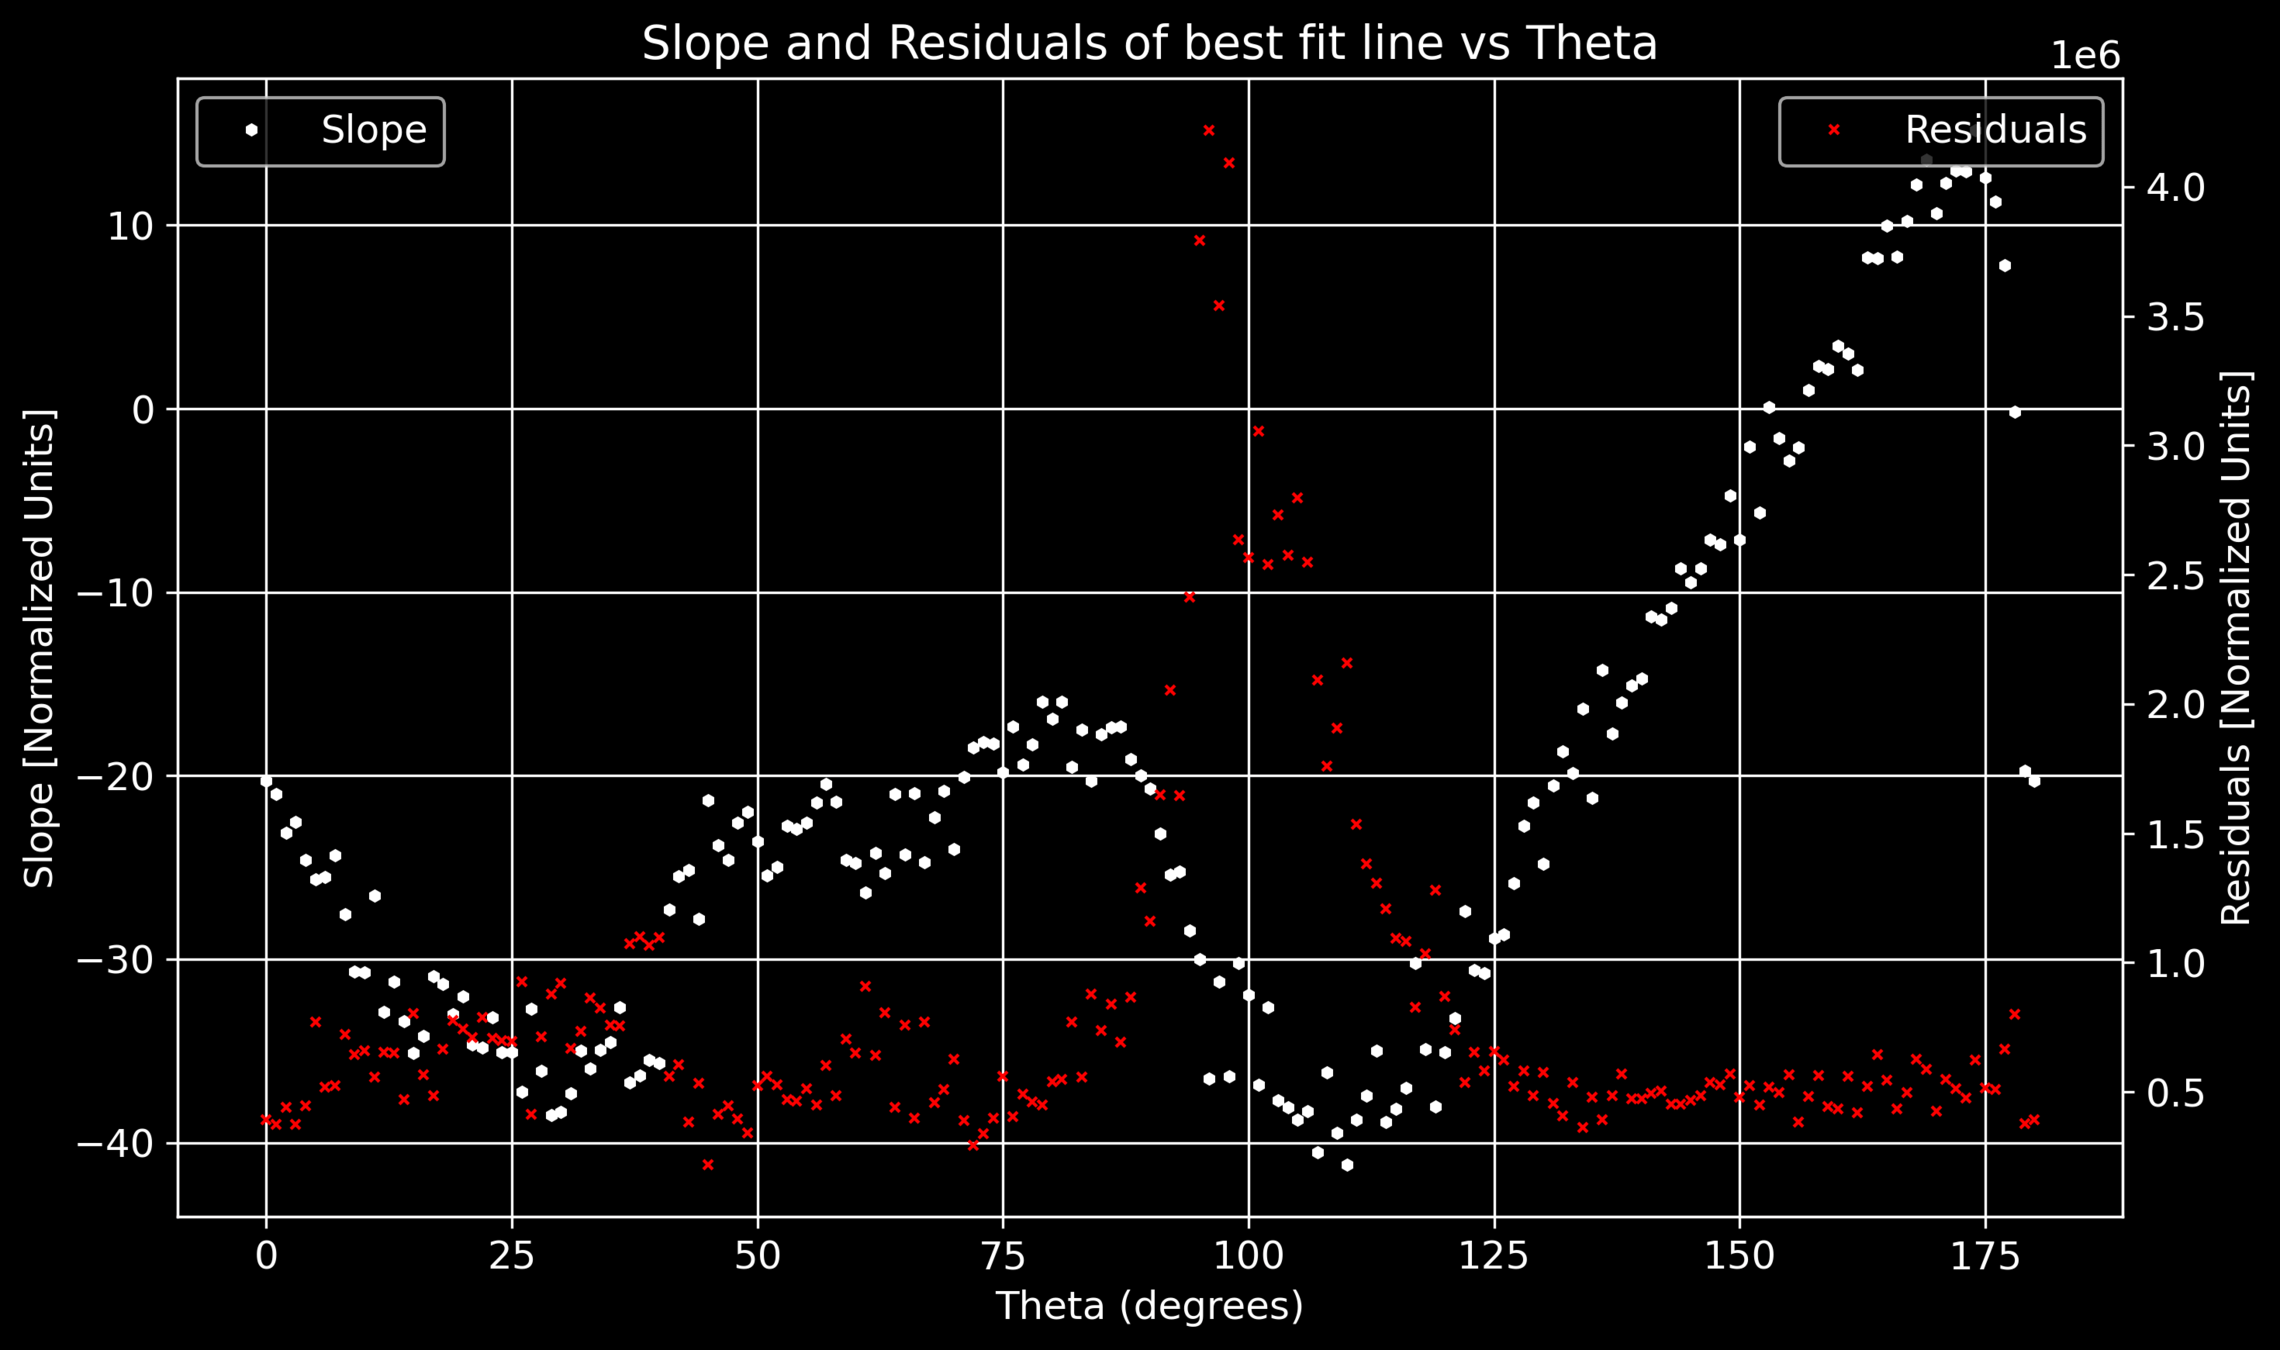
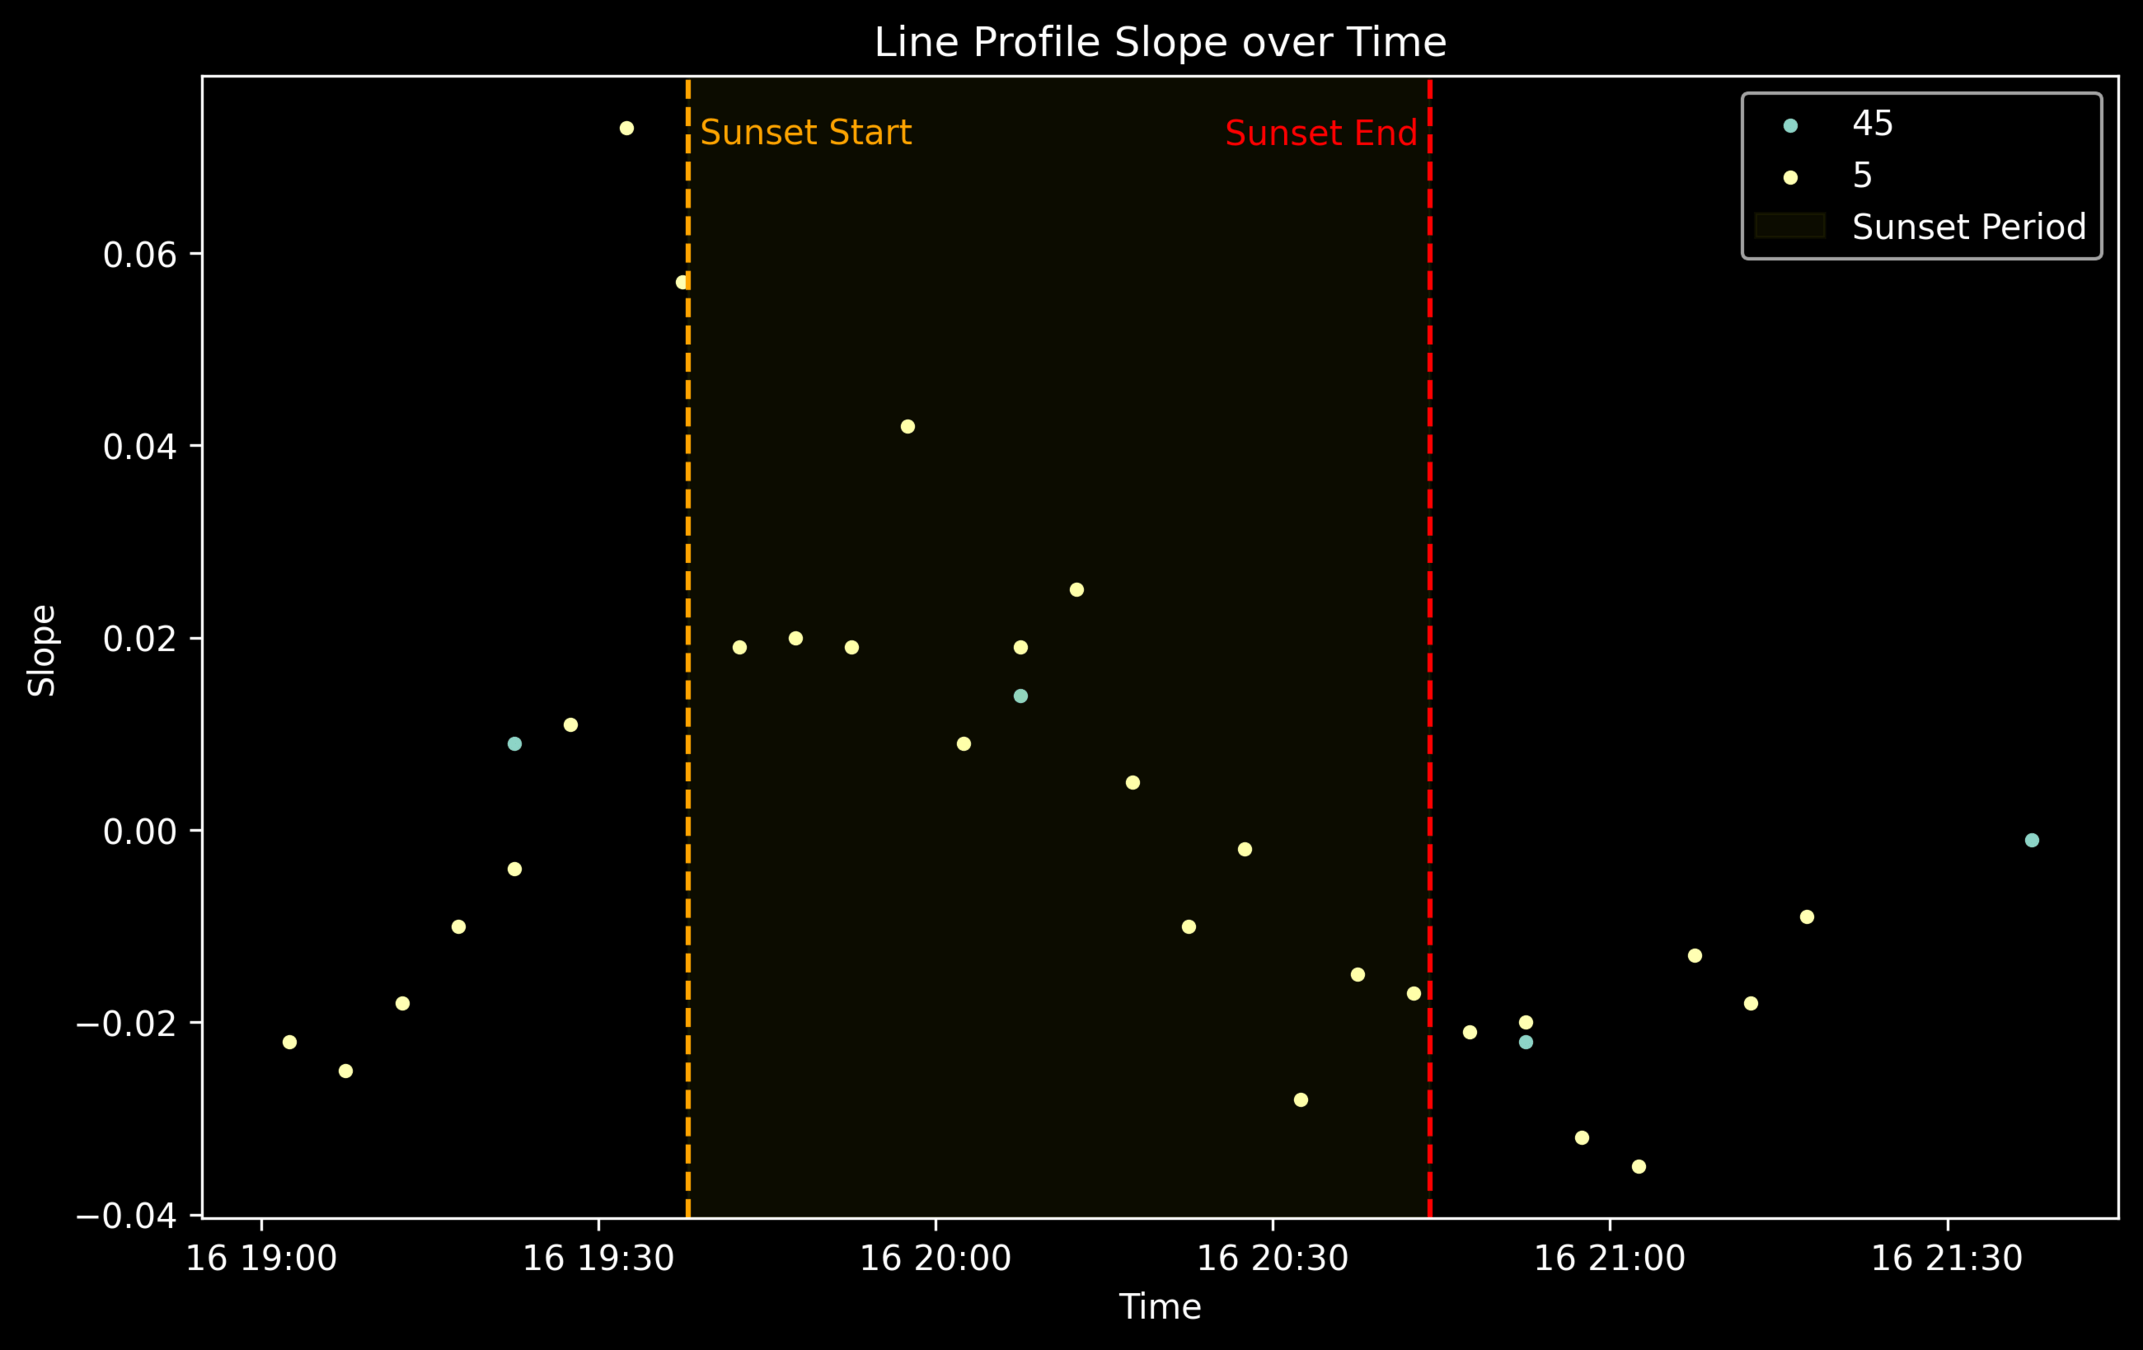
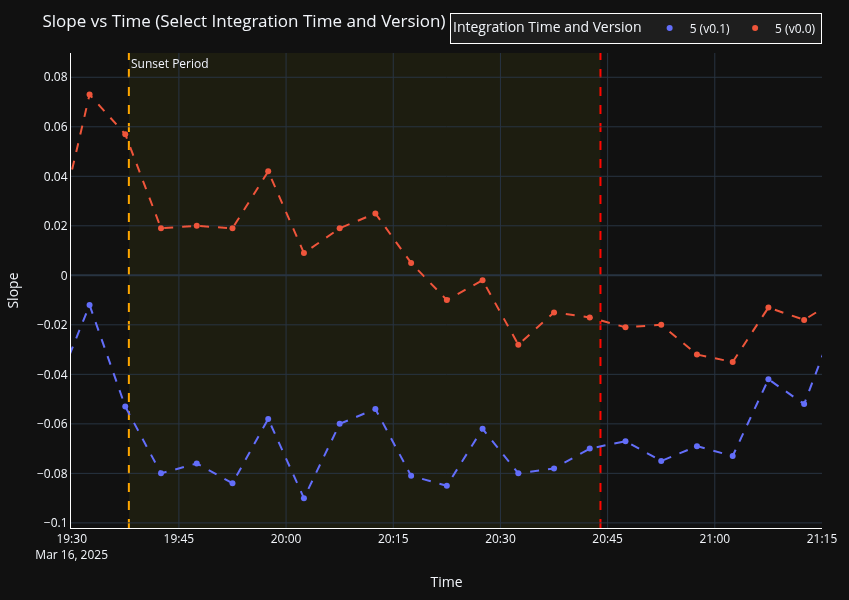
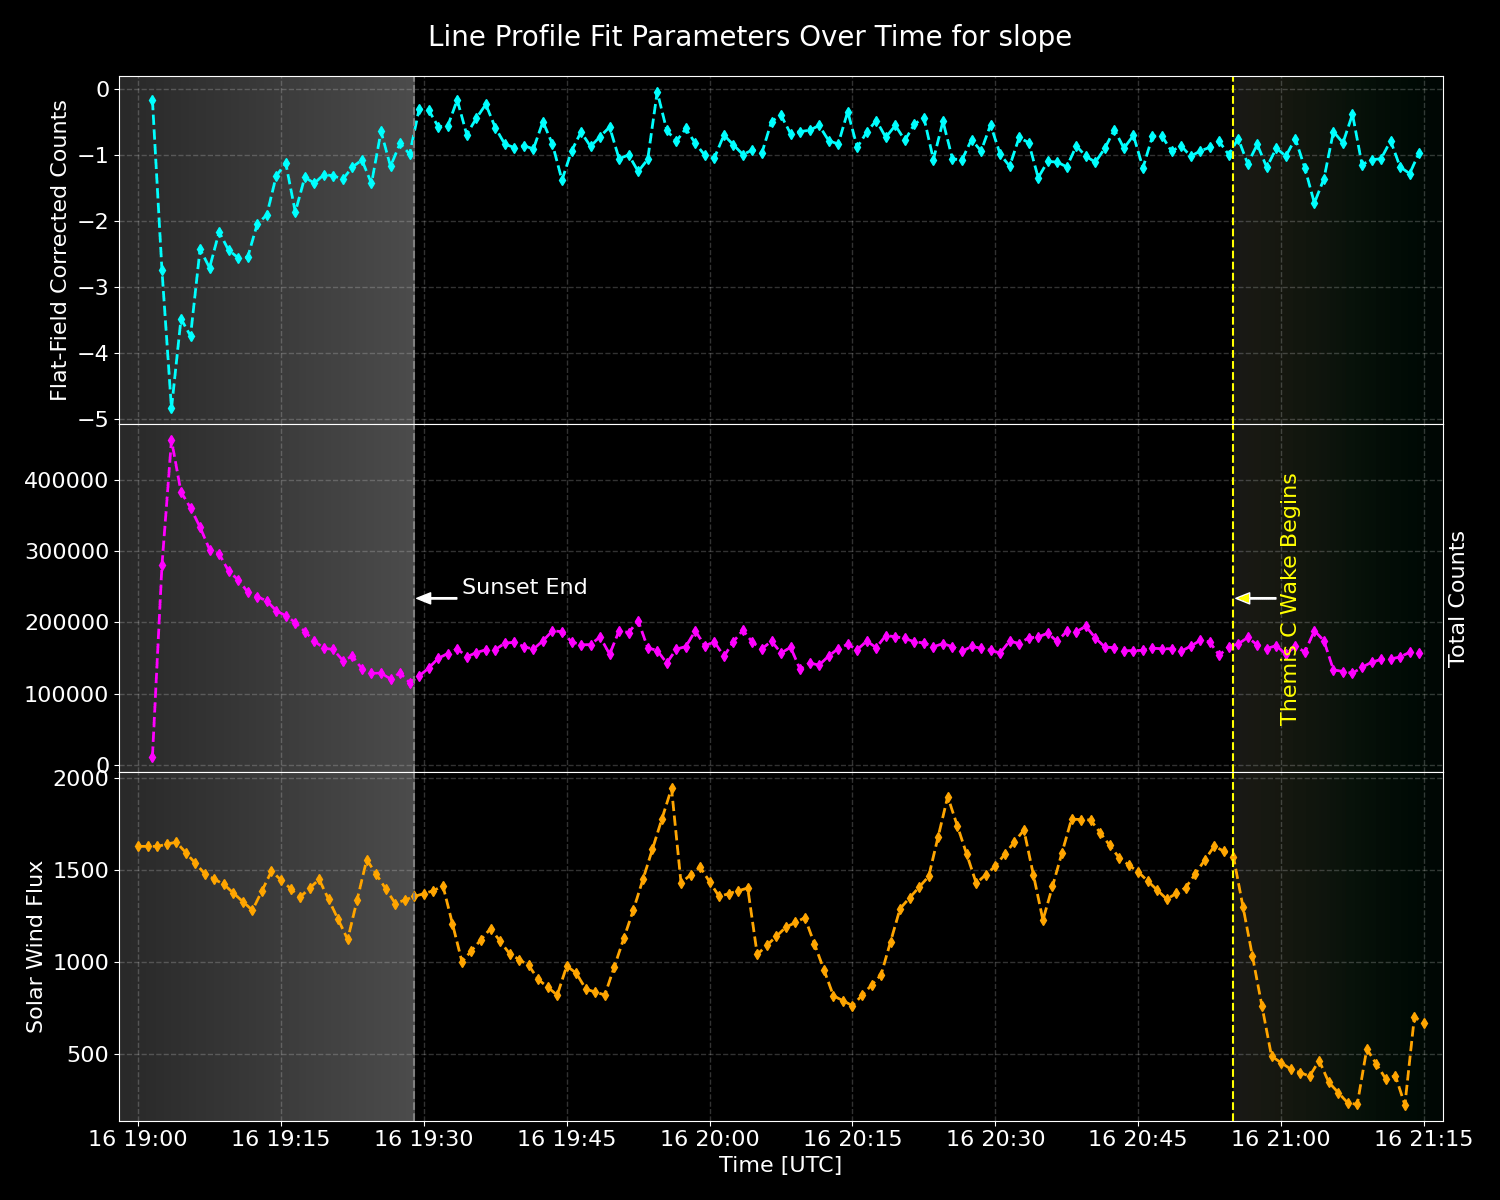
Variation of slope of the line with time
V0.0
Modification to the data
V0.0
V0.1
V0.1
Line profile for the field of view
V0.1
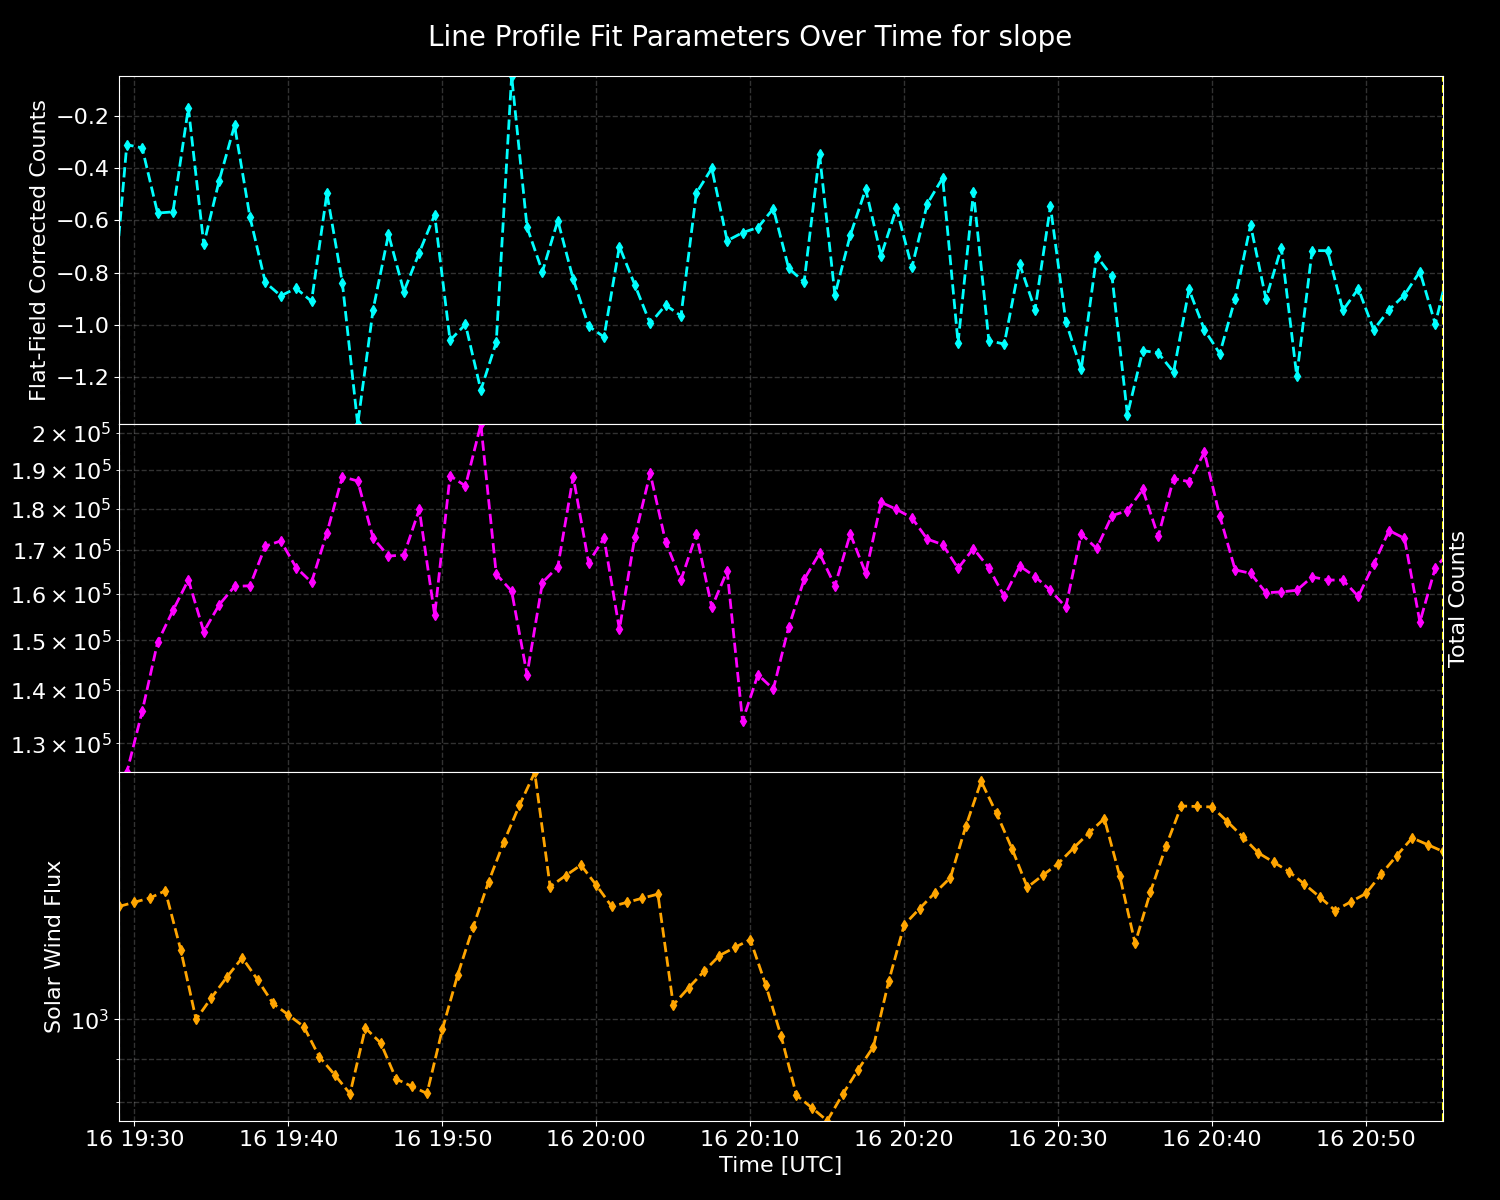
Variation of slope of the line with time
By Ramiz Qudsi
The LEXI data levels


