


Examples
Cultivating Critical Visualization Literacy
Dr. Rebecca Williams
Assistant Professor, Department of Computer Science & Electrical Engineering
University of Maryland Baltimore County (UMBC)

These slides are interactive!
- Interactive slides marked with a star
- You can scroll with your mouse
- Some support hover and interaction
- Look for the "more" button for bookmarks and padlet to open a new tab
Clickable! Table of Contents
- Bookmarked Resources on Data Visualization, Misinformation, Perception, and more!
- Data, Information, Knowledge, Wisdom
- Challenger Shuttle Case Study
- Cognitive Science, Perception, and Design
- Activities for Increasing Visualization Literacy
- Project Ideas
- Student Reflections
Visualization, Teaching, and Data Resources!
Intro: Dr. Rebecca Williams
Assistant Professor, Department of Computer Science and Electrical Engineering (CSEE)
- Also: Senior Engineer & Researcher at the Johns Hopkins Applied Physics Lab (JHU/APL)
| Data Visualization | Remote Sensing |
| Data Art | 3D Data Processing |
| Biometrics | Computer Vision |
Education and Teaching:
- Ph.D in Machine Learning for Remote Sensing (Dartmouth College)
- B.S. in Bioengineering (University of Illinois at Chicago)
- Lecturer (JHU Engineering for Professionals Program)
Current Hobbies:
- (indoor) rock climbing
- sewing and soft circuits
- (fall + winter) running, (summer) weight-lifting
- video games
- life-long learning
What is Data Visualization?
Task “effectiveness” involves:
- Memory (short and long term)
- Attention
- Decision-making

The purpose of visualization is to create visual representations of datasets to help people carry out tasks more effectively
- We do this by using external representations of data
What is Data Visualization?
The purpose of visualization is to create visual representations of datasets to help people carry out tasks more effectively
- We do this by using external representations of data
Incredibly transdisciplinary field! Includes:
- Psychology
- Cognitive science + Neuroscience
- Ethnography + User Studies
- Computer science
- Statistics and Data Science
- Graphic Design + Art
- Ethics
Interactive visualizations
- Interaction lets you explore huge datasets in chunks
- Interaction supports flexible queries
- You may not know what question you want to ask
- You may not know what you’re looking for
- Interaction is intrinsic (natural) for many domains/problems
- Changing views can lead to new insights
Data Visualization + Society
- Graphs and charts no longer just for technical audiences,
- in social media, used by and aimed at general audiences
- understanding them requires visual literacy
- more importantly, people are making decisions based on visualizations they encounter
- We use two types of mental processes when making decisions with visualizations:
- (Type 1) fast, automatic responses, like a gut reaction and intuition. Can be error prone
- (Type 2) slower, more effortful reasoning, like careful thinking and mental math
https://thedecisionlab.com/reference-guide/philosophy/system-1-and-system-2-thinking

Common definition of visualization literacy:
"the ability and skill to read and interpret visually represented data in, and to extract information from, data visualizations"
Example:
A bat and a ball cost $1.10 in total. The bat costs $1.00 more than the ball. How much does the ball cost?
Data Visualization + Society
- Graphs and charts no longer just for technical audiences,
- in social media, used by and aimed at general audiences
- understanding them requires visual literacy
- more importantly, people are making decisions based on visualizations they encounter
- We use two types of mental processes when making decisions with visualizations:
- (Type 1) fast, automatic responses, like a gut reaction and intuition. Can be error prone
- (Type 2) slower, more effortful reasoning, like careful thinking and mental math
https://thedecisionlab.com/reference-guide/philosophy/system-1-and-system-2-thinking
Example:
A bat and a ball cost $1.10 in total. The bat costs $1.00 more than the ball. How much does the ball cost?
Data Visualization + Society
- Reliance on fast, intuitive “System 1” thinking increases susceptibility to misinformation, especially in polarizing contexts
- Social media platforms present information in a fast-paced, visually dense, and emotionally charged manner that favors automatic, low-effort cognitive processing
- Perceptual tricks can reinforce this
- Learning interventions encouraging analytical thinking can reduce belief in misinformation
- alternative to teaching students to rely on fact-checking or memorization of red flags
- Now the question: What kinds of things should we teach to armor individuals against visual misinformation?

Data, Information, Knowledge, Wisdom
Our Data Revolution
-
We are currently living in a “data revolution”
-
Some call it the Fourth Industrial Revolution
-
Before computers + internet, data collection was laborious, slow, and manual
-
-
In addition to the ability to collect, store, and transmit all this data, there's been a change in what we consider to be data
-
The question becomes how to manage and use all this data
-
What does it get us?
-
Are we really better off?
-
Where is it all headed?
-
-
Data is objective
- in fact, raw data is an oxymoron [19]
-
There is a 1-to1 mapping of chart type to dataset type
- actually, the visualization design space is infinite!
-
If a visualization is aesthetically pleasing, it is effective
- often the sleek and clean aesthetics can be most misleading
Common Student Misconceptions
-
Data is objective
- in fact, raw data is an oxymoron [19]
-
There is a 1-to1 mapping of chart type to dataset type
- actually, the visualization design space is infinite!
-
If a visualization is aesthetically pleasing, it is effective
- often the sleek and clean aesthetics can be most misleading
Common Student Misconceptions
Key points about data et al.
There are two important discussion points about data, information, knowledge, and wisdom:
-
People have limited capacity for absorbing, processing, and storing information
-
Some of that can be outsourced to technology
-
But the sheer volume of data forces us to be selective
-
We often retain what is easiest to assimilate (i.e. agrees with what we already know, instead of what best meets our needs)
-
-
Data and information are not neutral
-
Even though it seems like numbers and facts should be objective
-
The ways that we collect, interpret, process, and apply data and information reflects our own values and society’s values
-
these values change over time
-
-
Data vs information
Here is my insightful data that I collected:
Basil 7 S Pear

Data vs information
What a-priori knowledge is required to make sense of this data?
- one example: the units of age are probably in "years"
- Why can we make this assumption?
- As humans capable of reasoning, we know (maybe) that a 7 month-old is probably too young to have fruit preferences
- Why can we make this assumption?
- what are some other examples?
Having data is not always the same thing as having information
Data, Information, Knowledge, Wisdom
"Choruses" by T. S. Eliot:
Where is the wisdom we have lost in knowledge?
Where is the knowledge we have lost in information?

https://en.wikipedia.org/wiki/DIKW_pyramid
- This model is often presented in information science texts, called the DIKW Pyramid
- Let's try to narrow down some definitions

Data, Information, Knowledge, Wisdom
https://en.wikipedia.org/wiki/DIKW_pyramid
-
It can help to really dig into the differences between data, information, and knowledge
- Because our brains are so good at abstraction from context, we think we know what these words mean
- Pyramid implies a hierarchical relationship: the lower parts are used to form the upper parts
Data, Information, Knowledge, Wisdom
https://en.wikipedia.org/wiki/DIKW_pyramid
- Pyramid implies a hierarchical relationship: the lower parts are used to form the upper parts
Data is synthesized into information
Information synthesized into knowledge
Knowledge synthesized into wisdom
this is a good starting point
Data, Information, Knowledge, Wisdom
https://en.wikipedia.org/wiki/DIKW_pyramid
Data is synthesized into information
Information synthesized into knowledge
Knowledge synthesized into wisdom
Data
- Typically we think of data as “raw” observations about the world, that we can collect and process into “information” or “knowledge”. e.g. colors, heights, shoe size, GPA
-
But it implies something that has been collected (not just exists) and organized into some “set” often called a dataset.
- If there’s a difference between “data” and “objects that simply exist” what might that difference be?
Data, Information, Knowledge, Wisdom
https://en.wikipedia.org/wiki/DIKW_pyramid
Data is synthesized into information
Information synthesized into knowledge
Knowledge synthesized into wisdom
Information
- Information is data that has been processed to give it meaning, to serve as a descriptor of the world or some concept
Data, Information, Knowledge, Wisdom
https://en.wikipedia.org/wiki/DIKW_pyramid
Data is synthesized into information
Information synthesized into knowledge
Knowledge synthesized into wisdom
Knowledge
-
Knowledge comes from a synthesis of information, like a web of interconnected pieces of information
-
It’s said that knowledge transforms information into instructions
-
Whereas information deals with some detail of a system, knowledge helps understand the system as a whole
Data, Information, Knowledge, Wisdom
https://en.wikipedia.org/wiki/DIKW_pyramid
Data is synthesized into information
Information synthesized into knowledge
Knowledge synthesized into wisdom
Wisdom
-
Wisdom is related to effectiveness - the ability to judge which objectives are worth pursuing.
-
The others relate to efficiency - how well can you do it
-
-
Wisdom isn’t external, it becomes part of a persons character
-
Developed from experience
-
Data, Information, Knowledge, Wisdom
Data is synthesized into information
Information synthesized into knowledge
Knowledge synthesized into wisdom
-
HOWEVER, higher levels will also affect lower levels
- Not everyone will discover the same set of instructions or knowledge from the same data
- In practice, people’s existing knowledge and assumptions about how the world works determines what instructions they glean, how they absorb and process information
Knowledge requires a knower, and a knower is human, which means:
- knowledge is not static
- knowledge exists within the context of a society or community
Data, Information, Knowledge, Wisdom
Data is synthesized into information
Information synthesized into knowledge
Knowledge synthesized into wisdom
-
In addition, higher levels will effect lower levels
- Not everyone will discover the same set of instructions or knowledge from the same data
- In practice, people’s existing knowledge and assumptions about how the world works determines what instructions they glean, how they absorb and process information
- New information is always slotted into current knowledge, your brain doesn’t erase every time
- Knowledge exists before data and information-- our worldview shapes them
Data, Information, Knowledge, Wisdom
- New information is always slotted into current knowledge, your brain doesn’t erase every time
- Knowledge exists before data and information-- our worldview shapes them
- a worldview = implicit assumptions, perspectives, or biases that shape how data is collected, interpreted, and presented
- Just like an individual's worldview affects how they perceive and interpret the world
- a dataset's worldview can include:
- selecting which data to collect. This is guided by assumptions and priorities
- deciding how to collect it. Surveys, instruments, sensor placement, cookies, etc
- what NOT to collect. Populations of interest, generalizations, etc.
Finally, wisdom
-
Although we can write code to process data automatically, neither data nor information actually exist without human interference
- Neither data nor information have universal defined the parameters by which they can be collected, known, and understood
- When we present data as "value neutral," this can cause harm, as there is no absolute "neutral"
-
Interpreting data (and visualizations) requires experienced wisdom
- Wisdom is related to effectiveness - the ability to judge which objectives are worth pursuing
- Becomes a part of your character, not just memorization of facts
https://www.kdnuggets.com/mastering-the-art-of-data-cleaning-in-python

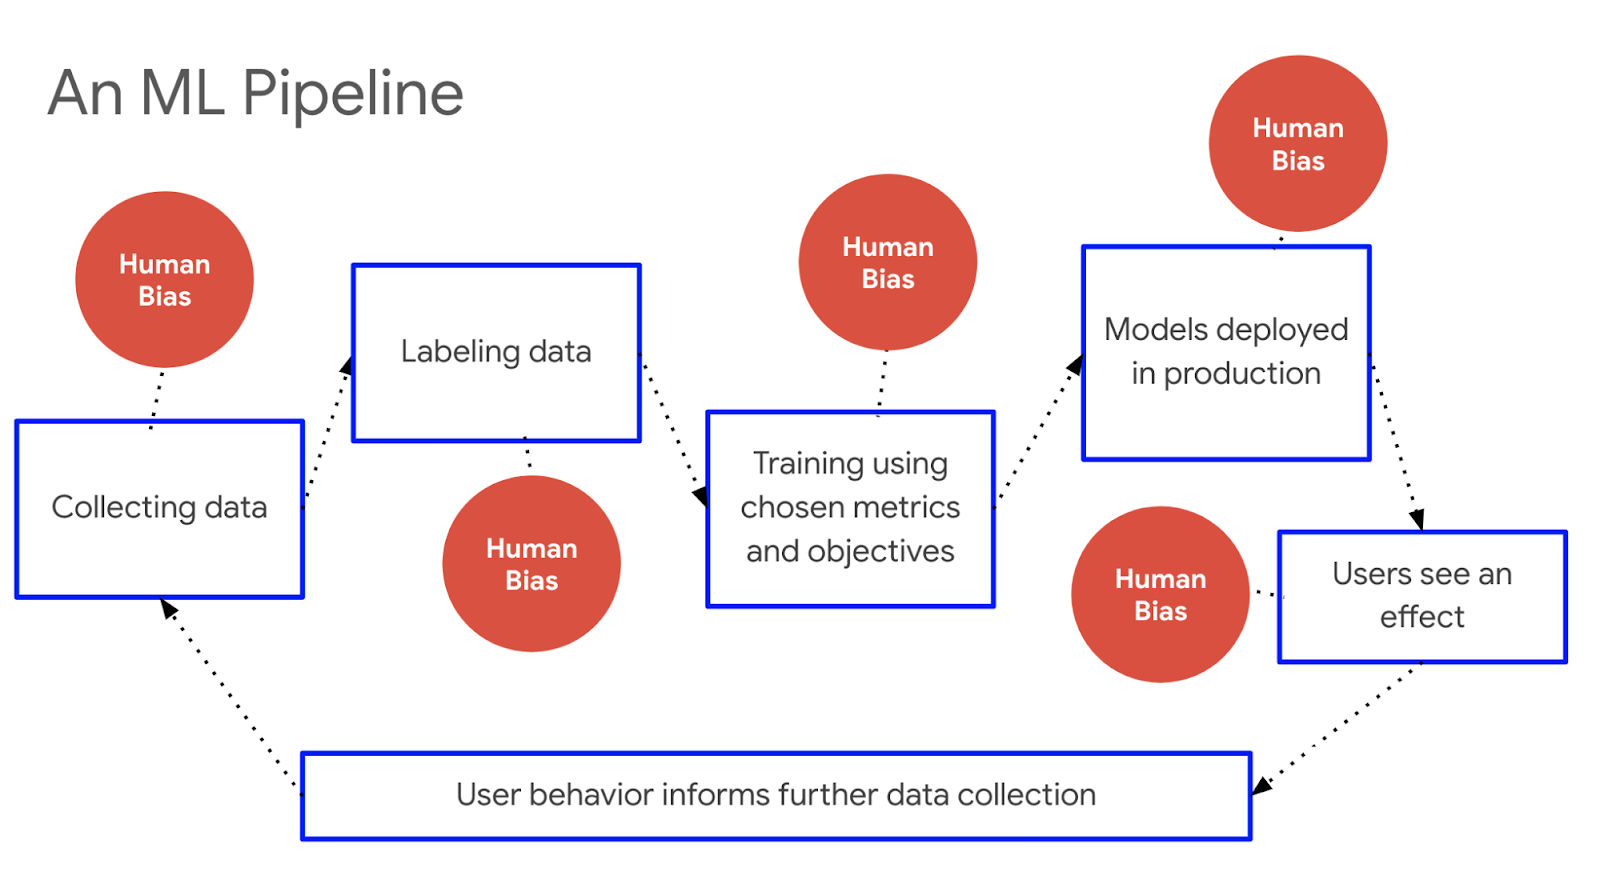
Human Bias in the Data Pipeline
-
There's no such a thing as "raw data" or "objective data"
-
"Data need to be imagined as data to exist and function as such, and the imagination of data entails an interpretative base"
- a person selects which data is relevant
- a person cleans that data
- a person has to give the data context and meaning
-
"Data need to be imagined as data to exist and function as such, and the imagination of data entails an interpretative base"
- It's not possible to create representations that are completely independent of human thought processes
- Data not only produces knowledge, it is also the product of human knowledge


Key Takeaways
-
Data is objective
- in fact, raw data is an oxymoron [19]
-
There is a 1-to1 mapping of chart type to dataset type
- actually, the visualization design space is infinite!
-
If a visualization is aesthetically pleasing, it is effective
- often the sleek and clean aesthetics can be most misleading
Common Student Misconceptions
-
Data is objective
- in fact, raw data is an oxymoron [19]
- There is a 1-to1 mapping of chart type to dataset type
- actually, the visualization design space is infinite!
-
If a visualization is aesthetically pleasing, it is effective
- often the sleek or compelling aesthetics can be most misleading
Common Student Misconceptions

Case Study: Challenger Space Shuttle

Case Study: Challenger Space Shuttle

Having data is not always the same thing as having information
Other sources of fallibility in data vis?
Our conceptualization and processing of data isn't the only place we can introduce bias, ambiguity or misleading information
- things can also be reinforced or obfuscated via design principles
- ideas are rooted in visual perception and cognitive science frameworks
- this is because we are creating a representation or an abstraction
- by definition, also an approximation
Cognitive Science, Perception, and Design
External representations
-
External representations help us form mental models
- External = external to your brain
-
Cognition (i.e. thinking, memorizing, deciphering) is expensive and precious
-
Perception (i.e. our 5 senses) is fast, automatic, and massively parallel
-
If it’s cheap & available, let’s use it!
-
Mental model = tasks in your brain only i.e. memorization, “thinking through” a problem
It's useful to offload as much as possible to perception, rather than cognition


Why depend on vision?
- Your brain = cognition + perception
- Perception = receiving the signals i.e. hardware
- Cognition = sense making of those signals i.e. software
- Eyeballs = cameras, brain = CPU?


Why depend on vision?
- Your brain = cognition + perception
- Perception = receiving the signals i.e. hardware
- Cognition = sense making of those signals i.e. software
- Eyeballs = cameras, brain = CPU?
https://www.allaboutvision.com/resources/human-interest/part-of-the-brain-controls-vision/

Why depend on vision?
https://en.wikibooks.org/wiki/Sensory_Systems/Visual_Signal_Processing
- Visual system has high bandwidth
- Operations carried out in parallel
- Many processes are preconscious (e.g. automatic, innate)

Why depend on vision?
https://en.wikibooks.org/wiki/Sensory_Systems/Visual_Signal_Processing
- Visual system has high bandwidth
- Operations carried out in parallel
- Many processes are preconscious (e.g. automatic, innate)

These things are happening outside your brain!!
Visualization as a Language
- A visualization (chart or graph) is a collection of symbols and visual characteristics
- We arrange these symbols in such a way to communicate information about data
- Just like we have
- a grammar for language (verbs, nouns, adjectives)
- rules for how to order them to convey meaning (syntax)…
- we have a grammar for visualization
- This is called visual encoding
- Instead of nouns and adjectives, we will call our visualization language elements marks and channels
The word encoding means:
to convert something from one system of communication into another
Marks + Channels
- Marks are the basic graphical elements (symbols) in a vis image (line, point, area)
- Channels are the visual appearance of marks (length, color, shape, position)
- The term channel means “way of communicating information"
- Channels modify marks

How the brain understands the language of visualization: Gestalt Principles
- The Gestalt principles describe how visualization elements are grouped by the human visual system
-
In language, grammar organizes words into phrases and sentences through hierarchical rules (e.g., subject–verb–object)
-
Vision organizes parts into wholes (e.g., edges into shapes, shapes into objects) using perceptual grouping principles
- Transduction from photons --> mental representations
https://www.frontiersin.org/journals/psychology/articles/10.3389/fpsyg.2015.01673/full
Form: Gestalt Principles
- Principles of psychology, applied to visualization
- German word meaning “form” or “shape” or “pattern”
- “whole is more/other than sum of parts”
- Context & relative judgements most important for perception
- Most principles help avoid inadvertent implied groups, reinforce correct ones
- Take advantage of pre-attentive processing in visual system

there is a difference between
what exists
what you see
and what you perceive
there is a difference between
what exists
what you see
and what you perceive

Dots, circles w/ parts missing, lines
Edge detection using luminance contrast creates binary signals that travel down the optic nerve
A triangle
- Your brain “fills in” gaps
- Doesn’t actually draw pixels where none exist
- Instead modifies your understanding of what you're seeing
Form: Gestalt Principles
- Similarity Principle: Elements that share similar attributes, color, or shape, are perceived as a whole.
- Proximity Principle: Elements tend to be perceived as aggregated into groups if they are near or connected.
- Enclosure Principle: Objects that appear to have a boundary or a continuation around them are perceived as a whole.
- Continuity Principle: Elements, unites, or groups aligned with each other are perceived as a whole.
- Closure Principle: Open structures can be easily be perceived as closed/complete.

Gestalt Principles + Data Visualization
- Each principle can be used for both good and evil
-
Good:
- take advantage of psychological principles to reduce cognitive load
- strengthen message with intuition
- present a balanced viewpoint
-
Evil:
- force the reader to see groups that aren’t really there
- massage data to manipulate the narrative
- use simple shapes to abstract away nuance or draw in readers with pretty pictures lacking substance
- Note: not all misleading vis is malicious

Gestalt: Principle of Proximity
- Items that are closer together spatially are more related to each other than items that are further away
- Items that are more related belong in a group together
- Proximity is cognitively prioritized (is the most powerful indicator of related-ness)

Gestalt: Principle of Proximity
- Items that are closer together spatially are more related to each other than items that are further away
- Items that are more related belong in a group together
- Proximity is cognitively prioritized (is the most powerful indicator of related-ness)


Gestalt: Principle of Similarity
- Same size, shape, color implies relatedness
- However, similarity has less cognitive priority than proximity

Gestalt: Principle of Similarity
- Same size, shape, color implies relatedness
- However, similarity has less cognitive priority than proximity


Proximity + Similarity Work Together

Gestalt: Principle of Continuity & Closure


Misleading with closure: false linkage

- People are good at "pattern seeking," want to find correlations with historical data
- In this financial visualization, the similar pattern between the two lines holds no indication of how the other line will develop in the future


Proximity, Similarity, and Closure Working Togeter
How many groups do you see?

Enclosure overpowers similarity!
Activities for Increasing Visualization Literacy
Motivation
- Goal: Improve students' ability to critically evaluate visual misinformation
- Onslaught of misinformation
- Social media, news often include a vis to seem more credible
- This "visual misinformation" can be more insidious than text alone
- Students often hold misconceptions about effective visualizations, sometimes creating visual misinformation themselves
- went down a path of finding examples...
[1] H. K. Bako, X. Liu, L. Battle, and Z. Liu, “Understanding How Designers Find and Use Data Visualization Examples,” IEEE Trans. Visual. Comput. Graphics, pp. 1–11, 2022
[2] A. R. Fox and T. J. Scott, “Surfacing Misconceptions Through Visualization Critique.” arXiv, Oct. 07, 2020. Accessed: Jun. 02, 2023. [Online]. Available: http://arxiv.org/abs/2010.03747
[3]J. C. Roberts et al., “Reflections and Considerations on Running Creative Visualization Learning Activities.” arXiv, Sep. 20, 2022. Accessed: Feb. 10, 2023. [Online]. Available: http://arxiv.org/abs/2209.09807
Motivation
- Goal: Improve students' ability to critically evaluate visual misinformation
- Onslaught of misinformation
- Social media, news often include a vis to seem more credible
- This "visual misinformation" can be more insidious than text alone
- Students often hold misconceptions about effective visualizations, sometimes creating visual misinformation themselves
- went down a path of finding examples...

source: https://www.tylervigen.com/spurious-correlations
Motivation
- Goal: Improve students' ability to critically evaluate visual misinformation
- Onslaught of misinformation
- Social media, news often include a vis to seem more credible
- This "visual misinformation" can be more insidious than text alone
- Students often hold misconceptions about effective visualizations, sometimes creating visual misinformation themselves
- went down a path of finding examples...

1066 px
66 px
\frac{40 \text{ B}}{1.2 \text{ B}} = 33.3 \\ \text{vs.} \\\frac{1066 \text{ px}}{66 \text{ px}} = 16.2
Motivation
- Goal: Improve students' ability to critically evaluate visual misinformation
- Students often hold misconceptions about effective visualizations, sometimes creating visual misinformation themselves
- went down a path of finding examples...
-
Infinite design space of “don’t do this” patterns
-
Don’t want a negative, checklist‑driven course
-
Want to preserve creativity & critical thinking
-
Instructor time: collecting, organizing, re‑finding examples
-
- went down a path of finding examples...

- vis practitioners like to curate relevant examples into personal collections (it's me!)
- but struggle to maintain a large, unstructured collection, never revisit them (it's also me!)
- examples help contextualize data and domain
- looking at related examples spurs creativity, avoid design fixation
H. K. Bako, X. Liu, L. Battle, and Z. Liu, “Understanding How Designers Find and Use Data Visualization Examples,” IEEE Trans. Visual. Comput. Graphics, pp. 1–11, 2022, doi: 10.1109/TVCG.2022.3209490.

Working Idea: Engaging students in active example foraging + visual curation + peer critique helps them surface misconceptions and increases visualization literacy

- Intervention: Identify or create a platform and design activities that support these tasks
- Intervention: Enhance/Increase frequency of lecture treatment, course activities, and discussions of techniques that can cause misleading technical communications

VIS
Activity Design: Visualization Bake-off

- Students were asked to scour the web and find one example each of the “Best” visualization and the “Worst” visualization and Post them on Padlet
- Once posted, students completed a structured evaluation for their post
- Then they get into small groups and discuss which should be a finalist
forage
critique
curate
Activity Design: Visualization Bake-off


Next they all vote for a "most misleading" winner
Activity Design: Visualization Bake-off
Next they all vote for a "most misleading" winner
Activity Design: Visualization Bake-off
The Winners!
Gallery and Tales

https://flowingdata.com/2021/06/08/seeing-how-much-we-ate-over-the-years/


by the end of our redesign activity, many students decided it wasn't that bad after all
the colors are terrible, why would you choose those colors?
https://flowingdata.com/2021/06/08/seeing-how-much-we-ate-over-the-years/

https://twitter.com/nwsomaha/status/1628204367177461760?s=46&t=7UPV7FX9orsAN5vpI1vtug

https://www.visualcinnamon.com/2020/06/sony-music-data-art/


This vis is misleading as it does not provide any context whatsoever of what the graph is about and it has a lot of data most of which is not labeled. It does not make a lot of sense and it is visually not appealing.
this was a great reminder to talk about the intended task and user - this was meant to be data art!
Visualization Research Project Ideas
Visualization Research Project Ideas: Maps!
- Mathematical functions that map 3D surface geometry of the Earth to 2D maps
- All projections of sphere on plane necessarily distort surface in some way

Visualization Research Project Ideas
(More) Visualization Research Project Ideas
Student Reflections
- Individual Portfolio self-reflections


Theme: Discussions with peers were seen as valuable and transformative, valuing different perspectives and contexts
- Individual Portfolio self-reflections
Theme: Students expressed concern about misleading information in media.

Theme: Discussions with peers
were seen as valuable and
transformative, valuing different
perspectives and contexts
2025 HCPS Cultivating Critical Visualization Literacy in Education
By Rebecca Williams
2025 HCPS Cultivating Critical Visualization Literacy in Education
Dr. Rebecca Williams, UMBC, 8/18/2025

