Art
of
Debugging
using
chrome devtools
Saket Kumar
@saki007ster

Swastik Pareek
@swastik1608
Target Audience
Product owners
who care for their products user experience.
Front end Developers who want their users to have awesome bug free experience
End users
who are for the experience they want to have.
Investment
Performance
Successful Application
Painfully slow
Bearable
Good
Very Fast
Less ROI
Sweet spot for all
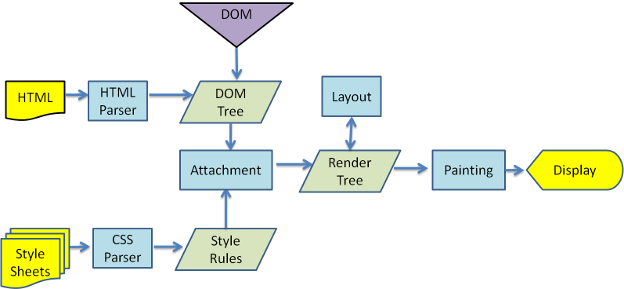
RENDERING PROCESS
Network TAB Chrome devtools
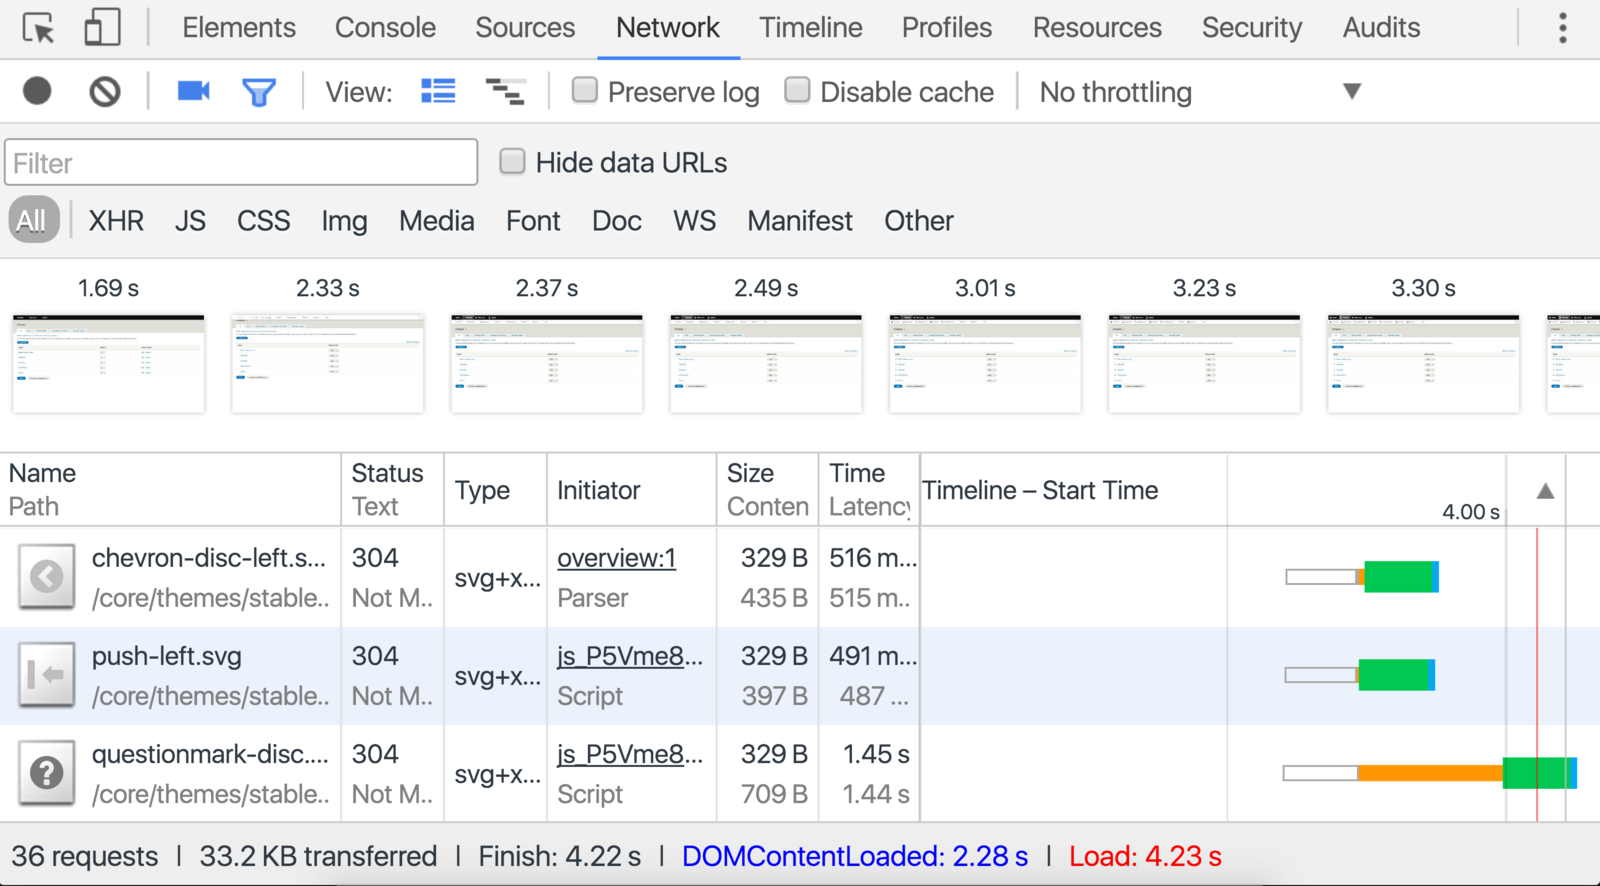
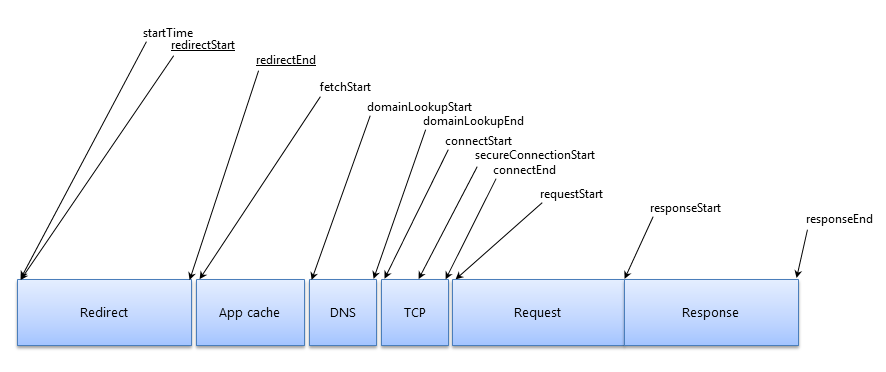
Waterfall Chart
- timing data for loaded
Pixel Pipeline

Browser Flow


CSS3triggers.com
CSS that trigger layout
CSS that trigger Paint
CSS that trigger Composting
is 50ms is slow ?
How users perceives ?
| Time (in ms) | User reaction |
|---|---|
| 0 - 100 | instant |
| 100 - 300 | Slight perceptible delay |
| 300 - 1000 | Task Focus - perceptible delay |
| 1000 + | Mental Context Switch |
| 10000 + | I'll come back later |
R
L
I
A
ESPONSE
OAD
DLE
NIMATION
Respond under 100ms
Deliver content under 1000ms
Maximise use of idle time - Preload data
Render frames every 16ms (60 FPS)
PRIORITISING
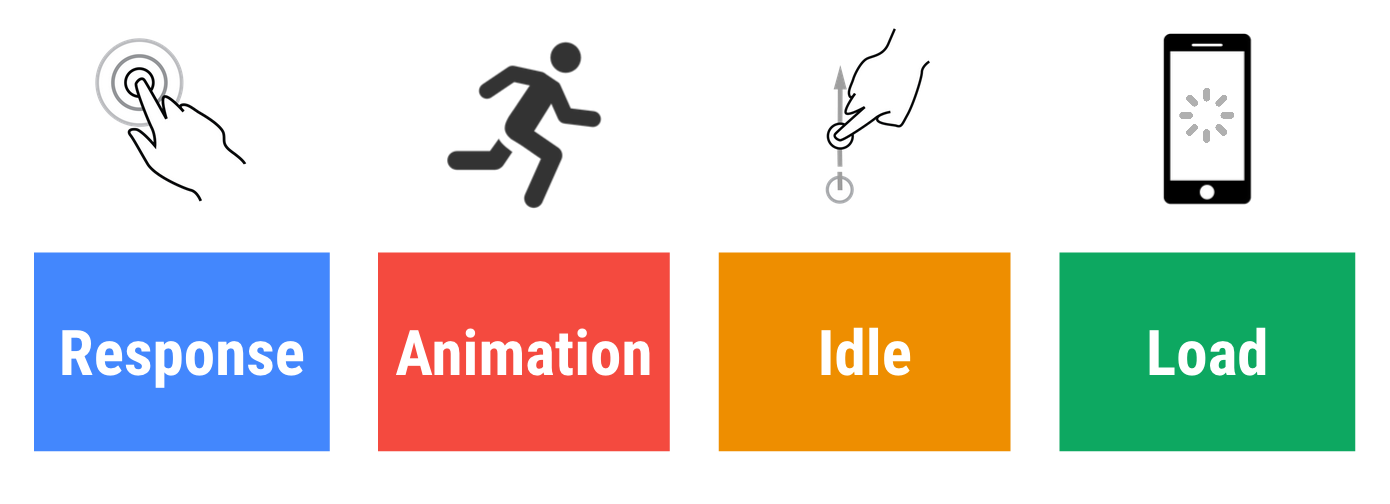
RAIL Model
RAIL in real world
Content website
Importance
R
A
L
I
Mobile Native App
Importance
R
A
L
I
Response
Animation
Load
For Composite action figure which one is the primary action.
MO
{
DEMO
}
Art of Debugging using Chrome Devtools
By Saket Kumar