JAVASCRIPT for
DATA VISUALIZATION

HELLO!
SONYL NAGALE

• Principal Software Engineer
• > 15 years experience in webdev
• JavaScript Circuit Mentor
• NOT originally a programmer!
AGENDA
Introduction
Why use Javascript
JavaScript 101
D3
INTRODUCTION
I AM...
- Fluent in JavaScript, PHP, and other Web technologies
- A full-stack web software engineer
- Excited about dataviz and its role in consumable data
INTRODUCTION
I Have Experience...
- Communicating with Design and upper management
- Analyzing traffic patterns on high-use websites
- Architecting high availability applications
- Using D3 and Highcharts to produce dataviz
INTRODUCTION
GOALS
- Why to use JavaScript for dynamic data
- JavaScript 101: data types, control structures, and the DOM
- Collaborative workshop
WHY USE JAVASCRIPT
WHY USE javascript?
WHY USE Javascript
- Rapidly changing data
- Programmer-friendly
- Website-friendly
- Easily create dashboards and kiosks
- Interactive
- Flexible
WHY USE javascript?
Why use javascript
d3: uber rides by neighborhood
Why use javascript
Rapidly changing data
Why use javascript
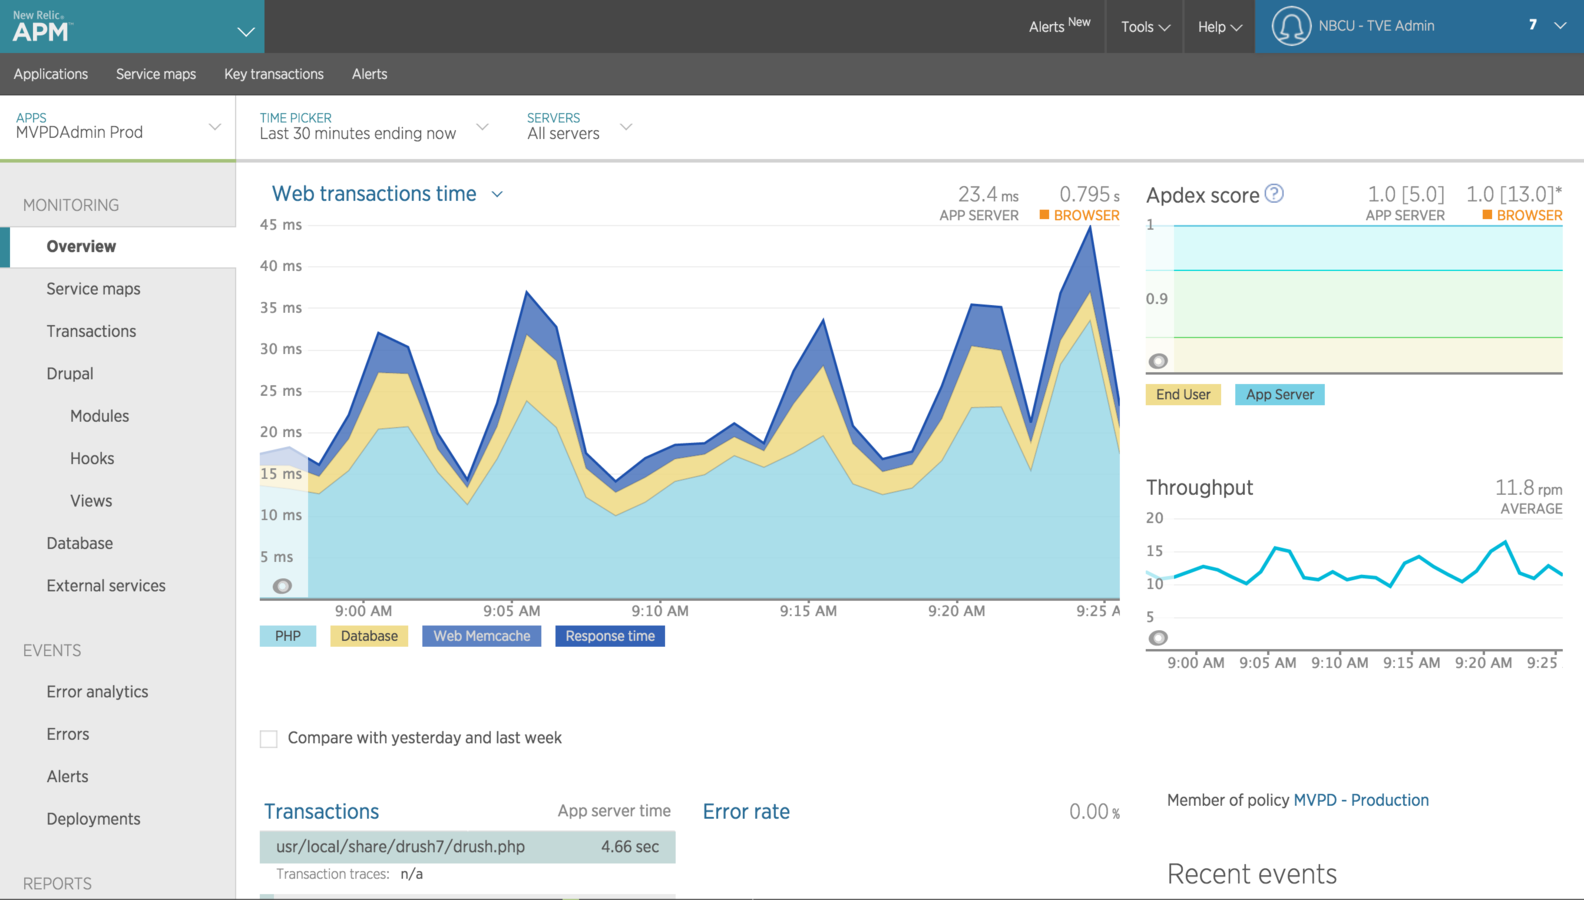
new Relic
Why use javascript
Pie Charts
Why use javascript
Donut Charts
Why use javascript
Histograms
Why use javascript
Trend Lines
Javascript 101
The basics
- Values, Operators, Expressions, Keywords, and Comments
-
Semicolon-terminated
-
Common pitfalls:
-
Forgetting a semicolon
-
Unbalanced expressions
-
Context
-
Javascript 101
The basics: Data Types
Boolean
Number
String
Array
Null
Undefined
Javascript 101
The basics: Data Types
} What’s the difference?
Boolean
Number
String
Array
Null
Undefined
Javascript 101
The basics: variable access
var width = 960,
      height = 500-37;

var margin = {top: 20, right:20, bottom:20, left:50};
Javascript 101
The basics: variable access
var width = 960,
      height = 500-37;

var margin = {top: 20, right:20, bottom:20, left:50};
console.log(width); // 960
console.log(margin.right); // 20
Javascript 101
The basics: Scope
var width = 960,
      height = 500-37;
weight = 100;

var margin = {top: 20, right:20, bottom:20, left:50};


function doStuff() {
    var myVariable = "do stuff";
    weight = 200;
    // do stuff
}

console.log(weight);
Javascript 101
The basics: Scope
var width = 960,
      height = 500-37;
weight = 100;

var margin = {top: 20, right:20, bottom:20, left:50};


function doStuff() {
    var myVariable = "do stuff";
    weight = 200;
    // do stuff
}

doStuff();
console.log(weight);
Javascript 101
The basics: JSON
[
  {
    "time": "1871",
    "Nile": "1120"
  },
  {
    "time": "1872",
    "Nile": "1160"
  },
  {
    "time": "1873",
    "Nile": "963"
  },
  {
    "time": "1874",
    "Nile": "1210"
  },
  {
    "time": "1875",
    "Nile": "1160"
  },
  {
    "time": "1876",
    "Nile": "1160"
  }
]
Javascript 101
The basics: JSON
- Key-Value pairs
- Objects...
- ... inside an Array
[
  {
    "time": "1871",
    "Nile": "1120"
  },
  {
    "time": "1872",
    "Nile": "1160"
  },
  {
    "time": "1873",
    "Nile": "963"
  },
  {
    "time": "1874",
    "Nile": "1210"
  },
  {
    "time": "1875",
    "Nile": "1160"
  },
  {
    "time": "1876",
    "Nile": "1160"
  }
]
Javascript 101
The Arcana: Everything is an Object
Object notation
var myObject = {
    x : 1,
    y : 2,

    getX: function() {
        return this.x;
    }
};

console.log(myObject.getX());
Javascript 101
The Arcana: Everything is an Object
Object notation
String.prototype.foo = function() {
    return "bar";
}

var unga = "Hello";

console.log(unga);
console.log(unga.foo());
Javascript 101
The Basics: control structures
text += cars[0] + "<br>";
text += cars[1] + "<br>";
text += cars[2] + "<br>";
text += cars[3] + "<br>";
text += cars[4] + "<br>";
text += cars[5] + "<br>";
REPETITION!!!
Javascript 101
The Basics: control structures
For loops: DRY
for (i = 0; i < cars.length; i++) {
    text += cars[i] + "<br>";
}
Javascript 101
The Basics: control structures
Nested Loops
Javascript 101
The Basics: The Dom
<!DOCTYPE html>
<html>
<head>
    <title>Page Title</title>
</head>
<body>

<h1 id="heading">This is a Heading</h1>
<p class="paragraph">This is a paragraph.</p>

</body>
</html>
Document Object Model!
Javascript 101
The Basics: CSS
<!DOCTYPE html>
<html>
<head>
    <title>Page Title</title>
</head>
<body>

<h1 id="heading">This is a Heading</h1>
<p class="paragraph">This is a paragraph.</p>

</body>
</html>
Just a smidge...
Javascript 101
The Basics: CSS
<!DOCTYPE html>
<html>
<head>
    <title>Page Title</title>
</head>
<body>

<h1 id="heading">This is a Heading</h1>
<p class="paragraph">This is a paragraph.</p>

</body>
</html>
Just a smidge...
#heading
.paragraph
Javascript 101
The Basics: THE DOM
OK, so back to the DOM
D3
d3!
D3
d3js.org
“D3 allows you to bind arbitrary data to a Document Object Model (DOM), and then apply data-driven transformations to the document. For example, you can use D3 to generate an HTML table from an array of numbers. Or, use the same data to create an interactive SVG bar chart with smooth transitions and interaction.”
D3
d3 and Selections
var paragraphs = document.getElementsByTagName("p");
for (var i = 0; i < paragraphs.length; i++) {
  var paragraph = paragraphs.item(i);
  paragraph.style.setProperty("color", "white", null);
}
D3
d3 and Selections
var paragraphs = document.getElementsByTagName("p");
for (var i = 0; i < paragraphs.length; i++) {
  var paragraph = paragraphs.item(i);
  paragraph.style.setProperty("color", "white", null);
}$("p").css("color","white");jQuery
D3
d3 and Selections
var paragraphs = document.getElementsByTagName("p");
for (var i = 0; i < paragraphs.length; i++) {
  var paragraph = paragraphs.item(i);
  paragraph.style.setProperty("color", "white", null);
}$("p").css("color","white");d3.selectAll("p").style("color", "white");
jQuery
d3
D3
d3 and Selections
Lorem ipsum!
D3
d3 and Selections
Lorem ipsum!
D3
d3 and Web Standards
- HTML
- CSS
- SVG
D3
d3: Bar Chart
var width = 420,
    barHeight = 20;

var x = d3.scale.linear()
    .range([0, width]);

var chart = d3.select(".chart")
    .attr("width", width);

d3.tsv("data.tsv", type, function(error, data) {
  x.domain([0, d3.max(data, function(d) { return d.value; })]);

  chart.attr("height", barHeight * data.length);

  var bar = chart.selectAll("g")
      .data(data)
    .enter().append("g")
      .attr("transform", function(d, i) { return "translate(0," + i * barHeight + ")"; });

  bar.append("rect")
      .attr("width", function(d) { return x(d.value); })
      .attr("height", barHeight - 1);

  bar.append("text")
      .attr("x", function(d) { return x(d.value) - 3; })
      .attr("y", barHeight / 2)
      .attr("dy", ".35em")
      .text(function(d) { return d.value; });
});

function type(d) {
  d.value = +d.value; // coerce to number
  return d;
}
THANK YOU!
Sonyl Nagale
sonyl@nagale.com
JavaScript for Data Visualization, 02/13/2017
By Sonyl Nagale