
Data Visualization
Dades obertes per al teu TR
Instituts Rubí

Eli Vivas
eli@storydata.cat
Twitter @eli_vivas | @storydatabcn
IG @storydata
Infografía vs Dataviz
Infografia


Germanwings flight-Inconsolata
Storytelling and Data Visualization

Storytelling and Data Visualization
Visualització de dades


Translation of raw data to a visual context
Storytelling and Data Visualization

Charles Minard, 1869
Storytelling and Data Visualization
Visualització de dades


Storytelling and Data Visualization
Visualització de dades
Qualitatius
Quantitatius
Híbrid
1
2
3
4
52,9%
1
2
3
Tipus
¿Per a què serveix?
- Detectar patrons
- Interacció
- Explorar
- Personalizar
- Analitzar en profunditat
Storytelling and Data Visualization
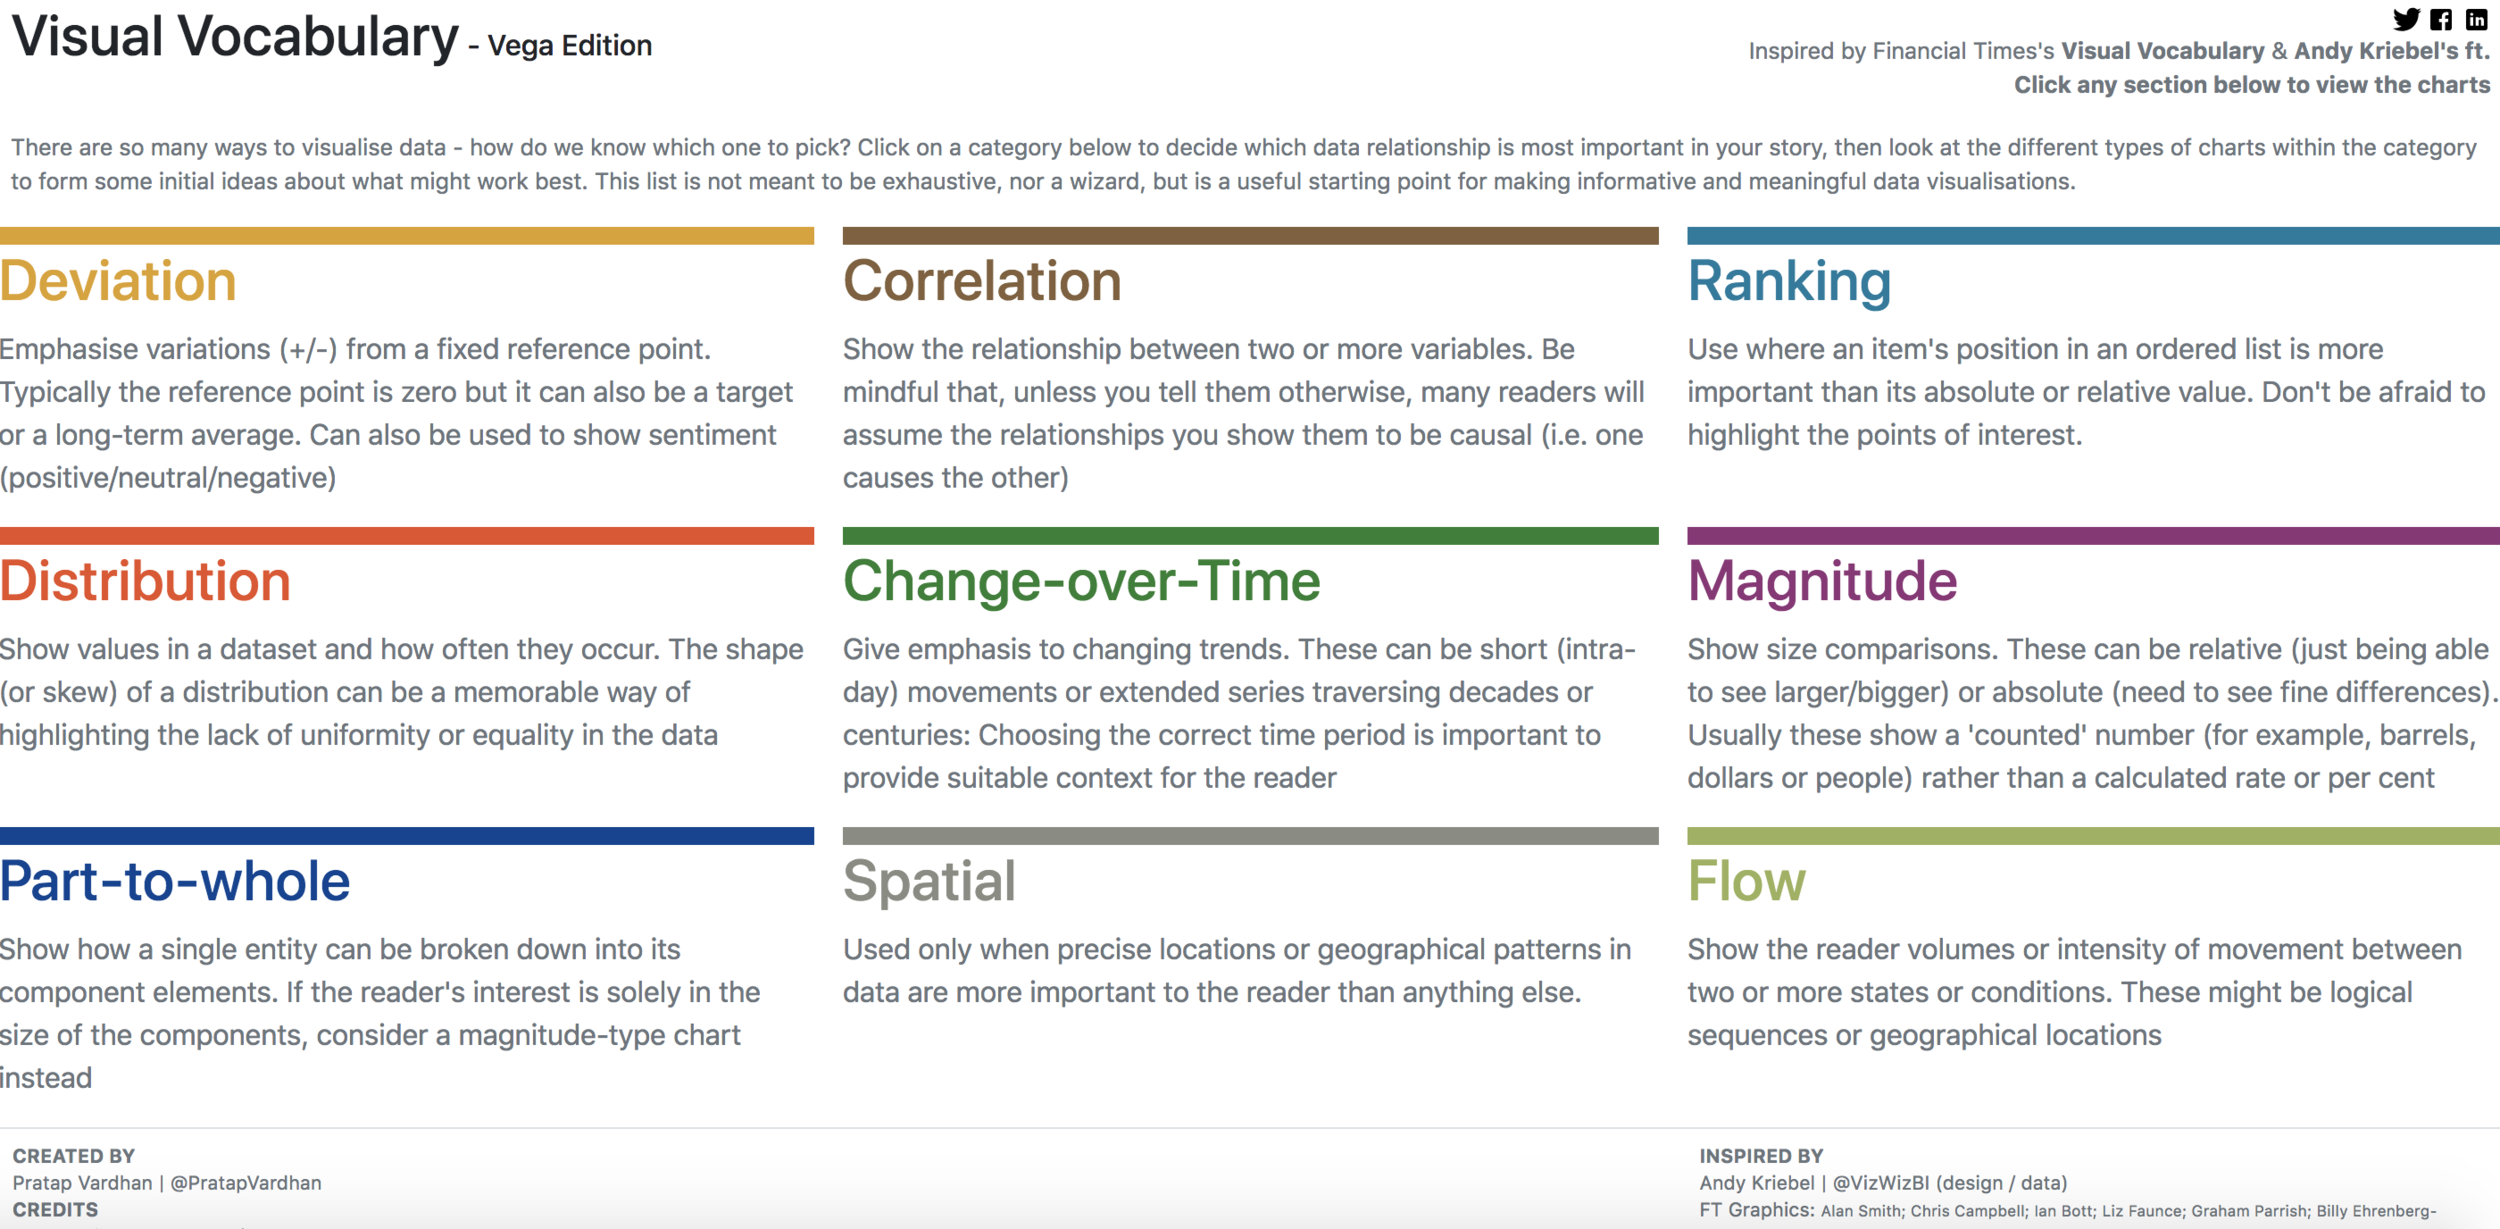
1.- Tipus de
Data Visualizations
Storytelling and Data Visualization
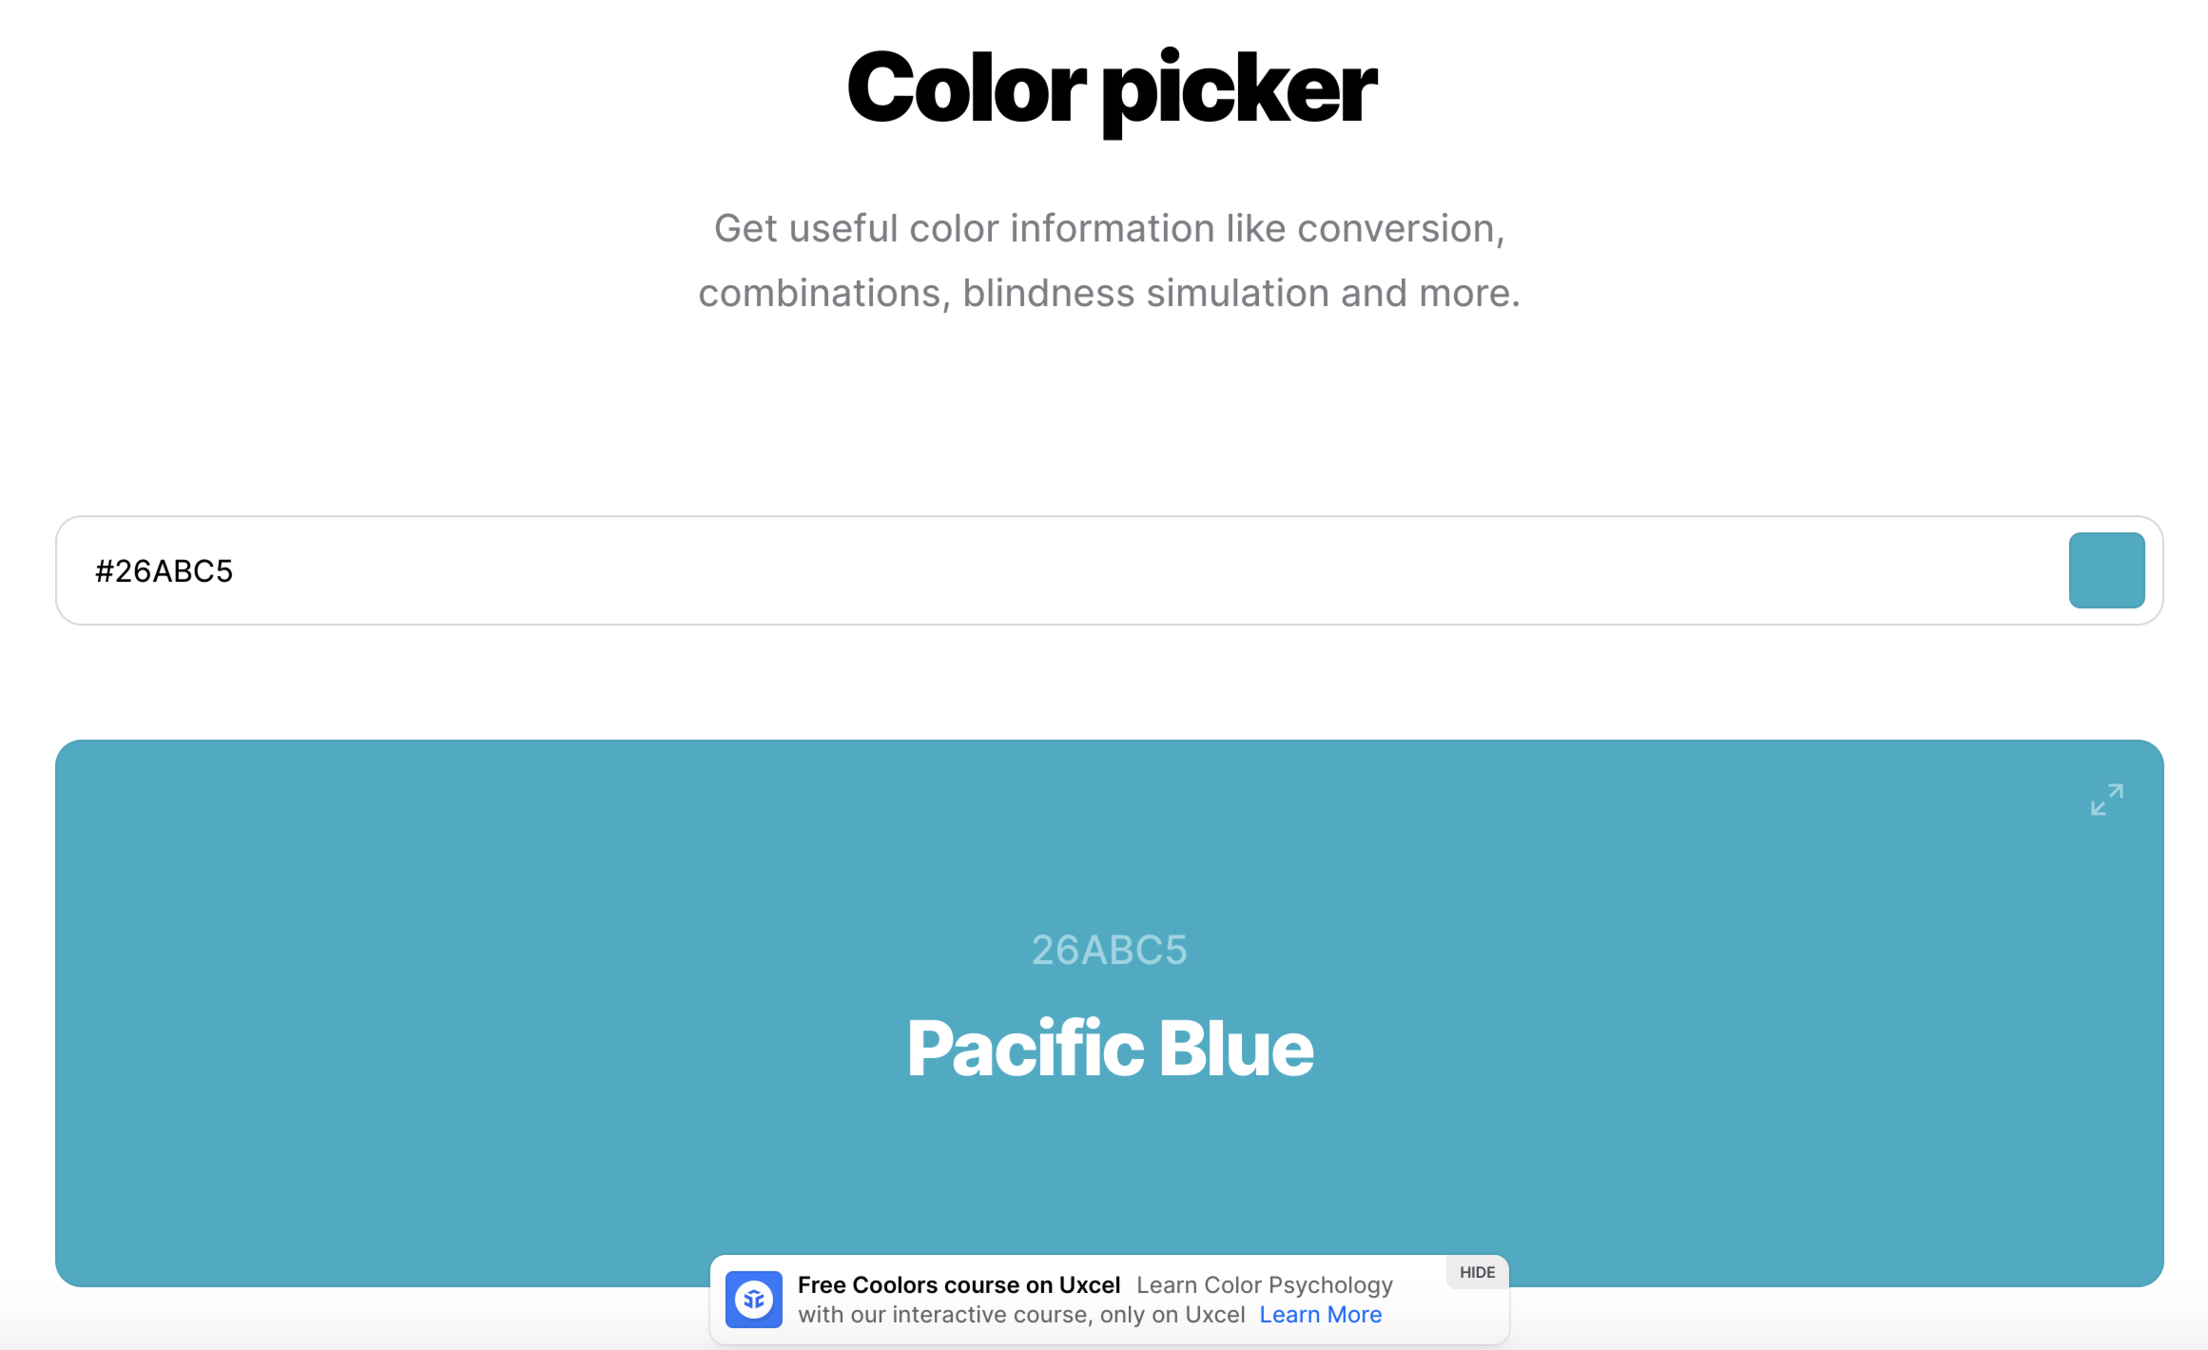
2. Color
(existeix un codi, i no és un llenguatge de programació)
Storytelling and Data Visualization
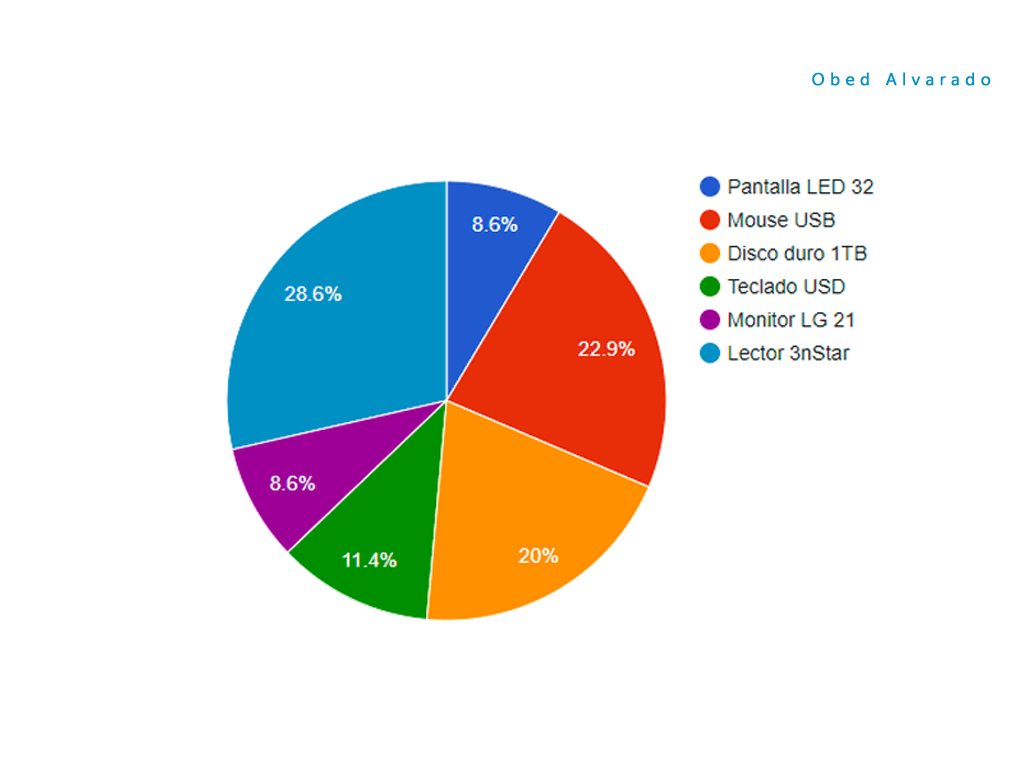
- No més de 5 colors en un chart
- El gris, el teu millor amic
- Fes servir colors intuitius (però fuig dels estereotips Men-Women)
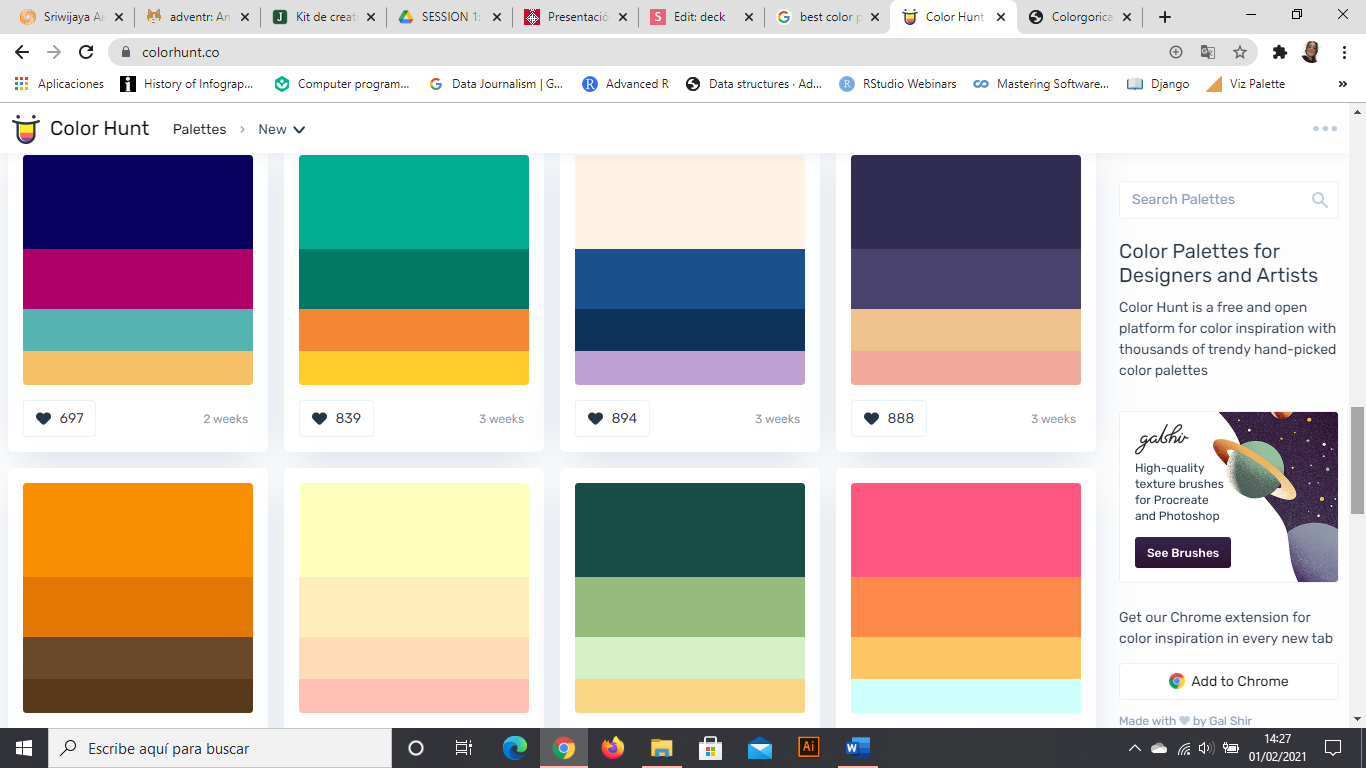
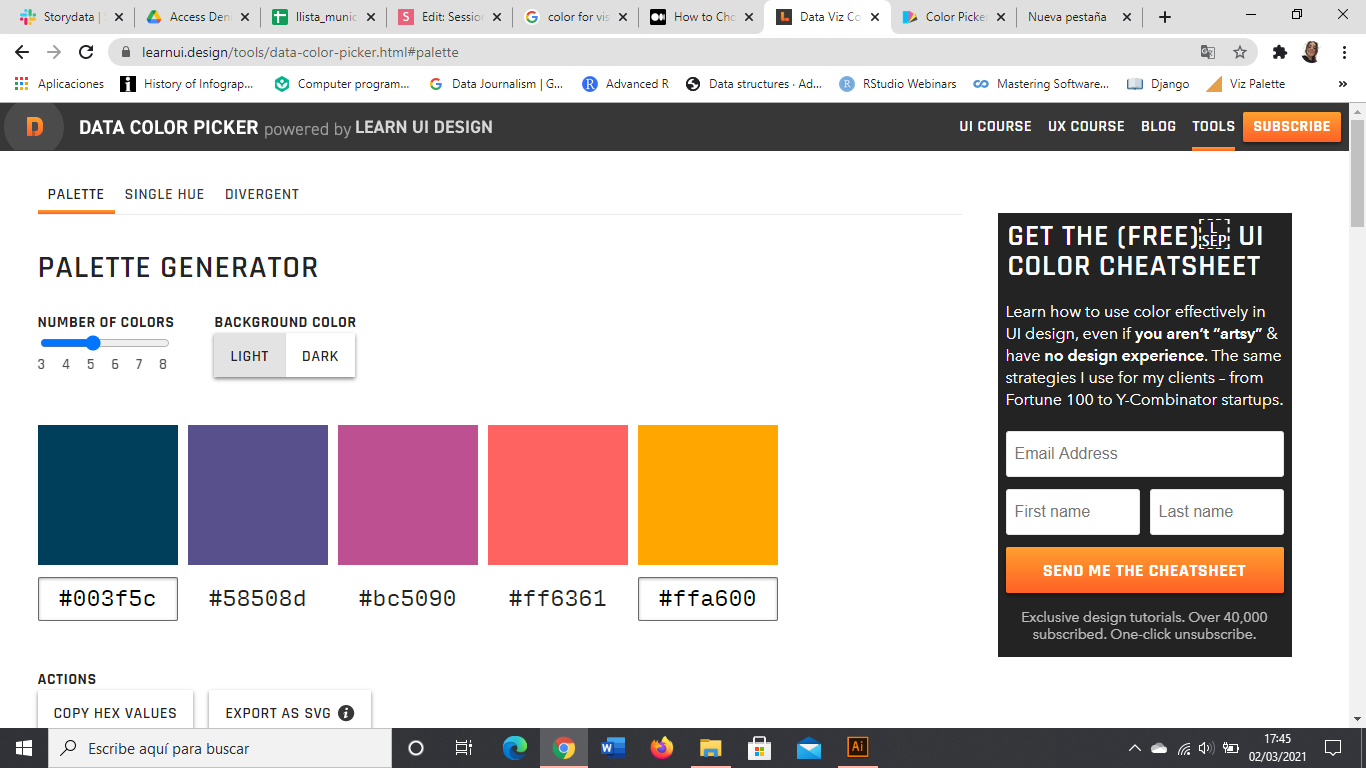
- Fes servir paletes de colors; funcionen


2. ÚS DEL COLOR
Storytelling and Data Visualization
Infographics and Data Visualization
2. ÚS DEL COLOR
3. Resalta el que és important
(ho vols explicar tot, però pots saturar al personal)

Storytelling and Data Visualization
Storytelling and Data Visualization
2 4 3 5 6 4 3 7 6 5 3
4 3 4 5 4 1 3 2 8 9 7
5 4 6 7 2 1 5 0 6 5 4
2 6 7 8 9 3 1 2 4 0 1
5 3 4 0 9 2 5 4 7 7 2
5 4 1 1 2 0 9 0 9 5 6
2 4 3 5 6 4 3 7 6 5 3
4 3 4 5 4 1 3 2 8 9 7
5 4 6 7 2 1 5 0 6 5 4
2 6 7 8 9 3 1 2 4 0 1
5 3 4 0 9 2 5 4 7 7 2
5 4 1 1 2 0 9 0 9 5 6
2 4 3 5 6 4 3 7 6 5 3
4 3 4 5 4 1 3 2 8 9 7
5 4 6 7 2 1 5 0 6 5 4
2 6 7 8 9 3 1 2 4 0 1
5 3 4 0 9 2 5 4 7 7 2
5 4 1 1 2 0 9 0 9 5 6
Títol (descripció del gràfic)
Subtítol (anys, mesures)
Font (amb link). Autor. ** Notes
3. No t'oblidis de cap element
Storytelling and Data Visualization
Text

Awesome title
Subtitle that contextualizes
Axis text
Axis text
Axis text
Axis text
Axis text
Axis text
Axis text
Caption with the source and who created the chart. Notes if necessary
Legend text
Legend text
Legend title
Axis y title
Axis x title
Storytelling and Data Visualization

4. Afegeix context
Storytelling and Data Visualization
4. Afegeix context
Source: Google News Timeline
Pors públiques en els mitjans
Swine Flu
Bird Flu
Killer Wasps
Apocalypse
2000
Storytelling and Data Visualization
5. Juga amb la tipografia
(però fins a un cert punt)
- Defineix UNA tipografia (o consulta el manual corporatiu)
- Juga con els estils per fixar L'ATENCIÓ
- Jerarquitza la informació per la mida
Storytelling and Data Visualization
Storytelling and Data Visualization
"Think about subway maps, which are abstracted from the complex shape of the city and are focused on the rider’s goal: to get from one place to the next"
Visualizing Data by Ben Fry
5. Fes simple la complexitat
Storytelling and Data Visualization

Medium Infogram
5. Fes simple la complexitat
6. Alinia tot amb tot
(i ordena, ordena, ordena)
Storytelling and Data Visualization

...sempre que puguis


Medium Infogram
7. COMENÇA L'AXIS EN 0
Storytelling and Data Visualization

via Víctor Pascual
8. ¡ULL AMB LES COMPARACIONS!
Storytelling and Data Visualization

via Víctor Pascual
Storytelling and Data Visualization

via Víctor Pascual
Storytelling and Data Visualization

via Víctor Pascual
Storytelling and Data Visualization

via Víctor Pascual
Storytelling and Data Visualization
Storytelling and Data Visualization

2022
65,87%
2013
16,2%
Tràfic per a mòvil:
9. MOBILE FIRST
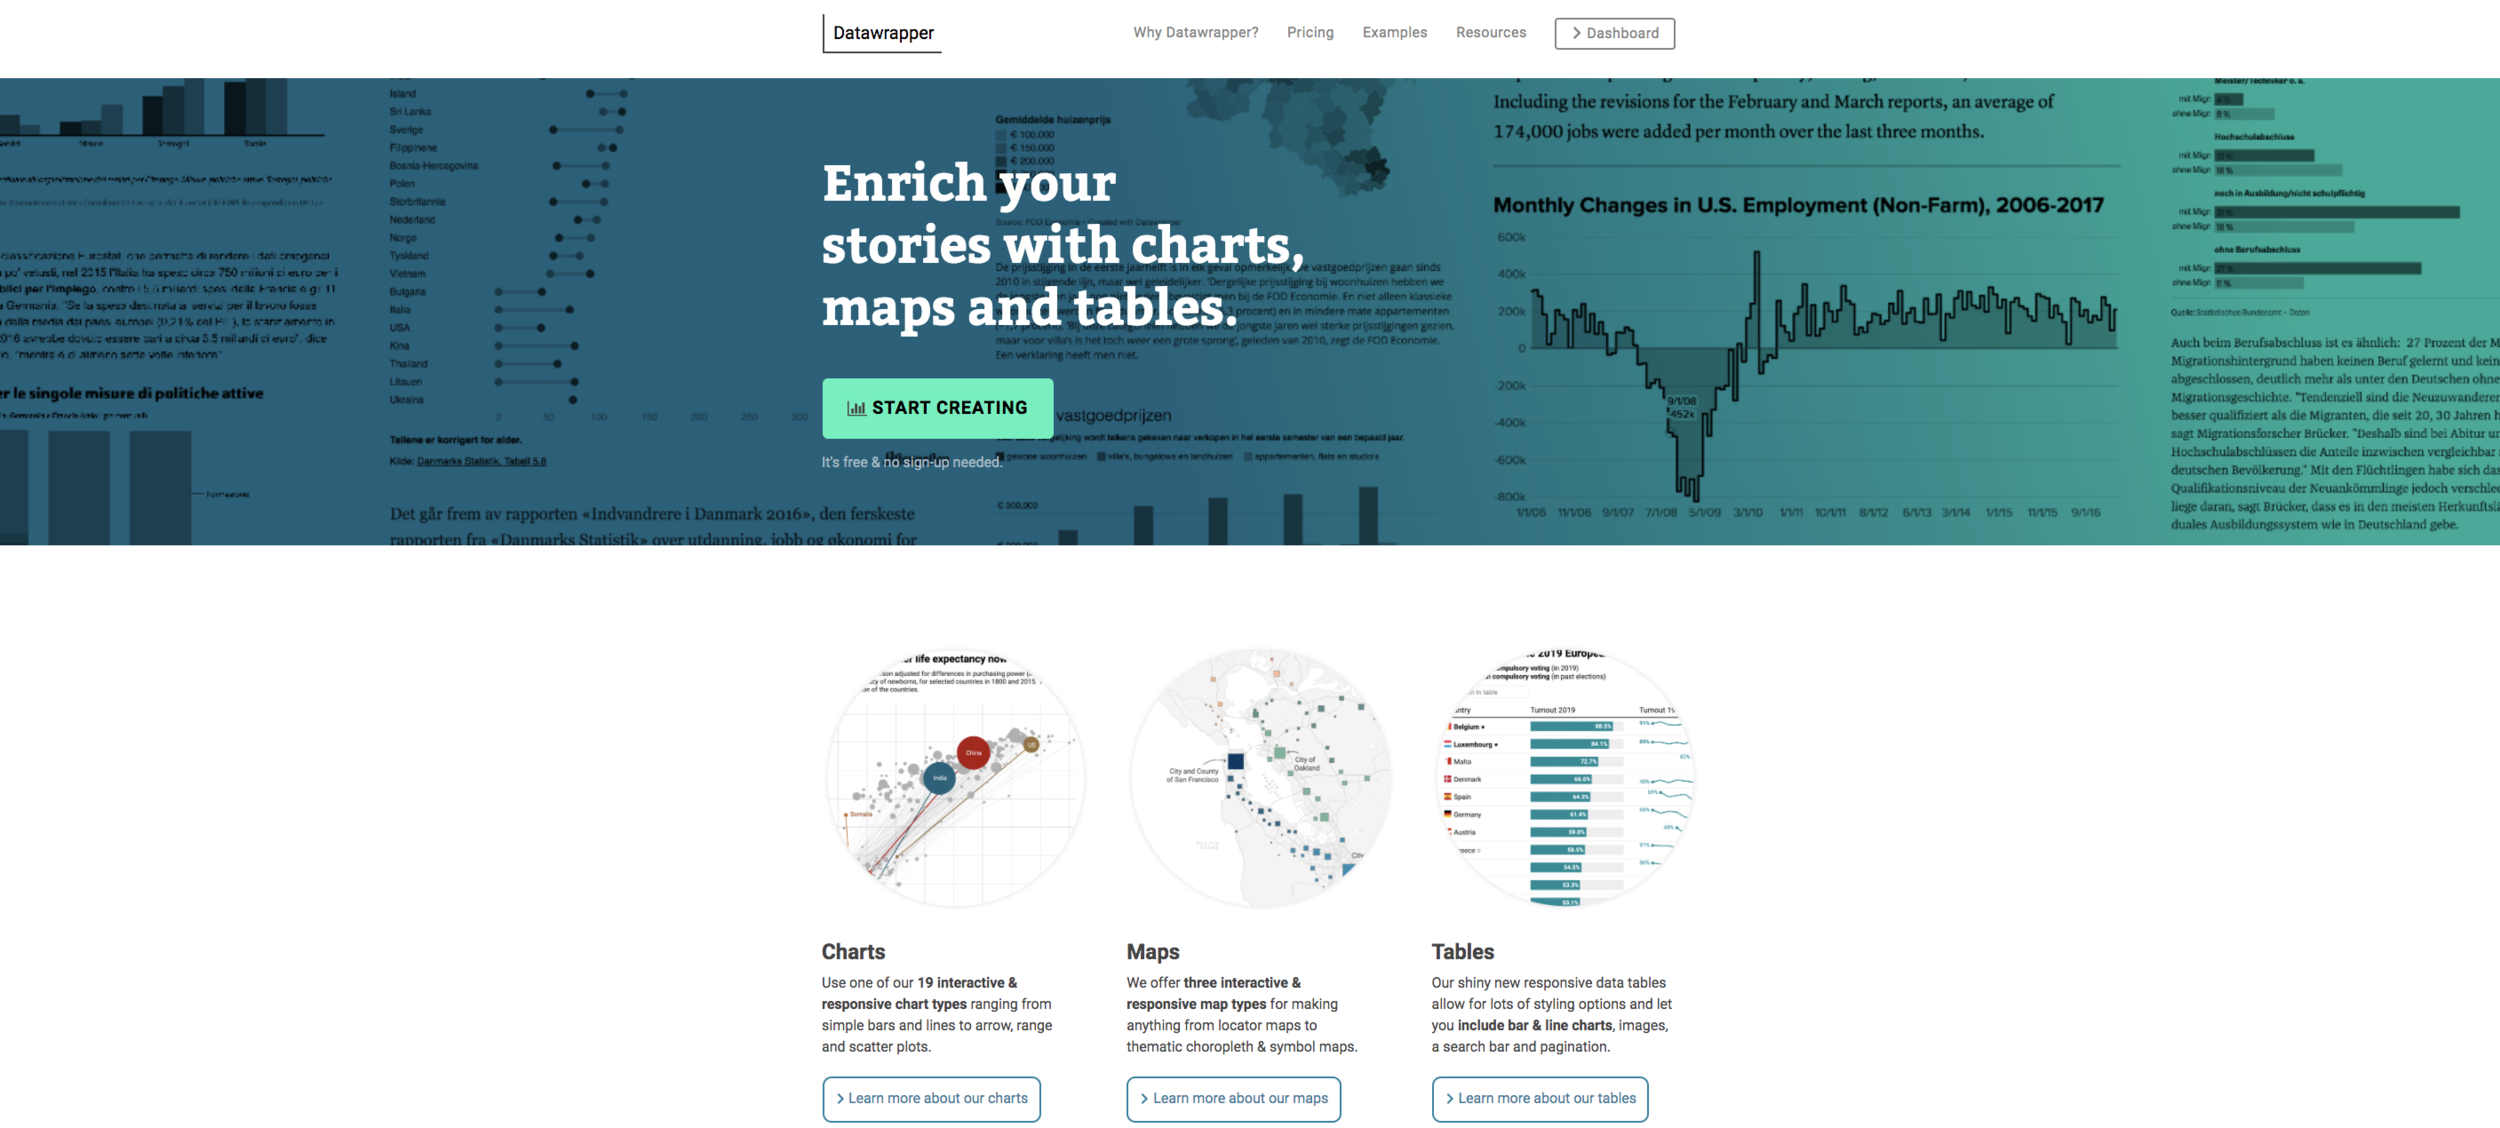
Sense codi & gratis & fàcils
NO CODING & FREE &
NOT THAT EASY


10.-Eines

Storytelling and Data Visualization


¿I això, com es fa?
1 exercici
Login a Datawrapper
Storytelling and Data Visualization


1

Mestís

2
Pastor alemany

3
Terrier de yorkshire


Gràfics amb Flourish
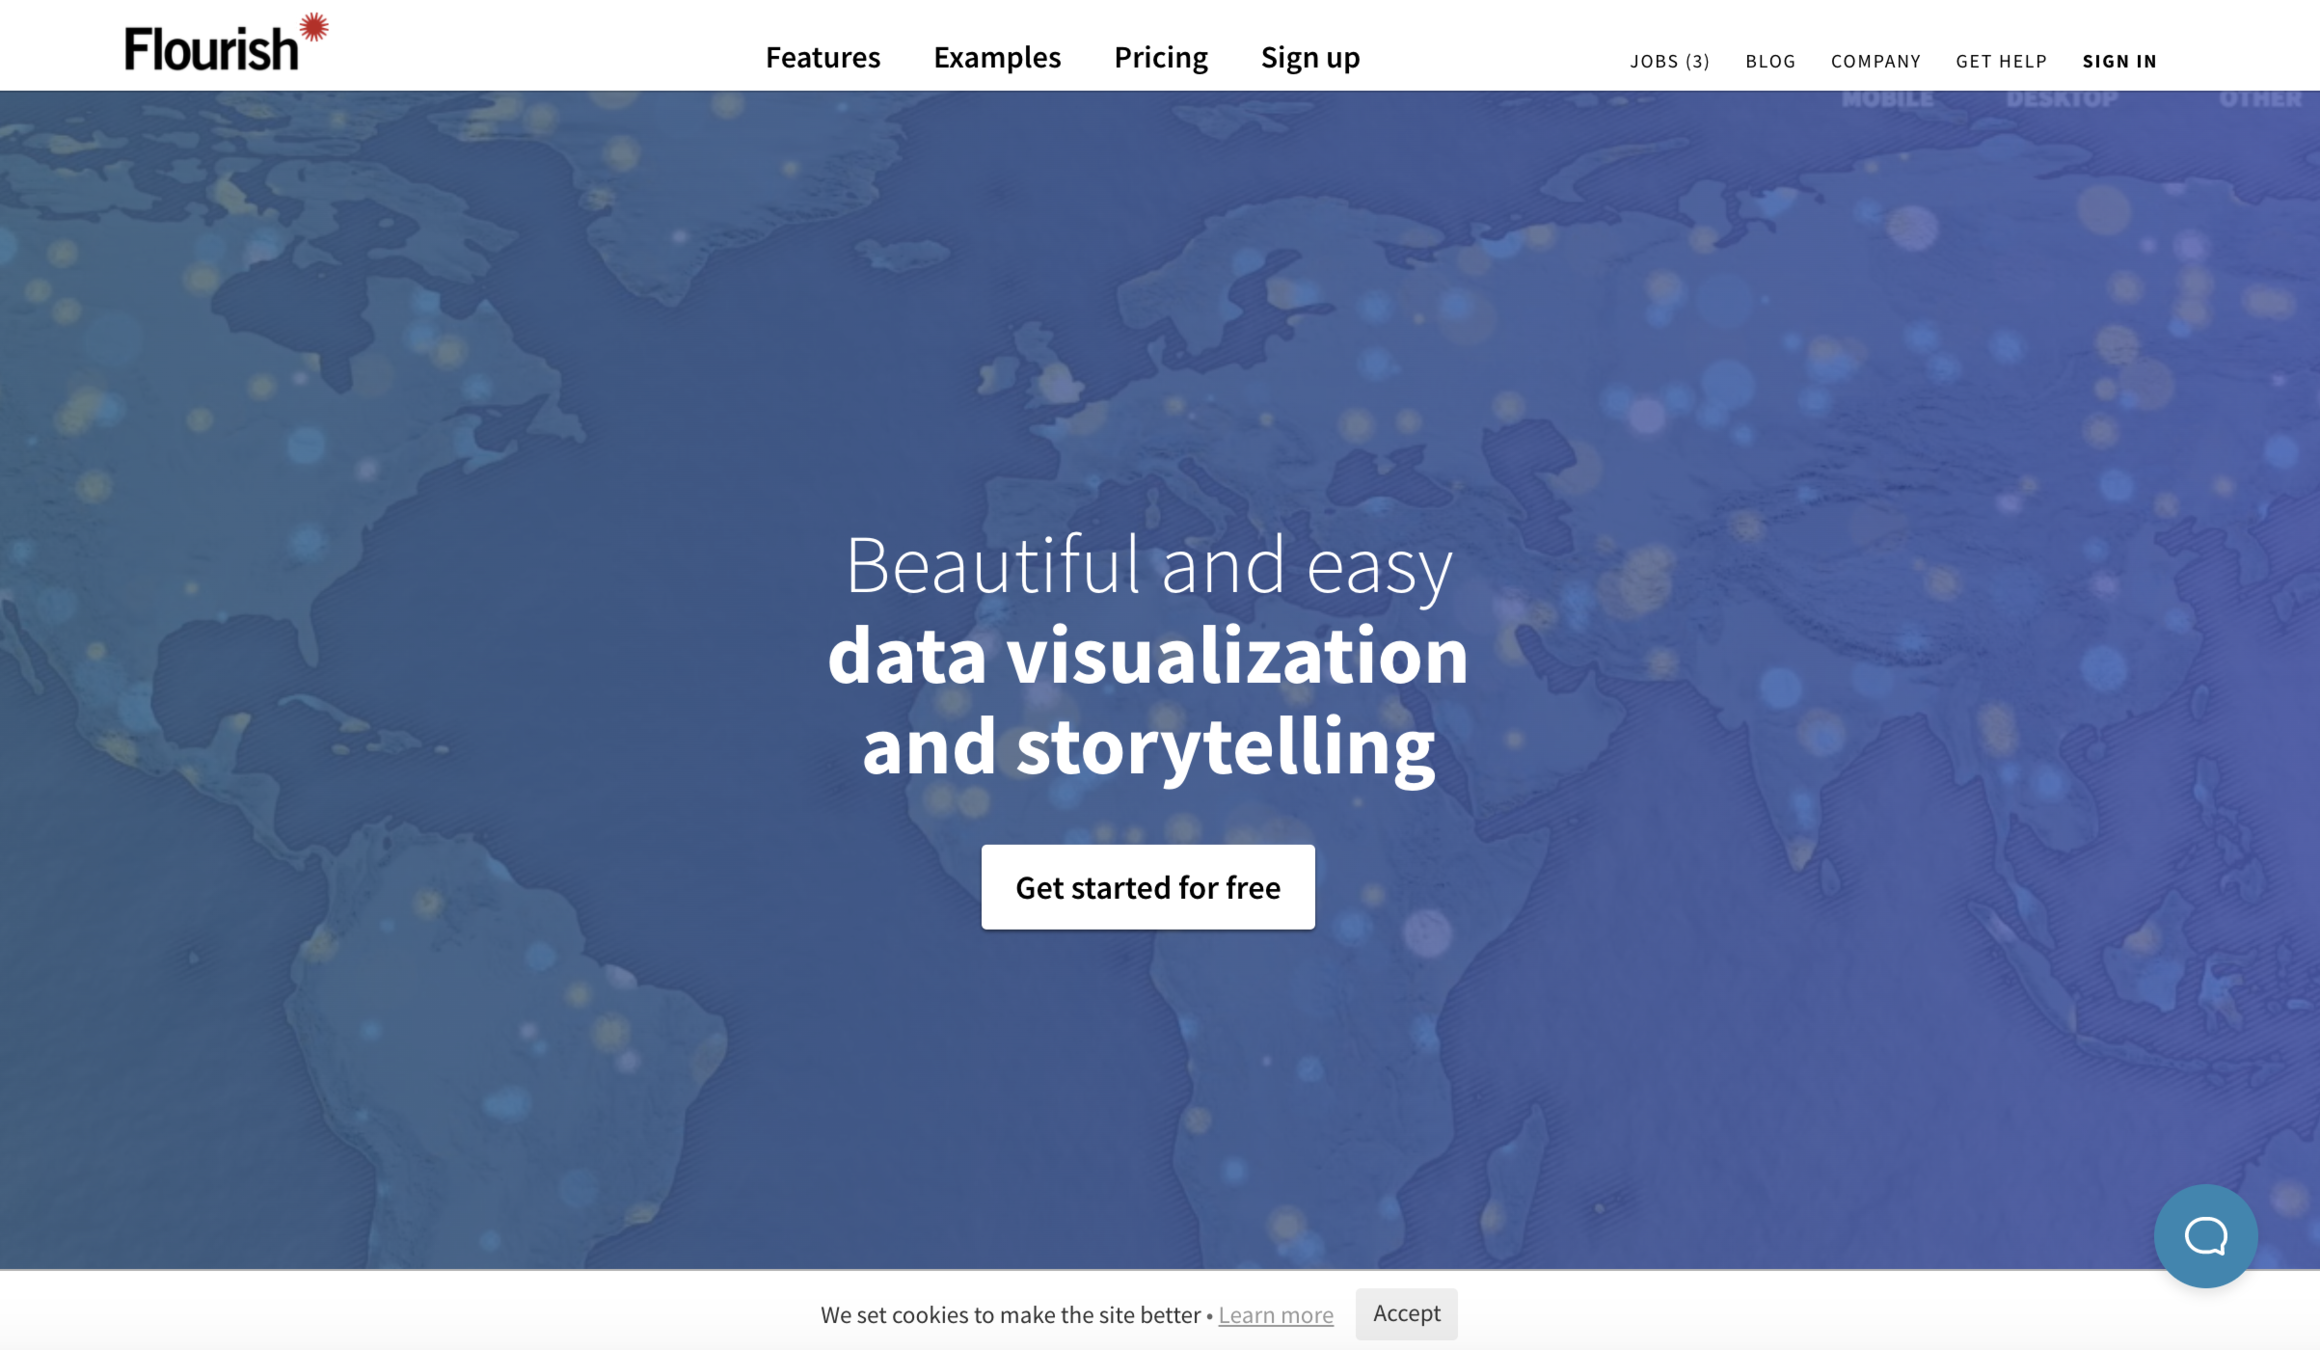
Storytelling and Data Visualization
MAPES
TIPUS
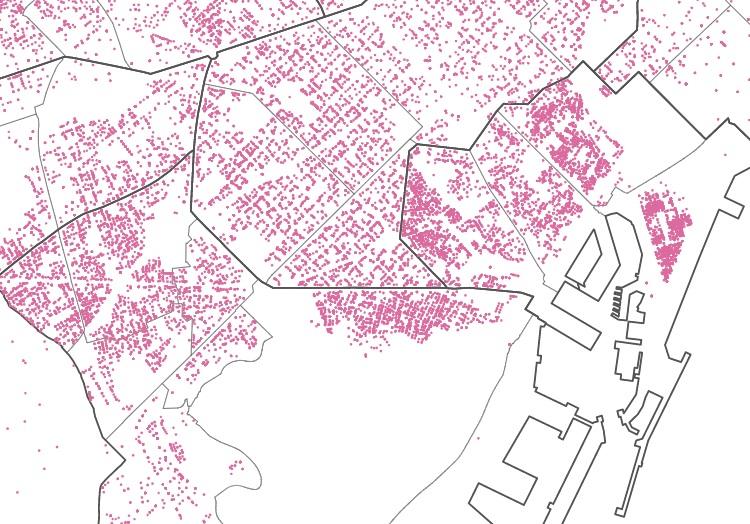
PUNTS

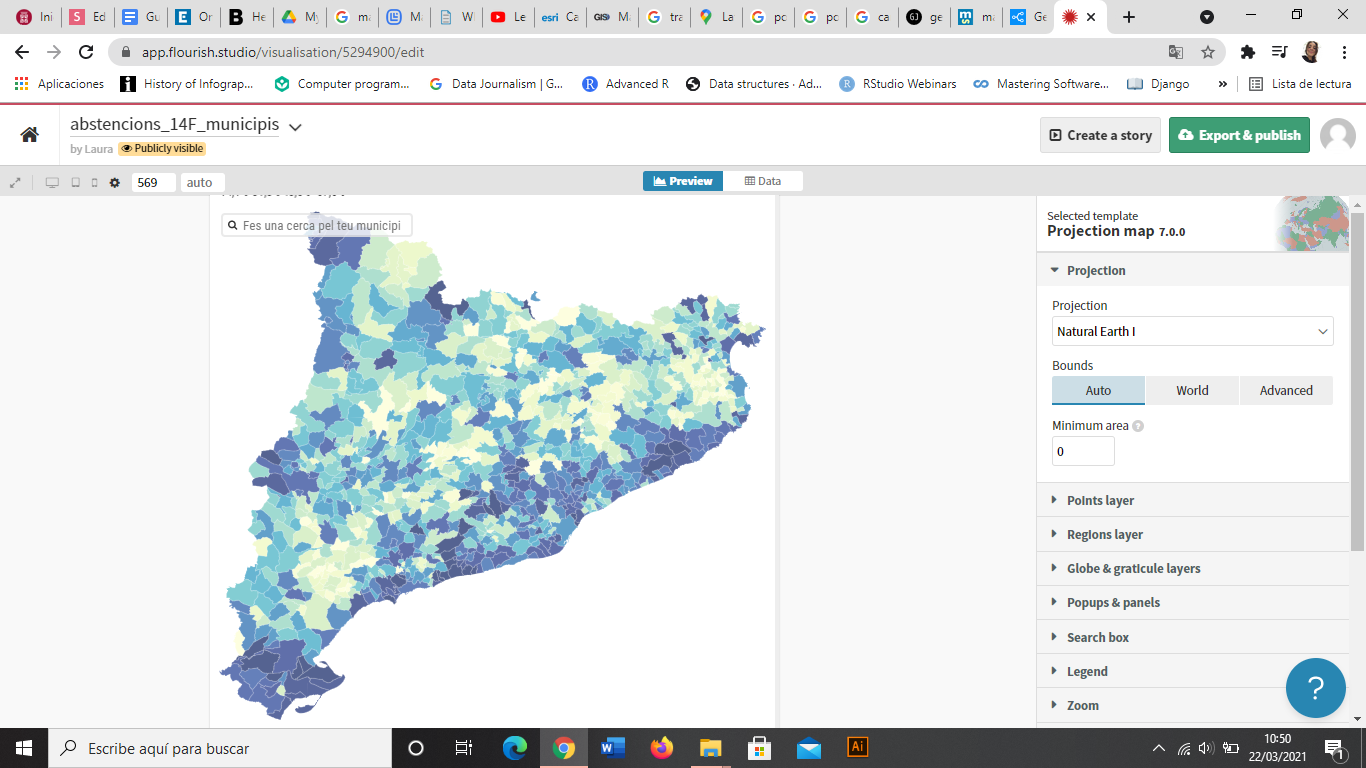
COROPLETES
BOMBOLLES

CALOR


FLUXES

HEX BINING
Storytelling and Data Visualization
MAPES
| Latitude | Longitude | name |
|---|---|---|
| 42.061201860 | -0.490321024 | point1 |
| 38.887787884 | -1.537996281 | point2 |
| 38.696322447 | -9.137571576 | point3 |
| geometry | name |
|---|---|
| polygon | region1 |
| multipolygon | region2 |
| polygon | region3 |
Storytelling and Data Visualization
Storytelling and Data Visualization
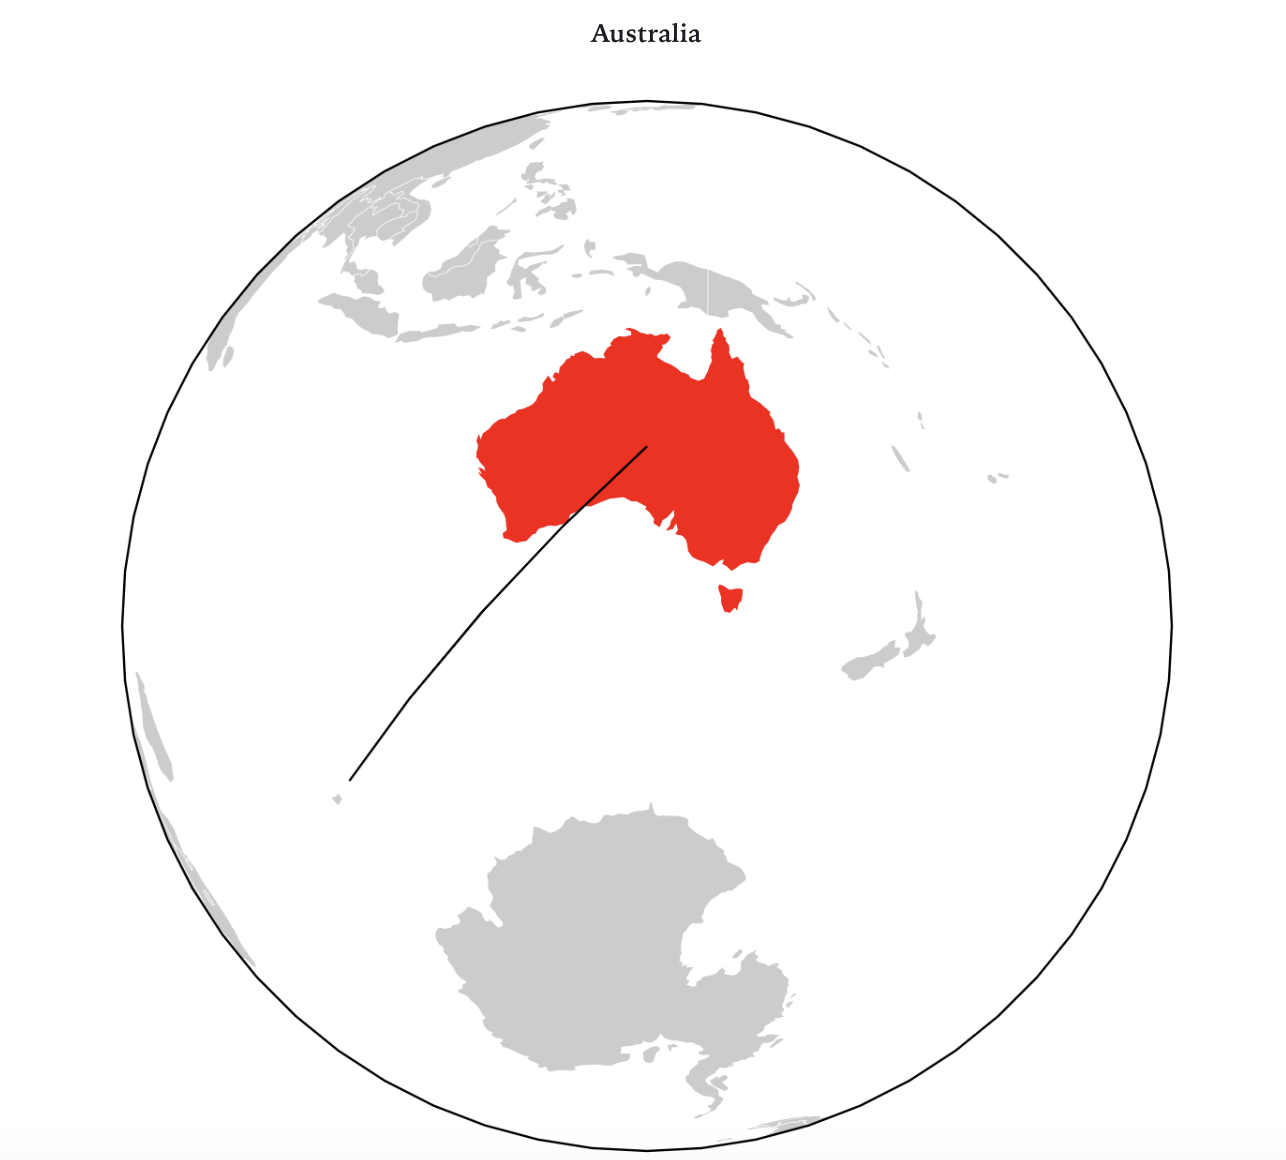
MAPES
Les dades geoespacials dibuixen punts o formes, i emmagatzemen informació per cadascun dels punts o regions

Geolocalitzar
- Latitud
- Longitud
Storytelling and Data Visualization
Coropletas
Storytelling and Data Visualization
Geoportal
Geoportal

Altres recursos
· Statistics Division of the UN:
http://data.un.org/
· Google Dataset Search:
https://datasetsearch.research.google.com/
· WHO Database:
https://www.who.int/data
· National Stastistics Institute:
https://www.ine.es/
· Kaggle:
https://www.kaggle.com/
Fonts de dades
Storytelling and Data Visualization
· The World Bank
https://maps.worldbank.org/
Dades geospacials
· Map SVG:
https://mapsvg.com/maps/world
· Geographical Institutes websites / Open Data:
http://centrodedescargas.cnig.es/CentroDescargas/index.jsp
Gràcies
eli@storydata.cat
Twitter @eli_vivas | @storydatabcn
IG @storydata
Copy of Storytelling & Dataviz Ajuntament Rubí
By Storydata


