eli@storydata.cat
Storytelling &
Data Visualization


- Project in residence at the Area Tallers
Infografia vs Dataviz

Infografia


Germanwings flight-Inconsolata
Infografia


Visualització de dades
A graphical representation of data or concepts, which is either an internal construct of the mind or an external artifact supporting decision making
C. Ware 2000
Visualització de dades


Translació de dades a un contex visual

Charles Minard, 1869
Visualització de dades


Visualització de dades
Dades

INFOGRAPHICS
Cualitativa
Cuantitativa
Híbrida
1
2
3
4
52,9%
1
2
3
Per a què serveix?
- detectar patrons
- interacció
- explorar
- personalizar
- analitzar en profunditat
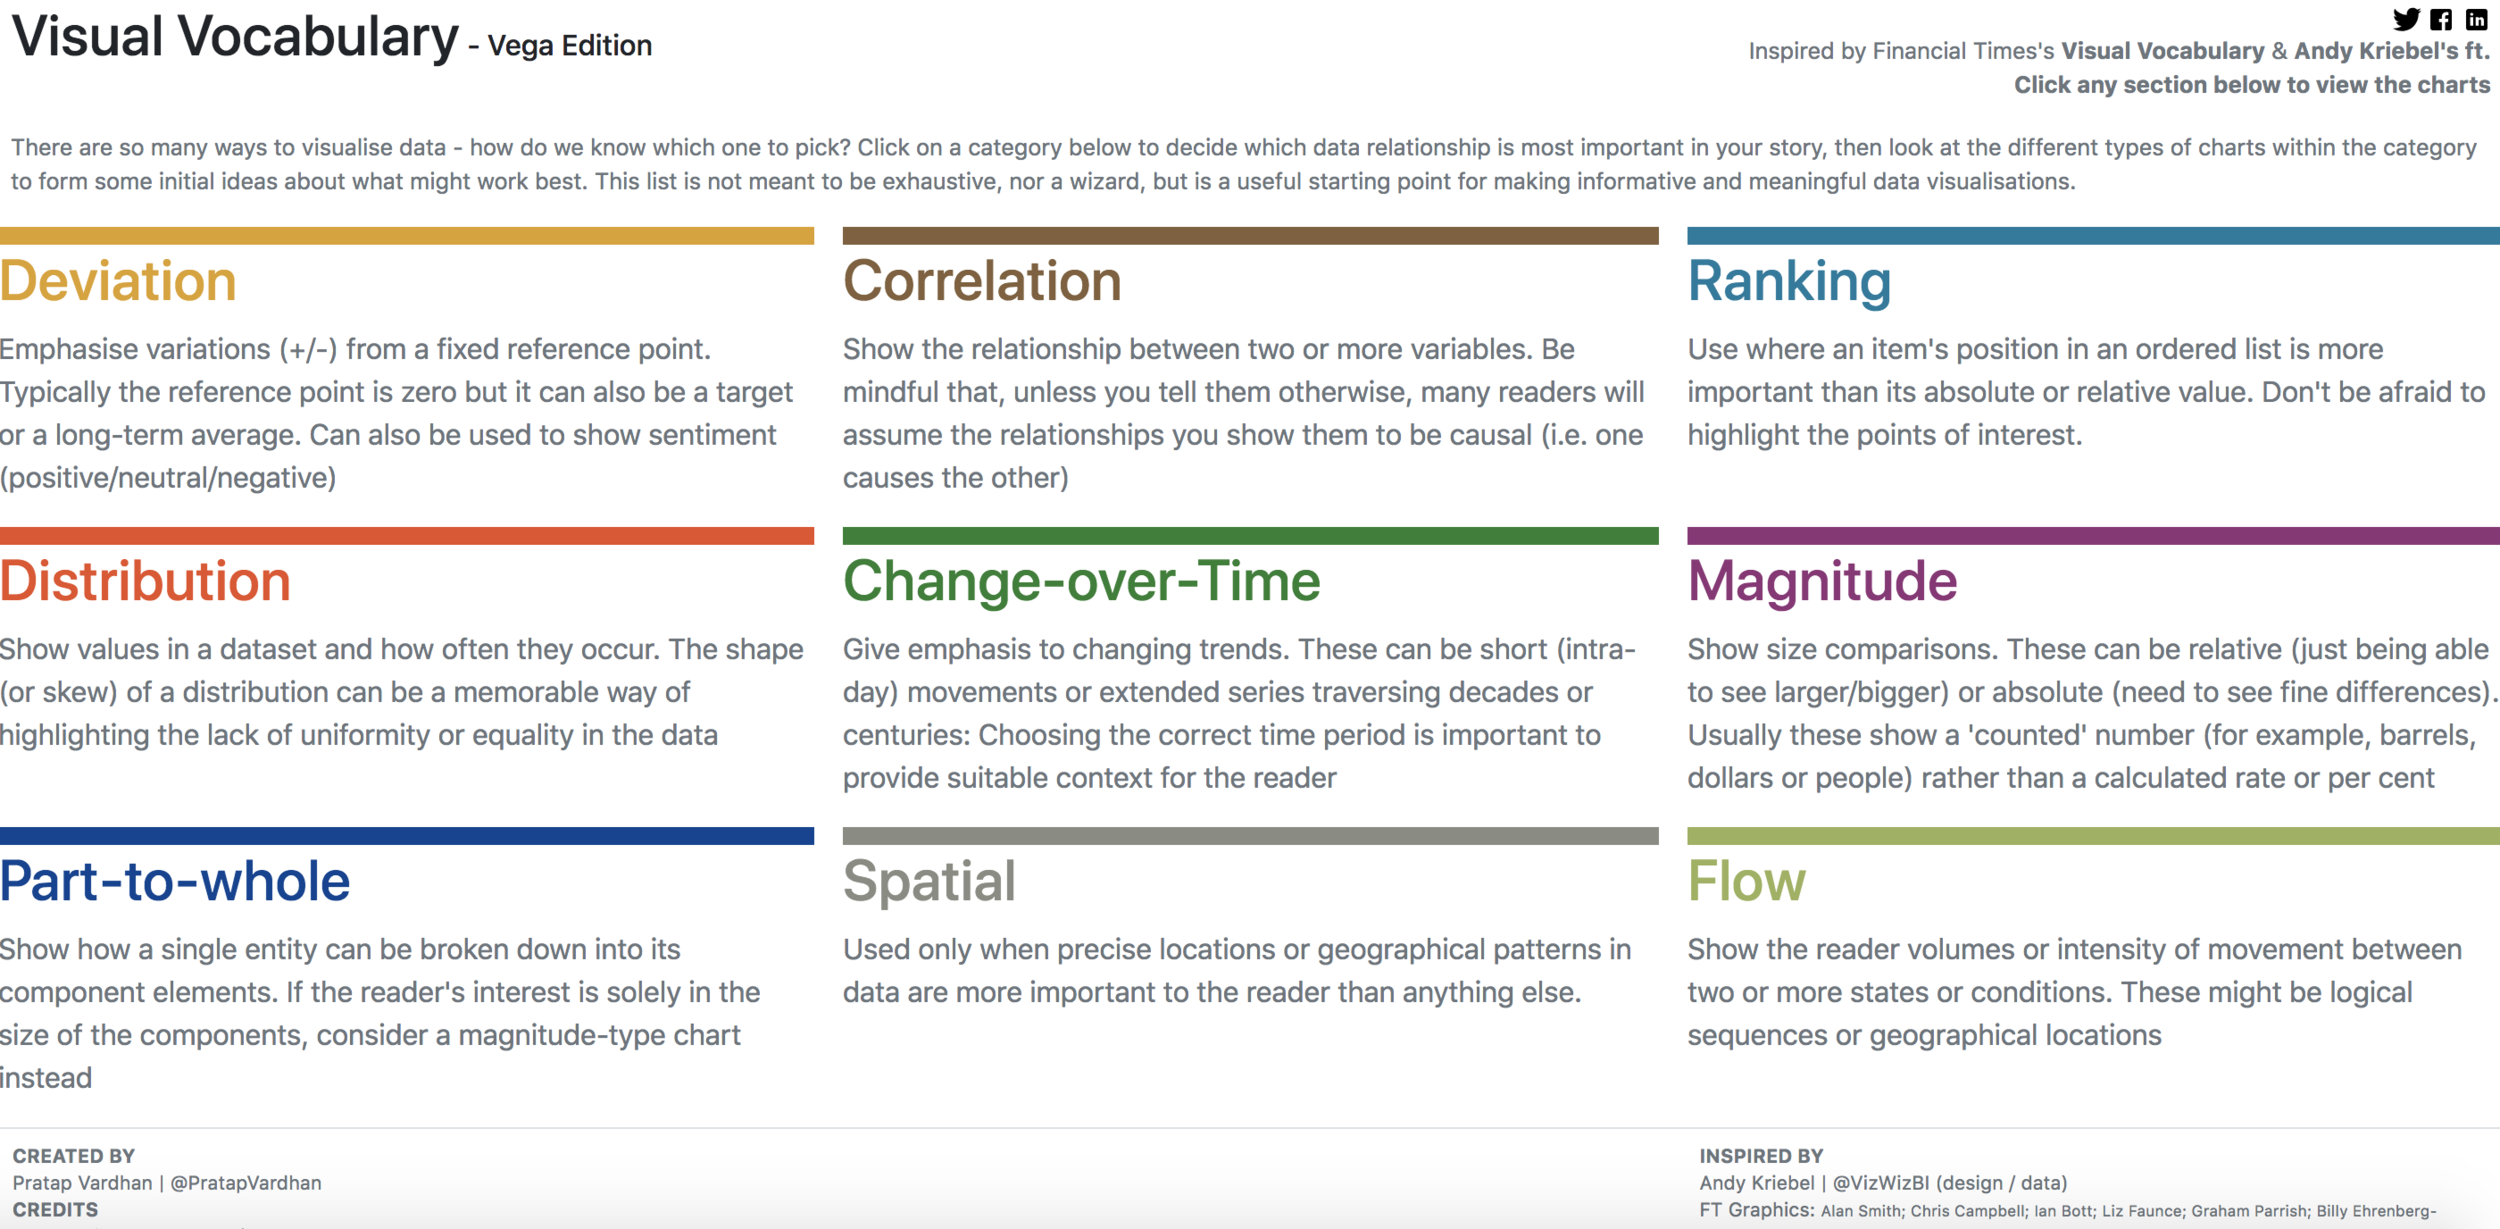
1.- Tipus de charts
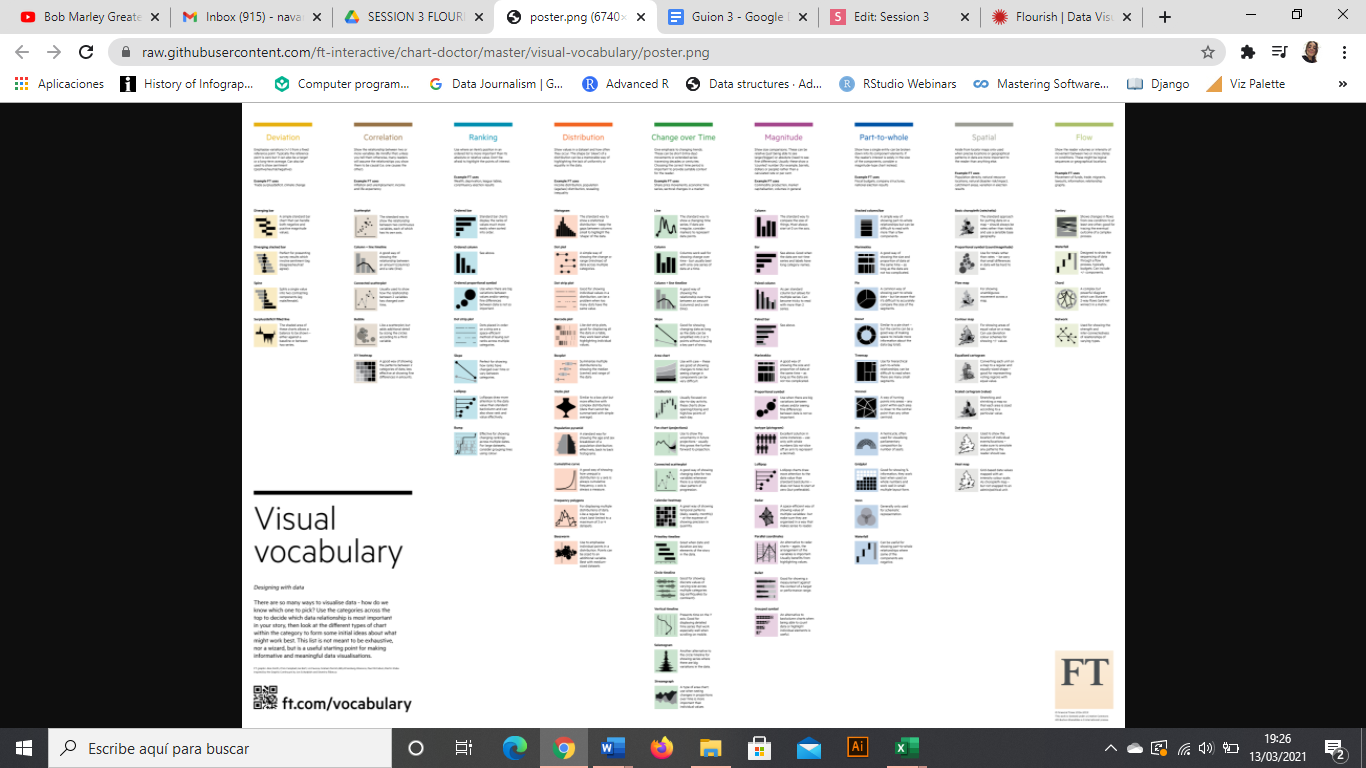
1.- Tipus de gràfics
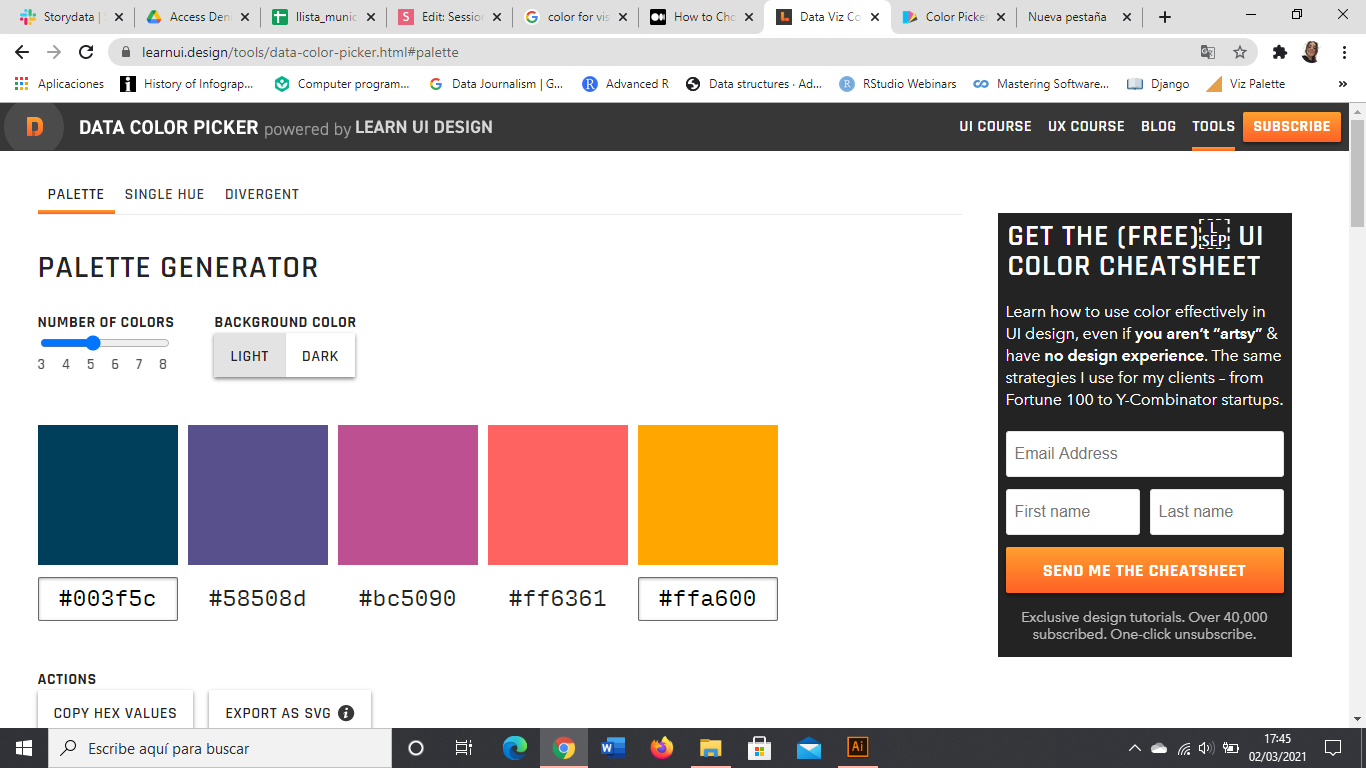
2. Color
- No més de 7 colors en un gràfic
- El gris, el teu millor amic
- Fes servir colors intuitius (pero fuig dels estereotips Home-Dona)
- Fes servir paletes de colors; funcionen!


2. US DEL COLOR
2. US DEL COLOR
3. Resalta el que és important
(ho vols explicar tot en un gràfic, pero no saturis al personal)

2 4 3 5 6 4 3 7 6 5 3
4 3 4 5 4 1 3 2 8 9 7
5 4 6 7 2 1 5 0 6 5 4
2 6 7 8 9 3 1 2 4 0 1
5 3 4 0 9 2 5 4 7 7 2
5 4 1 1 2 0 9 0 9 5 6
2 4 3 5 6 4 3 7 6 5 3
4 3 4 5 4 1 3 2 8 9 7
5 4 6 7 2 1 5 0 6 5 4
2 6 7 8 9 3 1 2 4 0 1
5 3 4 0 9 2 5 4 7 7 2
5 4 1 1 2 0 9 0 9 5 6
2 4 3 5 6 4 3 7 6 5 3
4 3 4 5 4 1 3 2 8 9 7
5 4 6 7 2 1 5 0 6 5 4
2 6 7 8 9 3 1 2 4 0 1
5 3 4 0 9 2 5 4 7 7 2
5 4 1 1 2 0 9 0 9 5 6

Titol memorable
Subtítol i context (anys, mesures)
Axis text
Axis text
Axis text
Axis text
Axis text
Axis text
Axis text
Caption with the source and who created the chart. Notes if necessary
Legend text
Legend text
Titol llegenda
Axis y títol
Axis x títol
Font. Autor. ** Notes
3. No t'oblidis cap element

4. Afegeix context
4. Afegeix context
Source: Google News Timeline
Pors públiques en els mitjans
Swine Flu
Bird Flu
Killer Wasps
Apocalypse
2000
5. Juga amb la tipografia
(però fins a un cert punt)
- Defineix UNA tipografia (o parla amb el maquetador)
- Juga amb els estils per fixar L'ATENCIÓ
- Jerarquitza la informació per la mida
"Think about subway maps, which are abstracted from the complex shape of the city and are focused on the rider’s goal: to get from one place to the next"
Visualizing Data by Ben Fry
5. Fes el complex, simple

Medium Infogram
5. Fes el complex, simple
6. Alinia tot amb tot
(i ordena, ordena, ordena)

Storytelling and Data Visualization
...si pots

6. Alinia tot amb tot
(i ordena, ordena, ordena)
...si pots


Medium Infogram
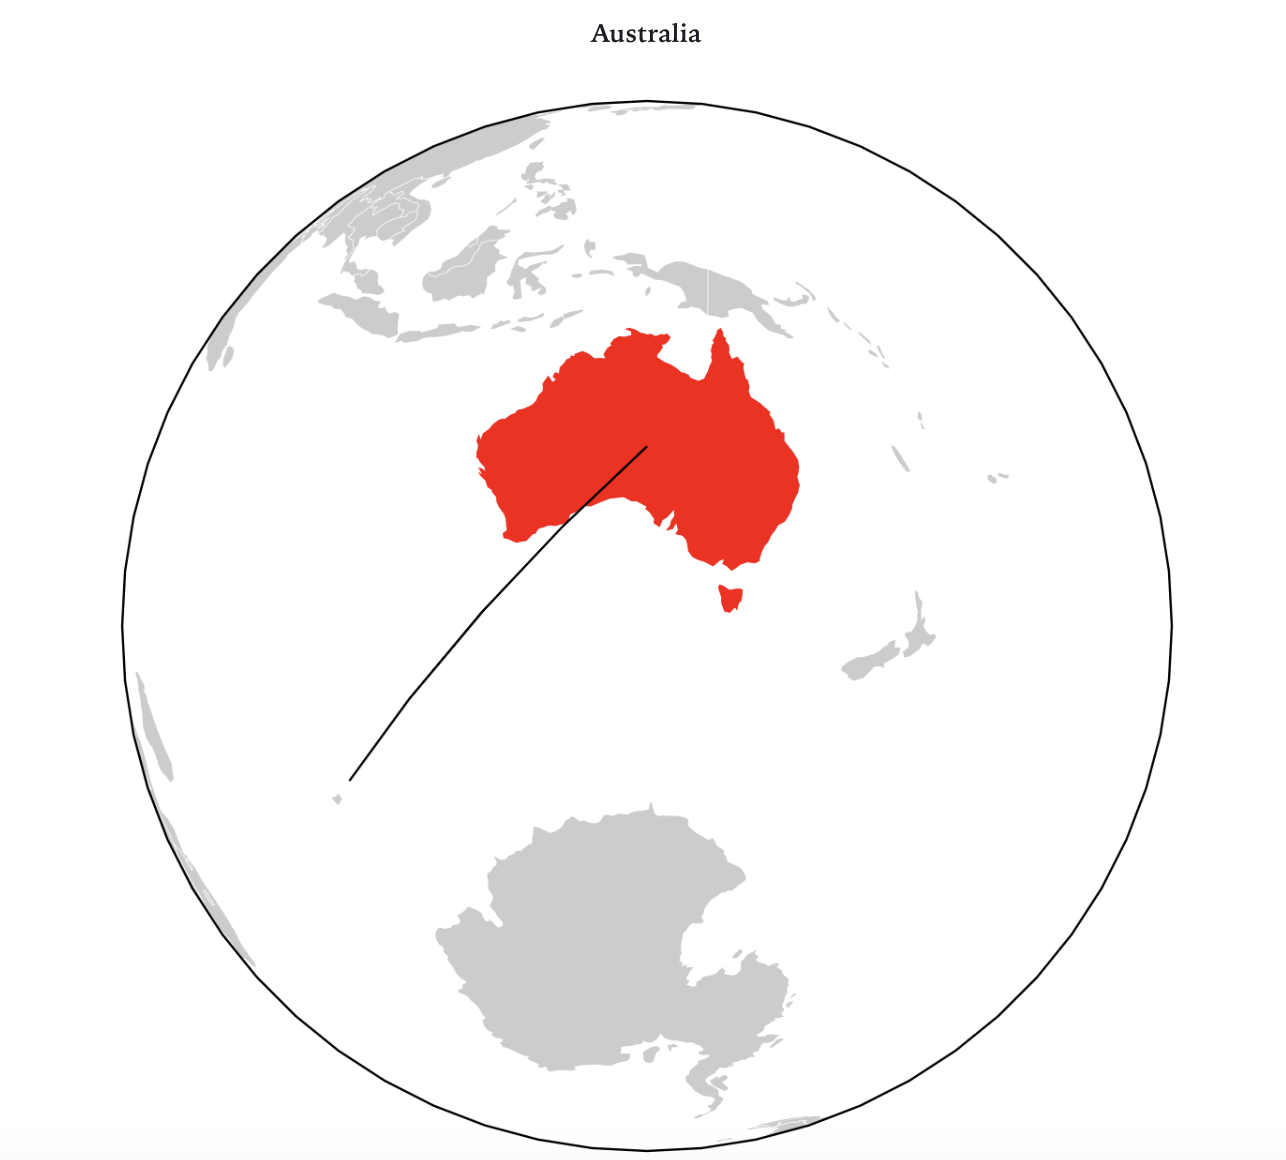
7. COMENÇA L'AXIS EN 0


via Víctor Pascual
8. ¡ULL AMB LES COMPARACIONS!

via Víctor Pascual

via Víctor Pascual

via Víctor Pascual

2022
66%
2012
25%
Tràfic per a mòbil:
9. MOBILE FIRST
SIn código & gratis & fáciles
NO CODING & FREE &
NOT THAT EASY


con código & gratis & difíciles


10.-Eines
Storytelling and Data Visualization

El relat (storytelling)
-
Entrevista a les dades
-
Busca el patró
-
Personalitza
-
Contrasta les fonts (experts, altres fonts)
-
Explica la història (qui, què, quan, què, per què)
10.-Eines
Storytelling and Data Visualization
10.-Eines
Storytelling and Data Visualization
- Eina molt versàtil
- El procés d'aprenentatge és molt ràpid
- Es pot integrar en una web i en mòvil
- Experiència d'usuari -> permet l'exploració per part de l'usuari
- Narració guiada -> explorar de forma guiada a través de les Stories
- Plugin de Canva per integrar gràfics de Flourish a les presentacions
¿Per què Flourish?
Mil mujeres asesinadas (RTVELab)
https://lab.rtve.es/mil-mujeres-asesinadas/datos/
Singapore Societies (Kontinentalist)
http://v1.kontinentalist.com.s3-website-ap-southeast-1.amazonaws.com/stories/singapore-registered-and-secret-societies-history-19th-century-data/
The origins of Coffe in Asia (Kontinentalist)
https://kontinentalist.com/stories/are-coffee-trade-markets-in-asia-sustainable-and-ethical
Listas de espera (Newtral)
https://www.newtral.es/especiales/listas-de-espera-en-sanidad/
Storydata (Diari de Barcelona)
Projectes amb Flourish
Gràfics amb Flourish
Taula dinàmica
10.-Eines
Storytelling and Data Visualization
10.-Eines
Storytelling and Data Visualization
- Exemples d'ús
DATAWRAPPER
Datawrapper tooltips
negrita: <b> text en negrita </b>
salto de línea: <br>
texto de color específico: <span style="color:#56436">text</span>
fondo del texto de color: <span style="background-color:#56436">text</span>
texto grande: <big>text</big>
texto gran: <span style=font-size:110%">text</span>
línea horitzontal: <hr>
Text
10.-Eines
Storytelling and Data Visualization
DATAWRAPPER
1
3
Idea o tema
Audiència
Estructura
Informació
Afegeix valor
Disseny


Com començar
1
3
FOOTER
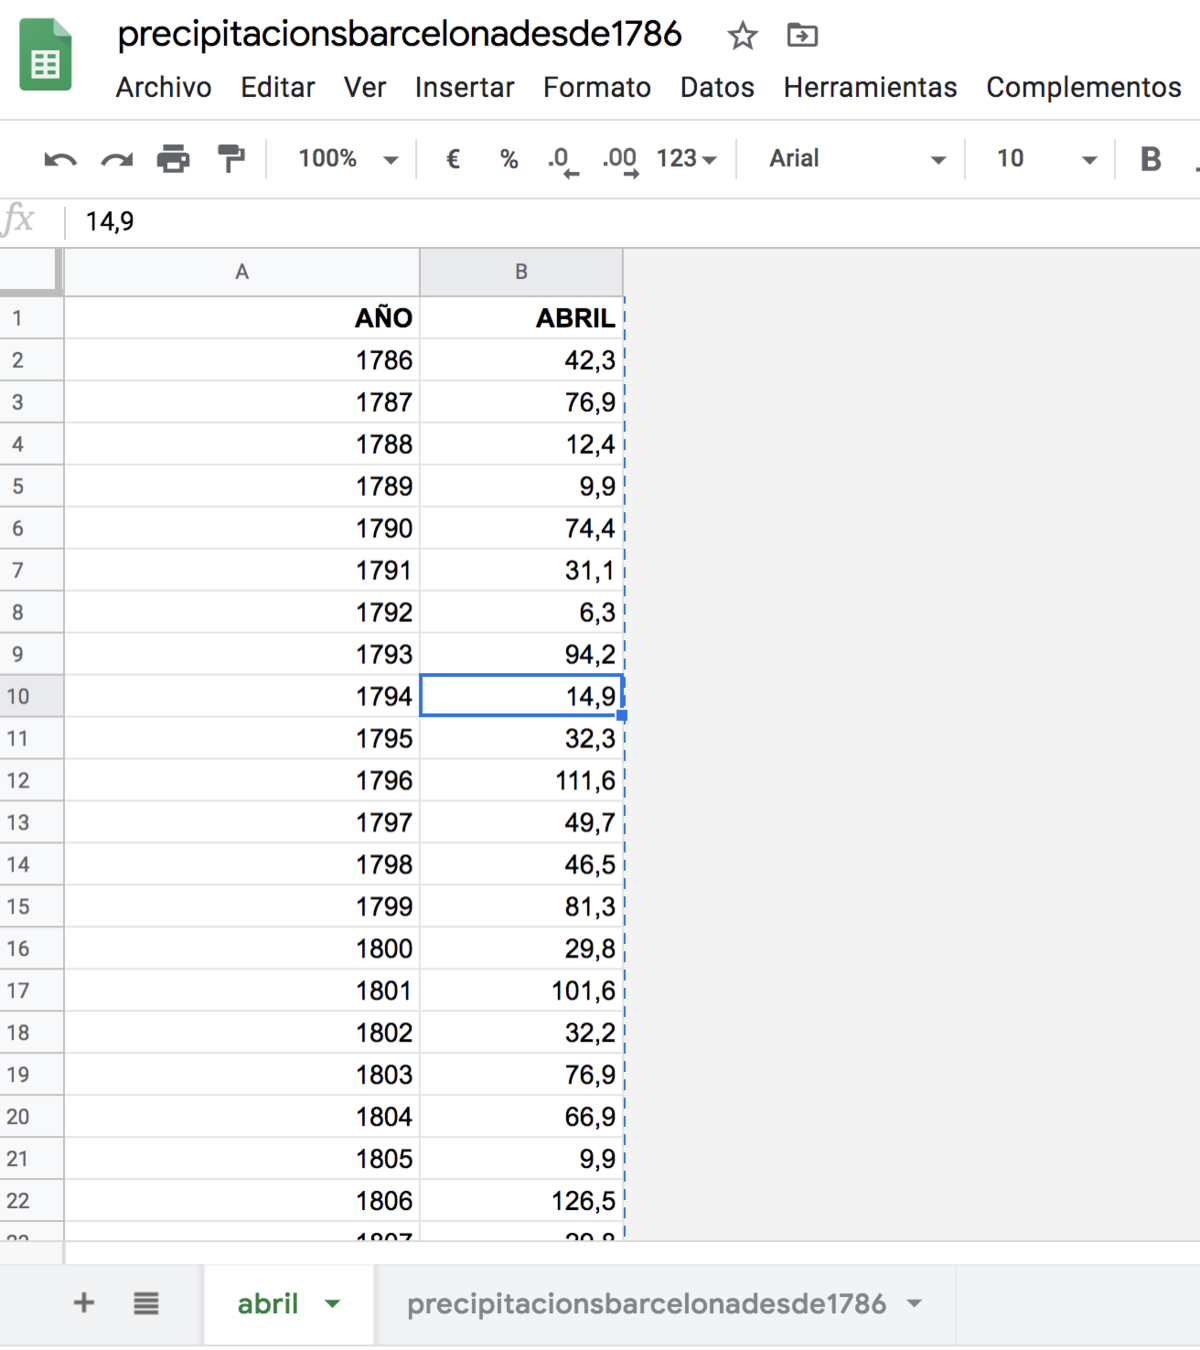
Aigua de l'aixeta a Bcn
Aigua de l'aixeta a Bcn
Beure aigua a Bcn
Aigua de l'aixeta al món
WORLD MAP
Problemes
Estructura
FOOTER


Altres recursos
Altres recursos
· Open Data Barcelona:
https://opendata-ajuntament.barcelona.cat/data/ca/dataset
· Open Data Gencat:
https://governobert.gencat.cat/ca/dades_obertes/inici/
· Barcelona en Dades:
https://ajuntament.barcelona.cat/dades/ca
· INE:
https://www.ine.es/
· Kaggle:
https://www.kaggle.com/
Fonts de dades
Storytelling and Data Visualization
· Geographical Institutes websites / Open Data:
http://centrodedescargas.cnig.es/CentroDescargas/index.jsp
· Idescat:
https://www.idescat.cat/tema/xifpo
· Agència Salut Pública Bcn:
https://webs.aspb.cat/covid19aldiabcn/
Gràcies
eli@storydata.cat
Twitter @eli_vivas | @storydatabcn
IG @storydata
VISUALITZACIÓ DE DADES FEDERACIÓ DE MUNICIPIS
By Storydata


