eli@storydata.cat / elisa.vivas@upf.edu
Storytelling &
Data Visualization
Storytelling &
Data Visualization


Infografia vs Dataviz

Infografia


Germanwings flight-Inconsolata
Infografia

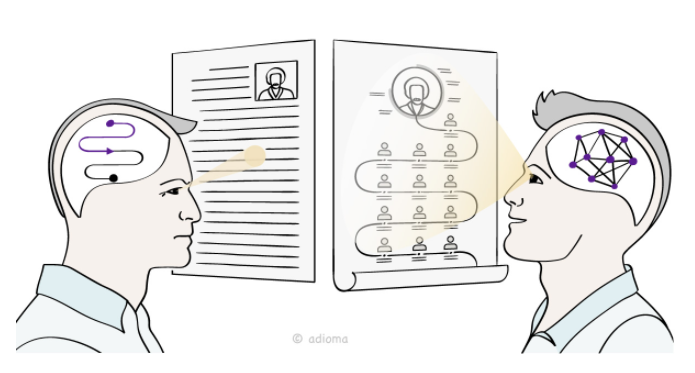
Visualització de dades
A graphical representation of data or concepts, which is either an internal construct of the mind or an external artifact supporting decision making
C. Ware 2000
Visualització de dades


Translació de dades a un contex visual

Charles Minard, 1869
Visualització de dades


Visualització de dades
Dades

INFOGRAPHICS
Cualitativa
Cuantitativa
Híbrida
1
2
3
4
52,9%
1
2
3
Per a què serveix?
- detectar patrons
- interacció
- explorar
- personalizar
- analitzar en profunditat
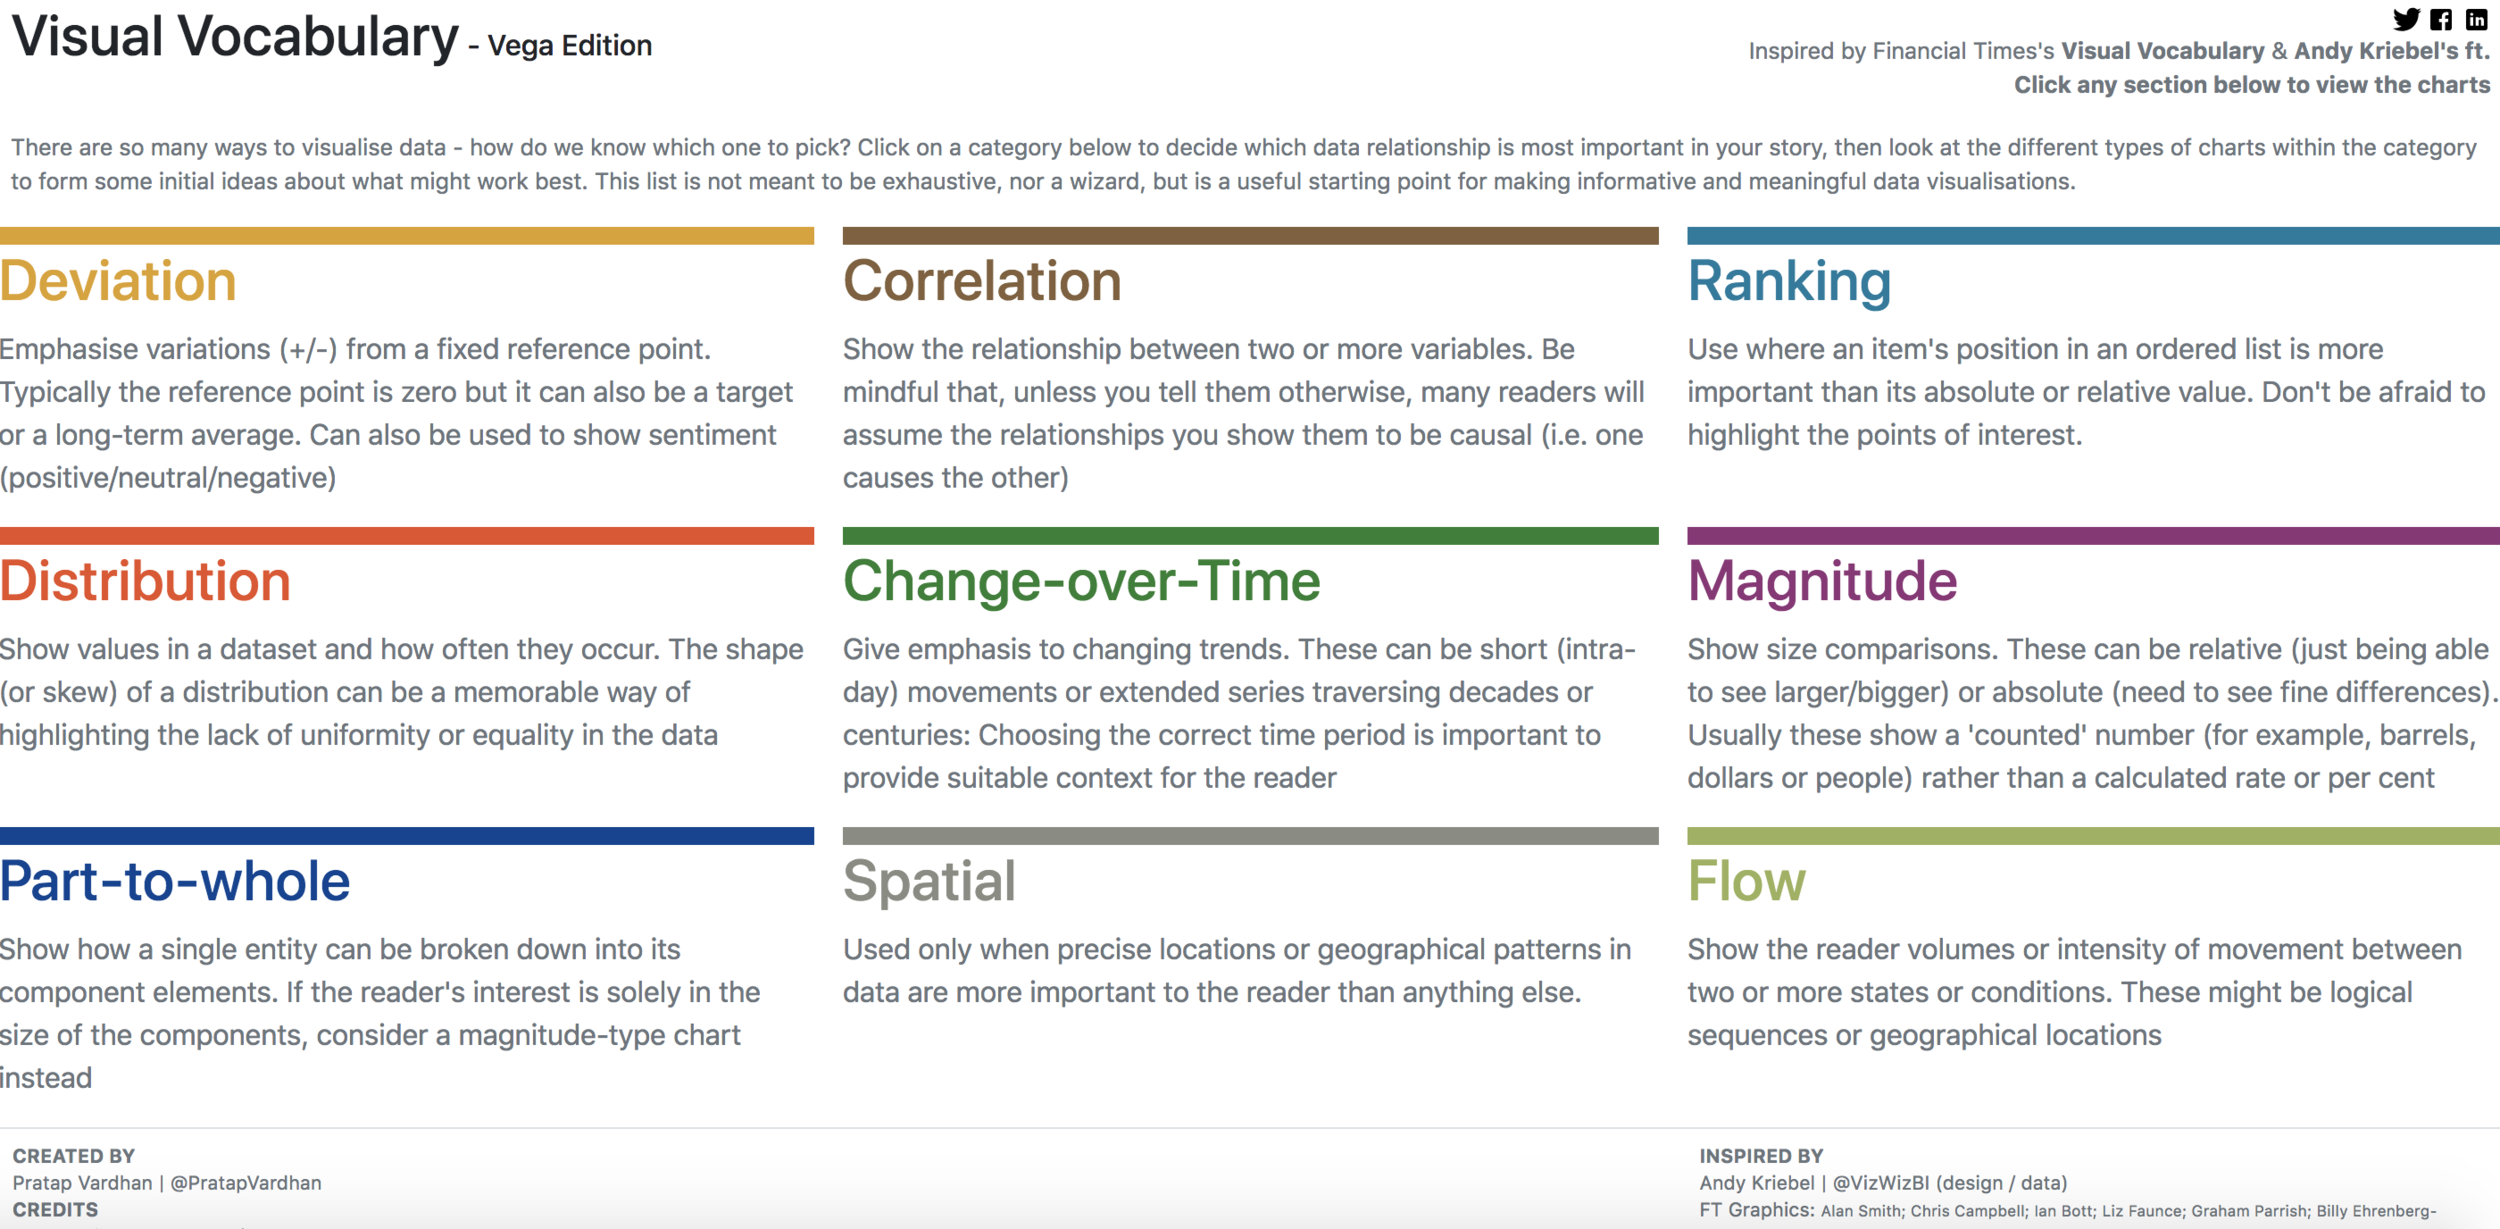
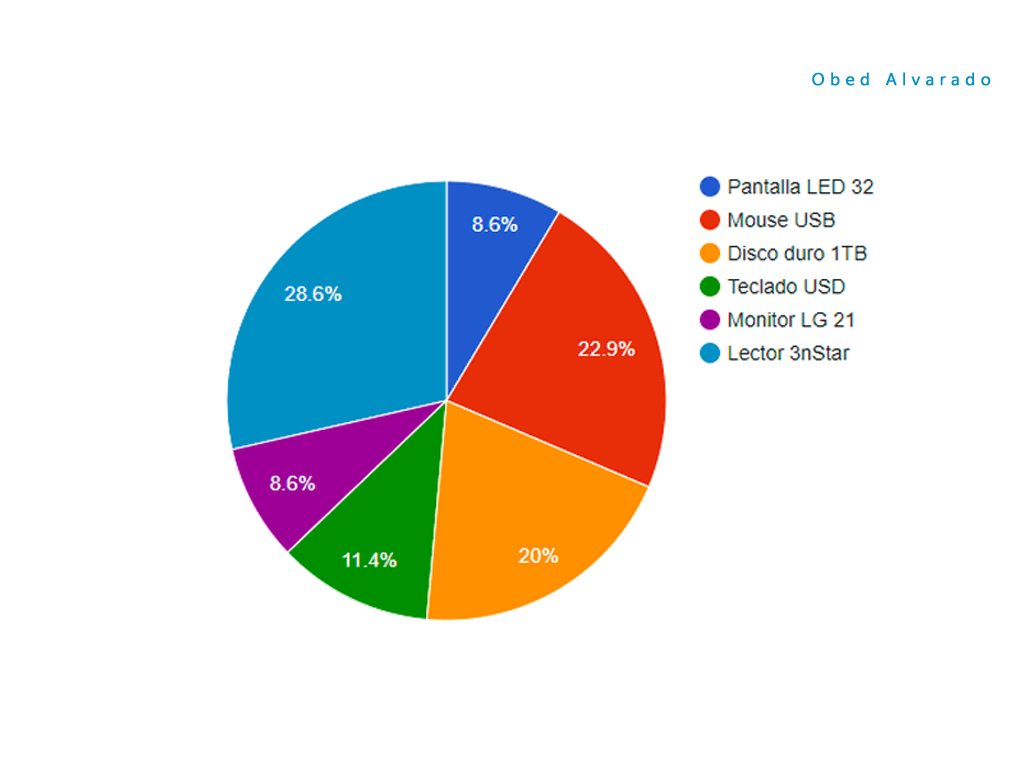
1.- Tipus de charts
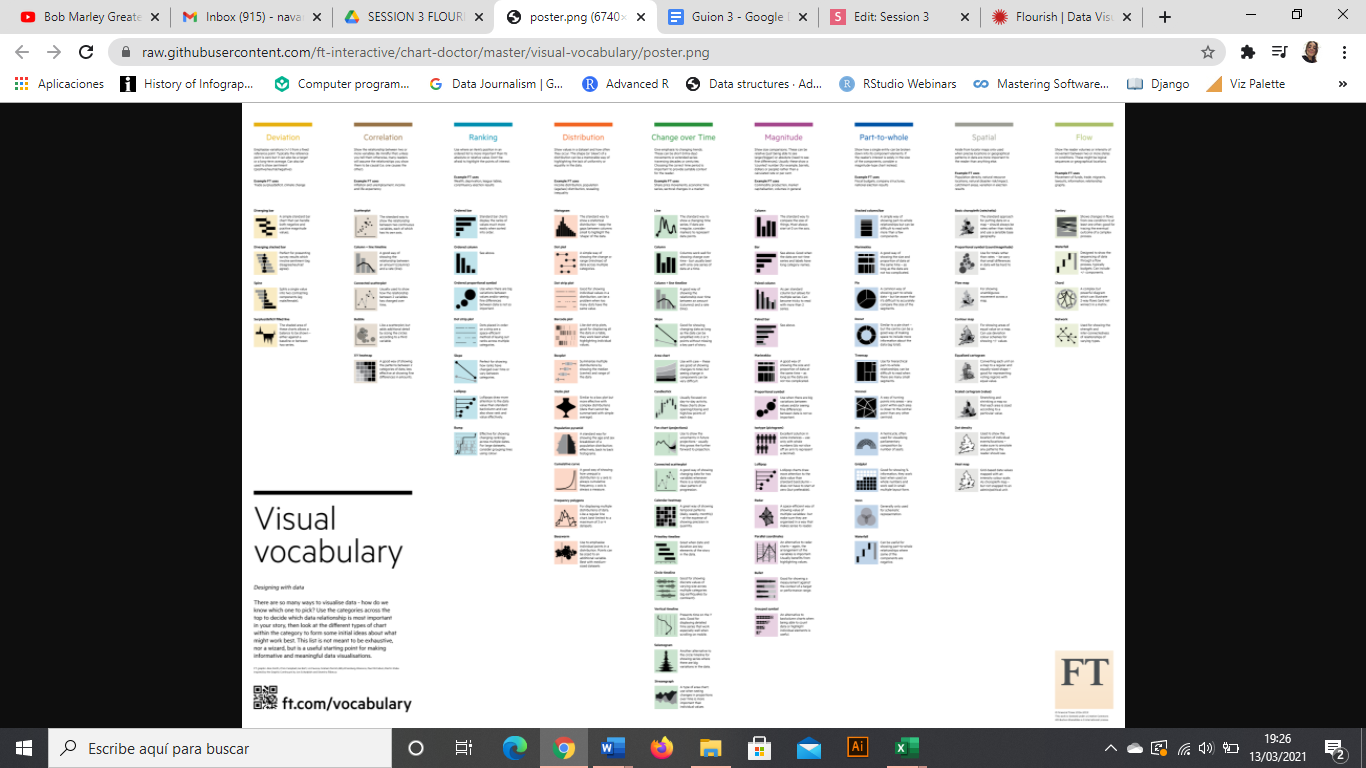
1.- Tipus de gràfics
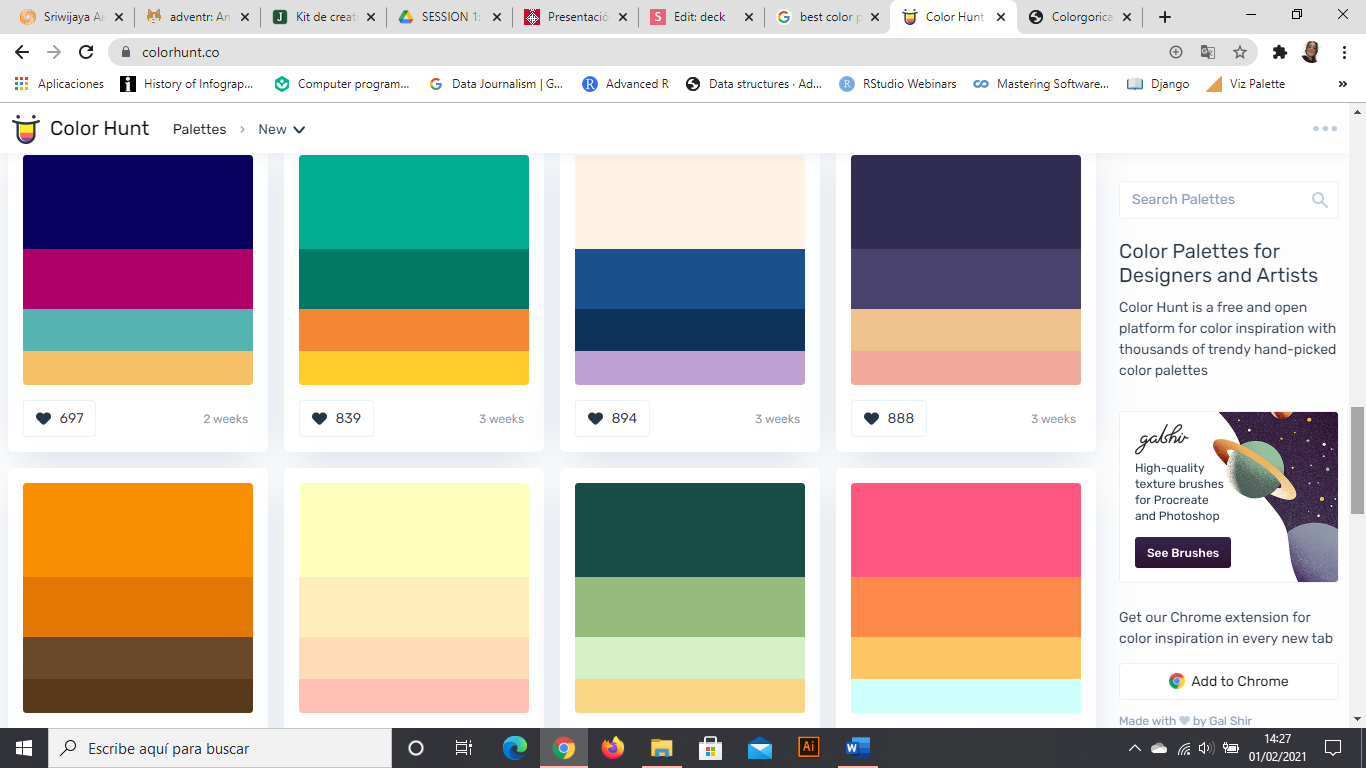
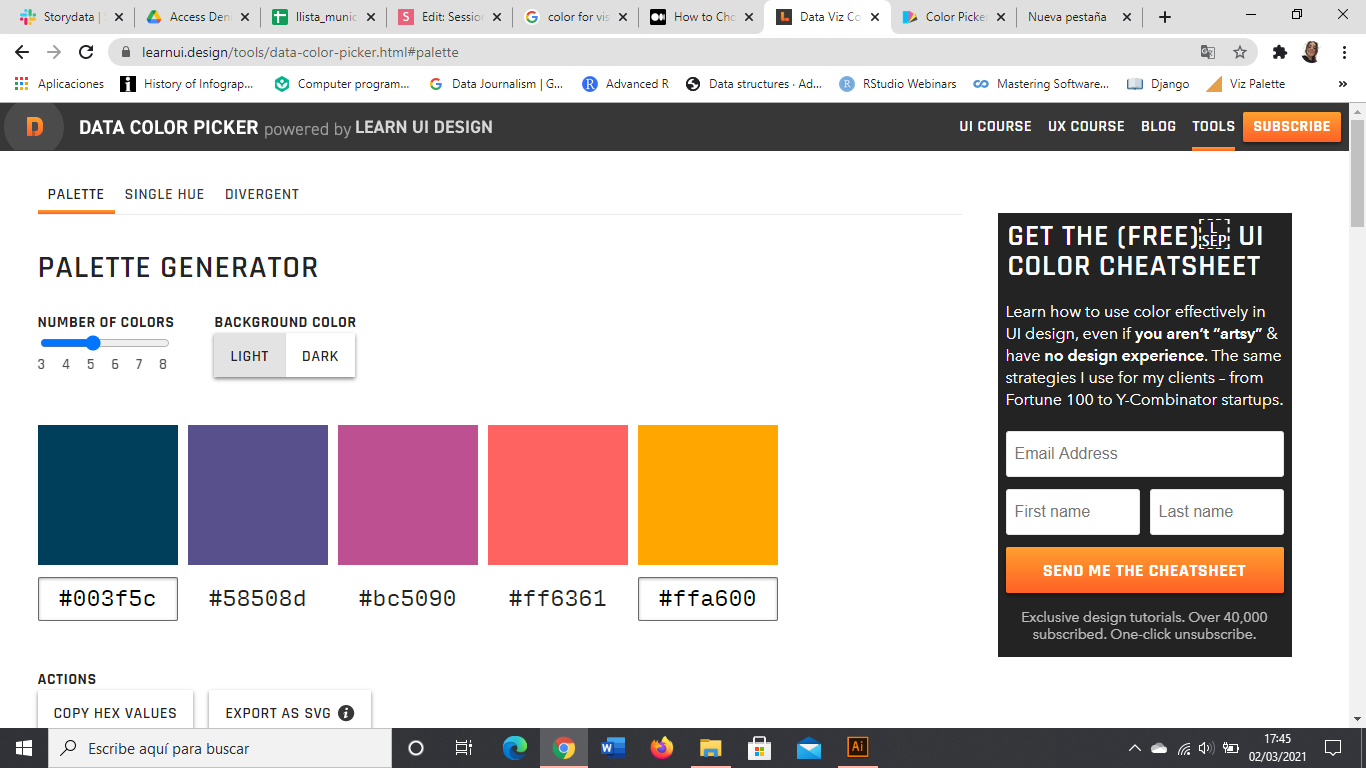
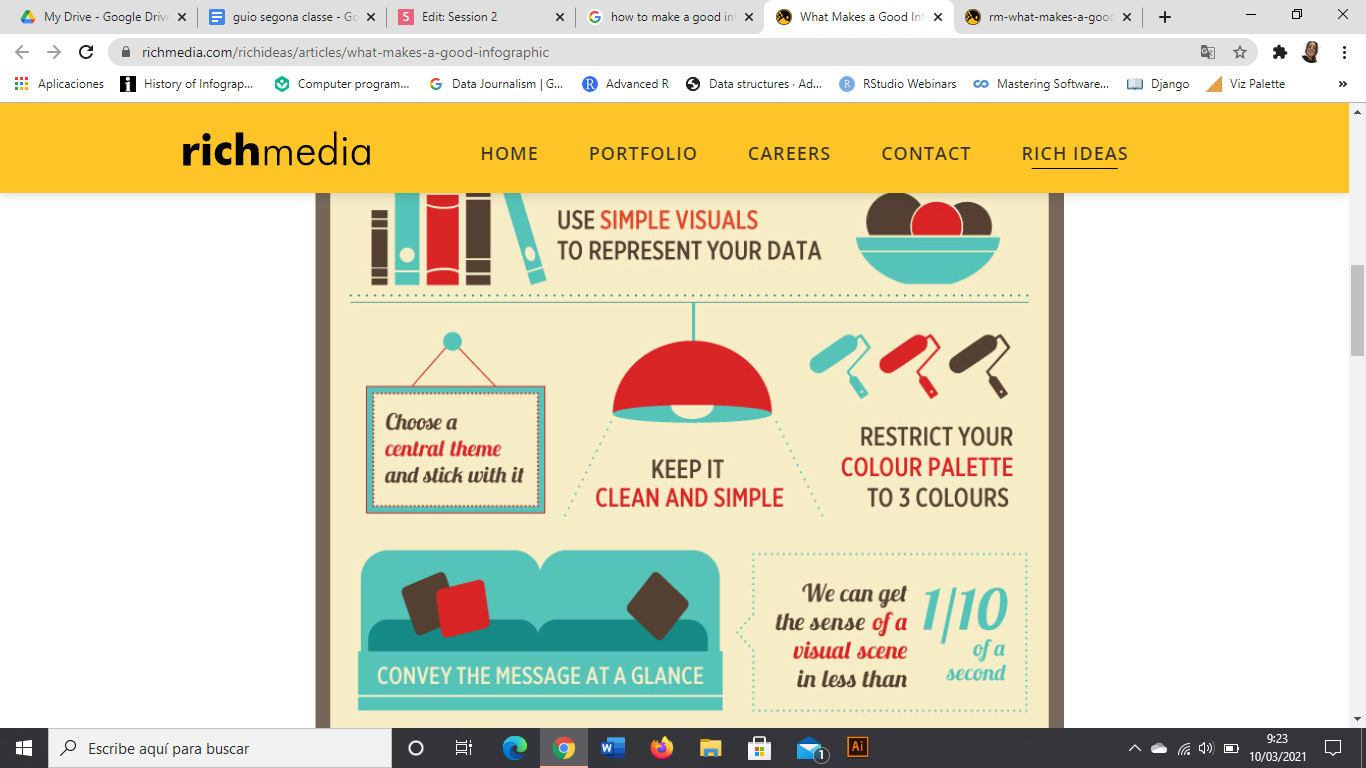
2. Color
- No més de 7 colors en un gràfic
- El gris, el teu millor amic
- Fes servir colors intuitius (pero fuig dels estereotips Home-Dona)
- Fes servir paletes de colors; funcionen!


2. US DEL COLOR
2. US DEL COLOR
3. Resalta el que és important
(ho vols explicar tot en un gràfic, pero no saturis al personal)

2 4 3 5 6 4 3 7 6 5 3
4 3 4 5 4 1 3 2 8 9 7
5 4 6 7 2 1 5 0 6 5 4
2 6 7 8 9 3 1 2 4 0 1
5 3 4 0 9 2 5 4 7 7 2
5 4 1 1 2 0 9 0 9 5 6
2 4 3 5 6 4 3 7 6 5 3
4 3 4 5 4 1 3 2 8 9 7
5 4 6 7 2 1 5 0 6 5 4
2 6 7 8 9 3 1 2 4 0 1
5 3 4 0 9 2 5 4 7 7 2
5 4 1 1 2 0 9 0 9 5 6
2 4 3 5 6 4 3 7 6 5 3
4 3 4 5 4 1 3 2 8 9 7
5 4 6 7 2 1 5 0 6 5 4
2 6 7 8 9 3 1 2 4 0 1
5 3 4 0 9 2 5 4 7 7 2
5 4 1 1 2 0 9 0 9 5 6
Títol (descripció del gràfic)
Subtítol (anys, mesures)
Font. Autor. ** Notes
3. No t'oblidis cap element

Titol memorable
Subtítol i context
Axis text
Axis text
Axis text
Axis text
Axis text
Axis text
Axis text
Caption with the source and who created the chart. Notes if necessary
Legend text
Legend text
Titol llegenda
Axis y títol
Axis x títol

4. Afegeix context
4. Afegeix context
Source: Google News Timeline
Pors públiques en els mitjans
Swine Flu
Bird Flu
Killer Wasps
Apocalypse
2000
5. Juga amb la tipografia
(però fins a un cert punt)
- Defineix UNA tipografia (o parla amb el maquetador)
- Juga amb els estils per fixar L'ATENCIÓ
- Jerarquitza la informació per la mida
"Think about subway maps, which are abstracted from the complex shape of the city and are focused on the rider’s goal: to get from one place to the next"
Visualizing Data by Ben Fry
5. Fes el complex, simple

Medium Infogram
5. Fes el complex, simple
6. Alinia tot amb tot
(i ordena, ordena, ordena)

Storytelling and Data Visualization
...si pots

6. Alinia tot amb tot
(i ordena, ordena, ordena)
...si pots


Medium Infogram
7. COMENÇA L'AXIS EN 0

via Víctor Pascual
8. ¡ULL AMB LES COMPARACIONS!

via Víctor Pascual

via Víctor Pascual

via Víctor Pascual

via Víctor Pascual

2013
16,2%
Tràfic per a mòbil:
9. MOBILE FIRST
SIn código & gratis & fáciles
NO CODING & FREE &
NOT THAT EASY


con código & gratis & difíciles


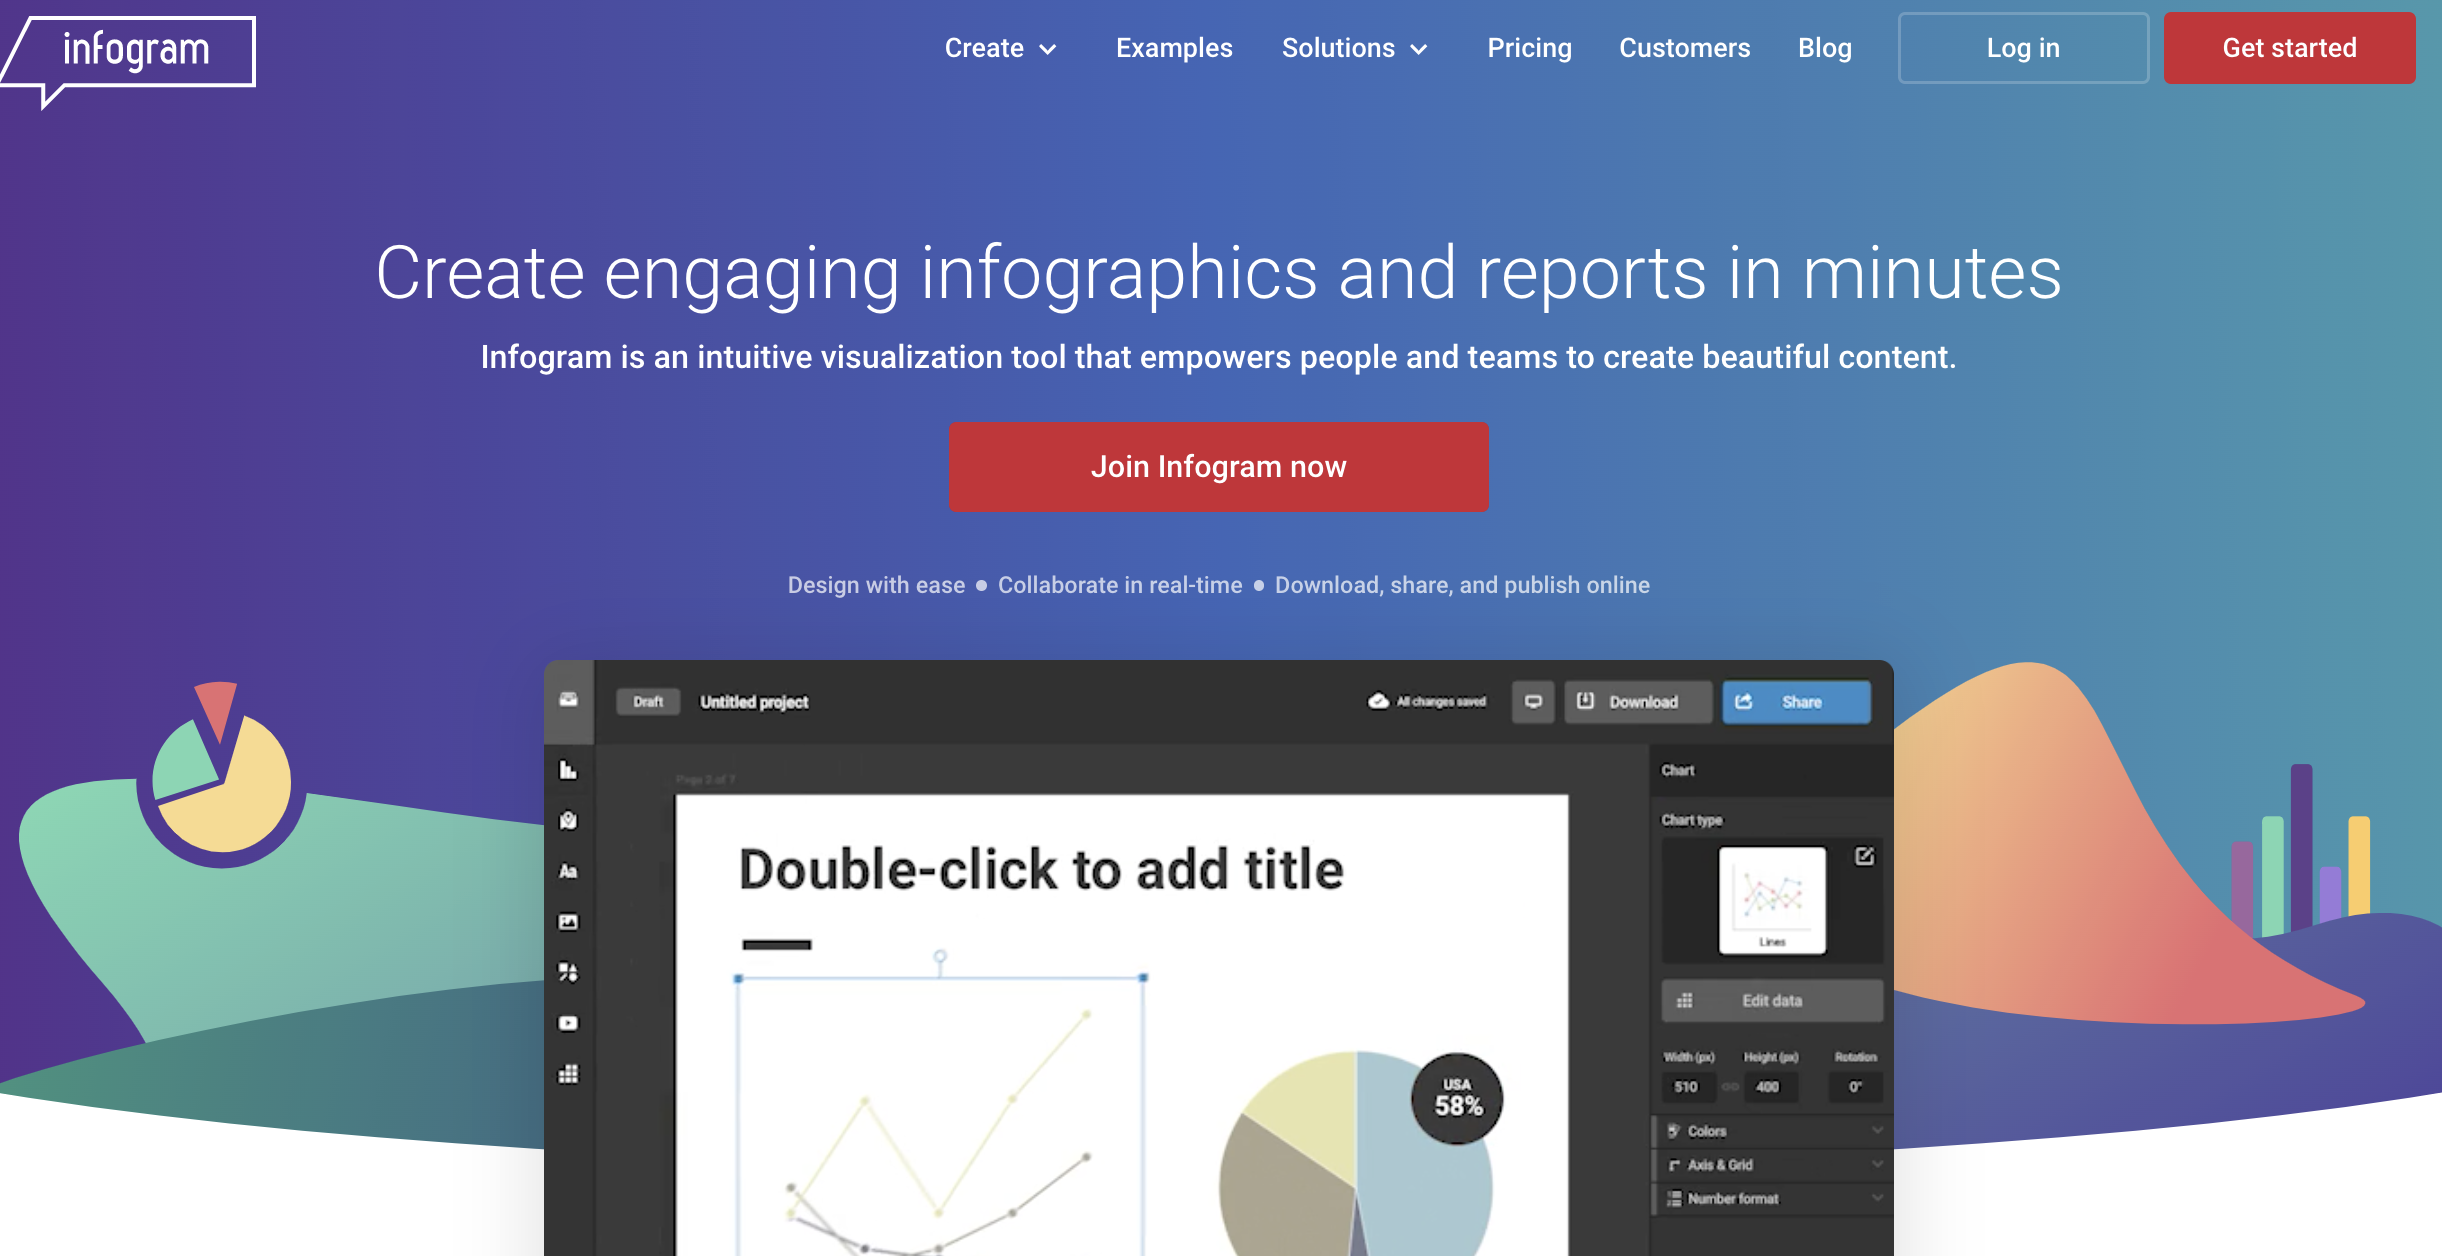
10.-Eines

Storytelling and Data Visualization
10.-Eines
Storytelling and Data Visualization
10.-Eines
Storytelling and Data Visualization
- Exemples d'ús
DATAWRAPPER
Open Data Gencat
Mapas
Datawrapper tooltips
negrita: <b> text en negrita </b>
salto de línea: <br>
texto de color específico: <span style="color:#56436">text</span>
fondo del texto de color: <span style="background-color:#56436">text</span>
texto grande: <big>text</big>
texto gran: <span style=font-size:110%">text</span>
línea horitzontal: <hr>
10.-Eines
Storytelling and Data Visualization
DATAWRAPPER
Eli Vivas
eli@storydata.cat
Twitter @eli_vivas | @storydatabcn
IG @storydata
Definició infografia
-
Infografía
De Infographie®, marca reg.
1. f. Técnica de elaboración de imágenes mediante computadora.
2. f. Imagen obtenida por infografía.
3. f. Representación gráfica que apoya una información de prensa.
Real Academia Española
- Presentacions amb Slides
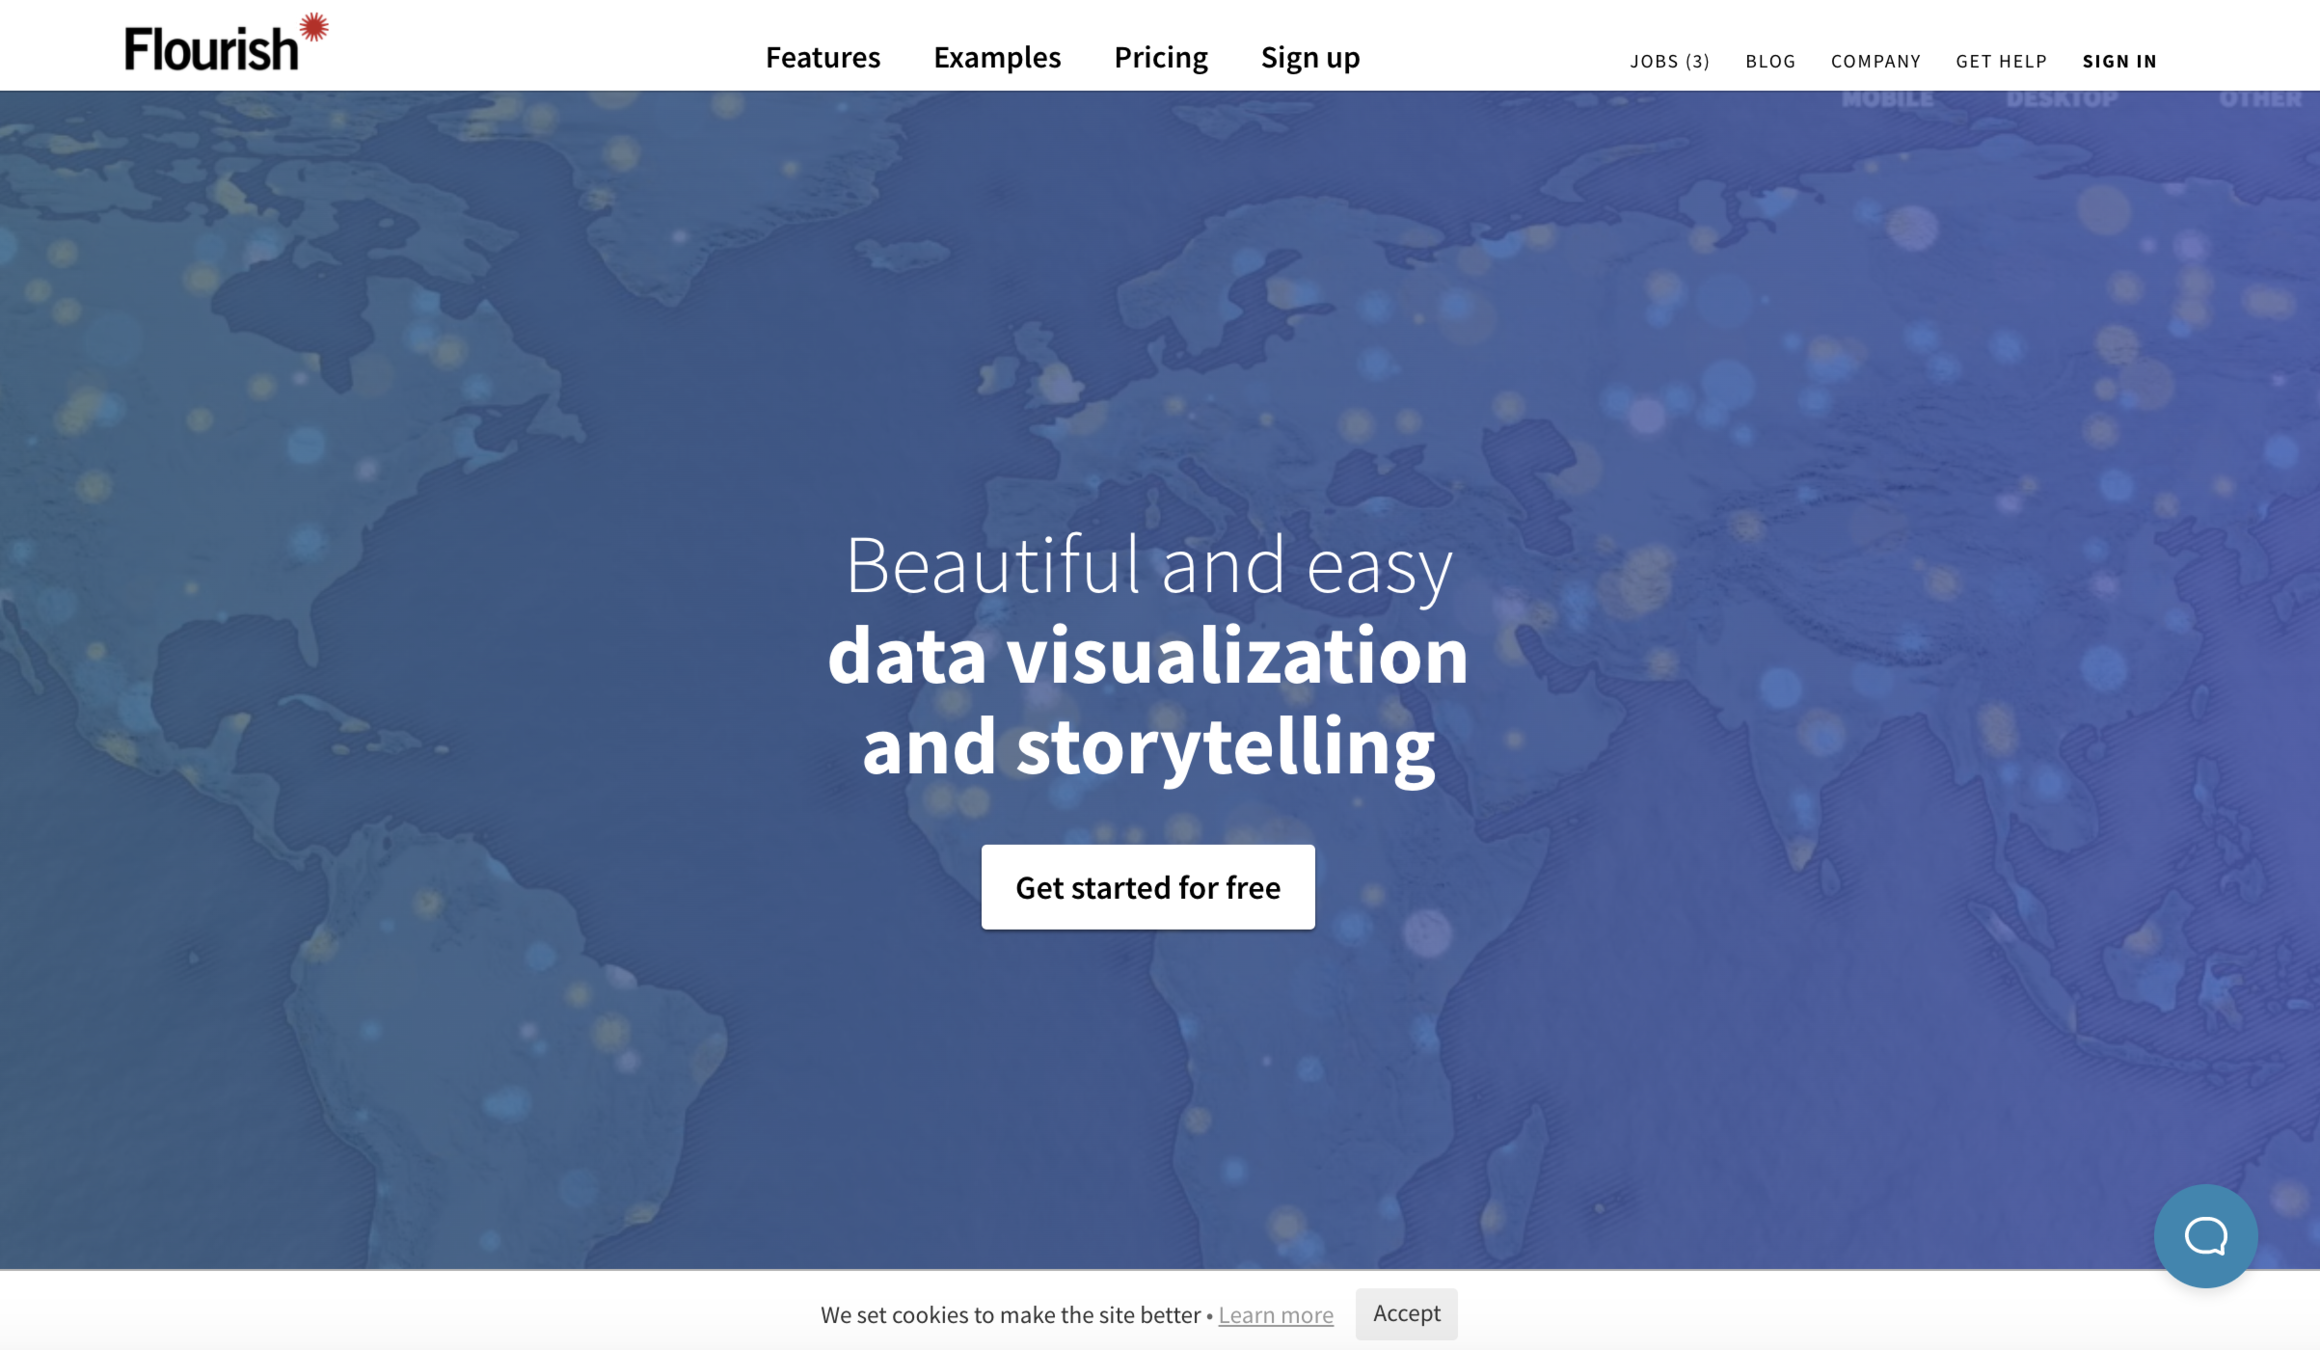
- Gràfics amb Flourish
- Infogram
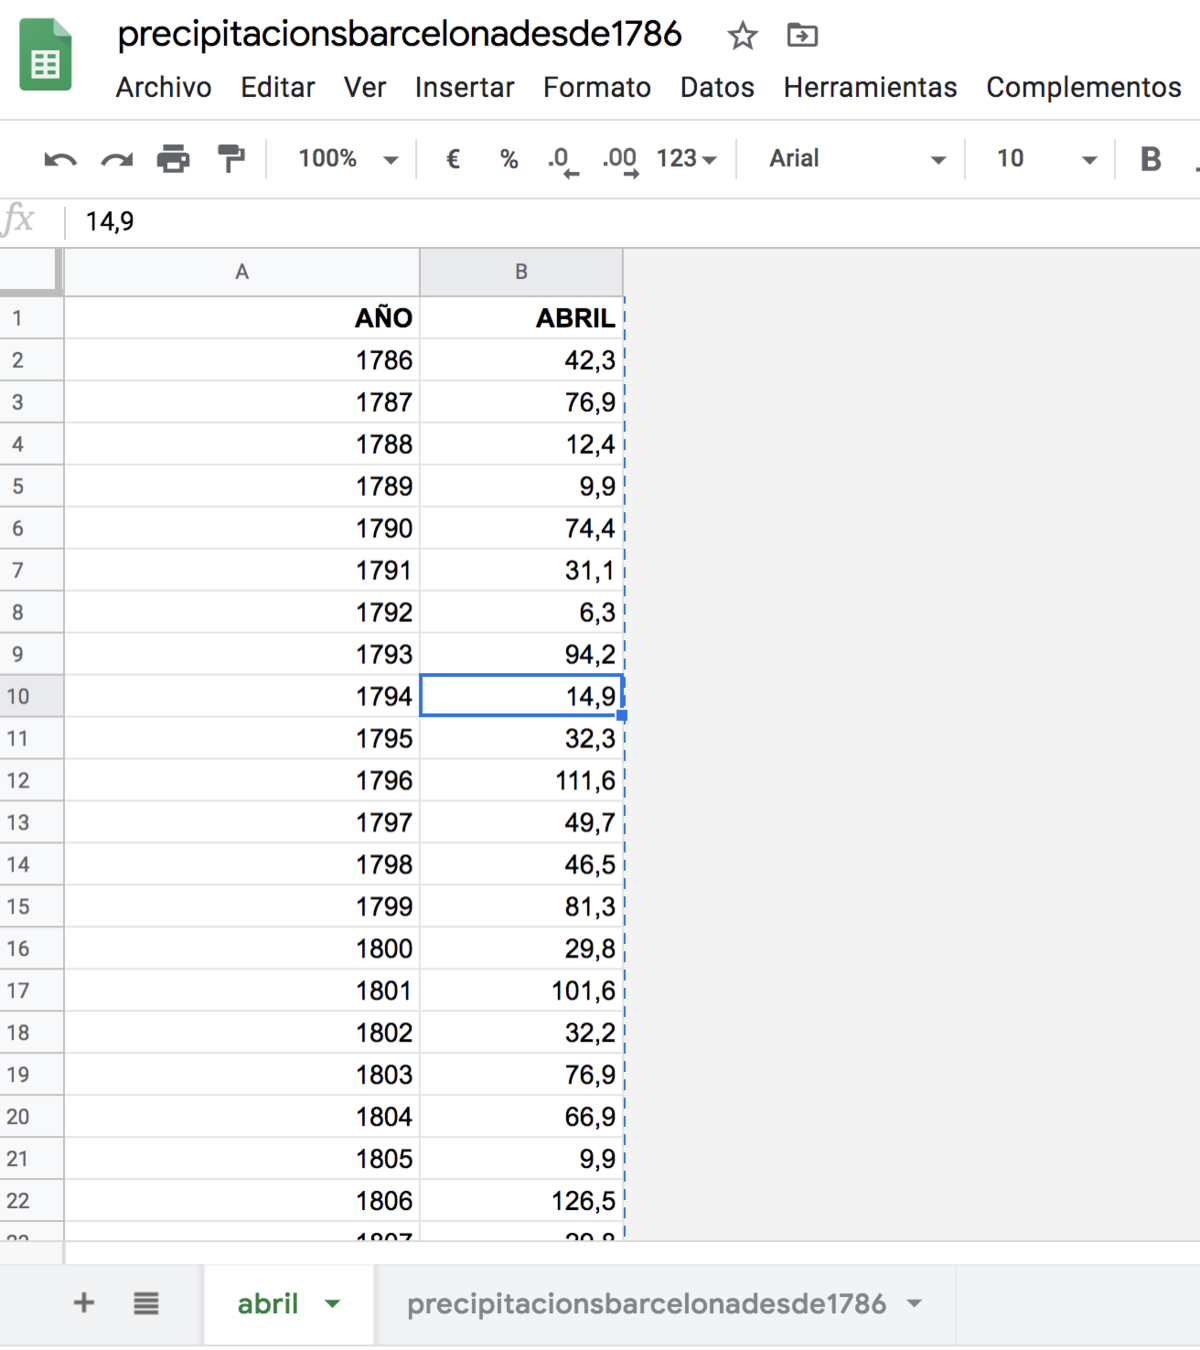
- Obtenir les dades
- Creació del projecte
- Afegir objectes i customitzar
Estructura
Teoria
Práctica
45'
2h
- Tipus
- Dashboards i principis gràfics
- Pictogrames per no dissenyadors

EL TEU TORN
1.- Creat un compte a Datawrapper i fes les següents visualitzacions.
2.- Fes el mateix amb Flourish.
- Herramienta muy versátil
- El proceso de aprendizaje es muy ràpido
- Se puede integrar en una web y en móbil
- Experiencia de usuario -> permite la exploración por parte del usuario
- Narración guiada -> explorar de forma guiada a través de las Stories
- Plugin de Canva para integrar graficos de Flourish en las presentaciones
¿Por qué Flourish?
Mil mujeres asesinadas (RTVELab)
https://lab.rtve.es/mil-mujeres-asesinadas/datos/
Singapore Societies (Kontinentalist)
http://v1.kontinentalist.com.s3-website-ap-southeast-1.amazonaws.com/stories/singapore-registered-and-secret-societies-history-19th-century-data/
The origins of Coffe in Asia (Kontinentalist)
https://kontinentalist.com/stories/are-coffee-trade-markets-in-asia-sustainable-and-ethical
Listas de espera (Newtral)
https://www.newtral.es/especiales/listas-de-espera-en-sanidad/
Proyectos con Flourish
Gràfics amb Flourish
mapa barris
- Par explicar alguna cosa complicada, o tècnica

- Recursos gráficos que resumeixen de forma senzilla i atractiva una gran quantitat d'informació.
Infografies
TELLS A


EXPLICAR UNA HISTORIA
BEN ESTRUCTURADA
VISUALMENT ATRACTIVA
MEMORABLE
Qualitatius
Quantitatius
Híbrid
1
2
3
4
52,9%
1
2
3
Tipus
1
3
Estàtic
Interactiu
Dinàmic

Categories
1
3
Títol
Cos
Peu
Parts
1
3
Estadístics

Tipus
1
3


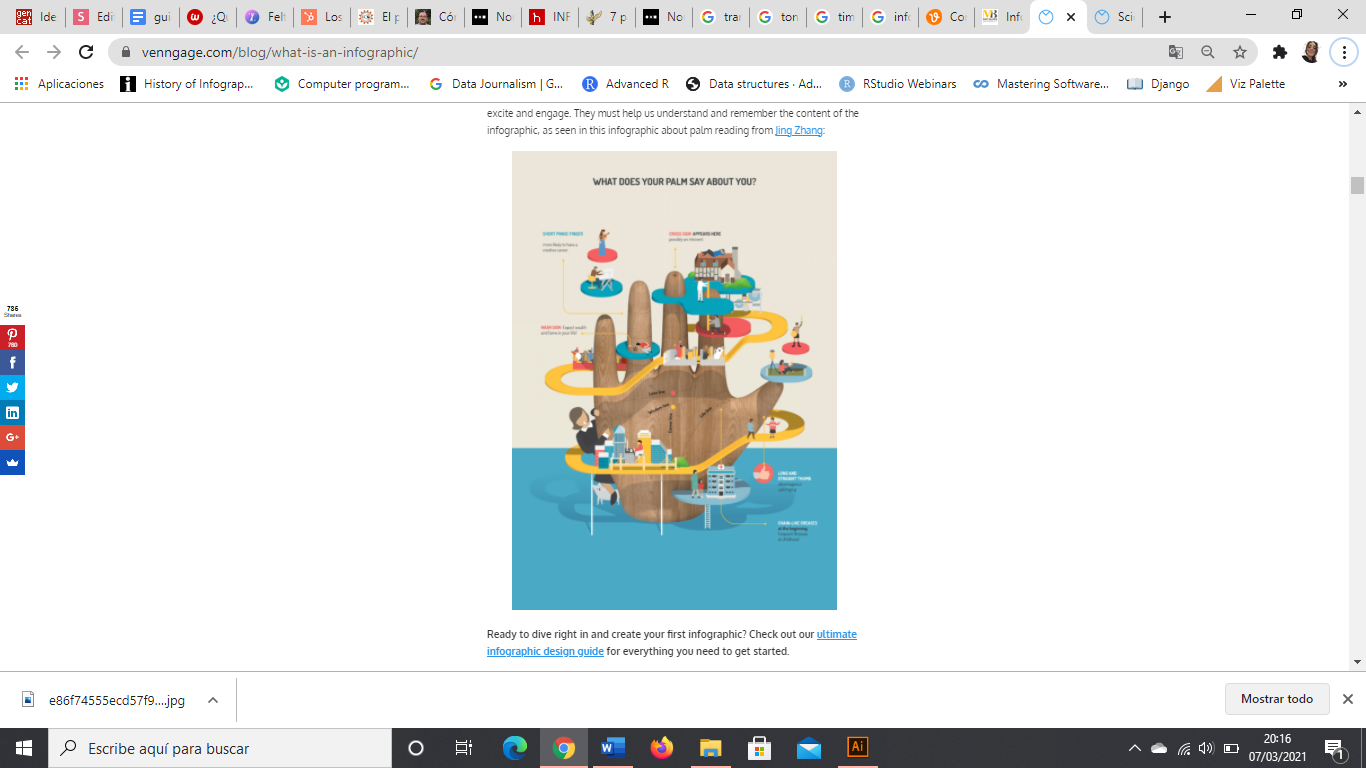
Jing Zhang

Venngage
Informatius
Tipus
1
3


Venngage
Timeline
Tipus
1
3

Nigel Holmes

goodwaydesign
Procés
Tipus
1
3

David McCandless
Comparatius
Tipus
FOOTER
SESSION 2


Llista
Tipus
1
3
Idea o tema
Audiència
Estructura
Informació
Afegeix valor
Disseny


Com començar
1
3
SESSION 2
FOOTER
Aigua de l'aixeta a Bcn
Aigua de l'aixeta a Bcn
Beure aigua a Bcn
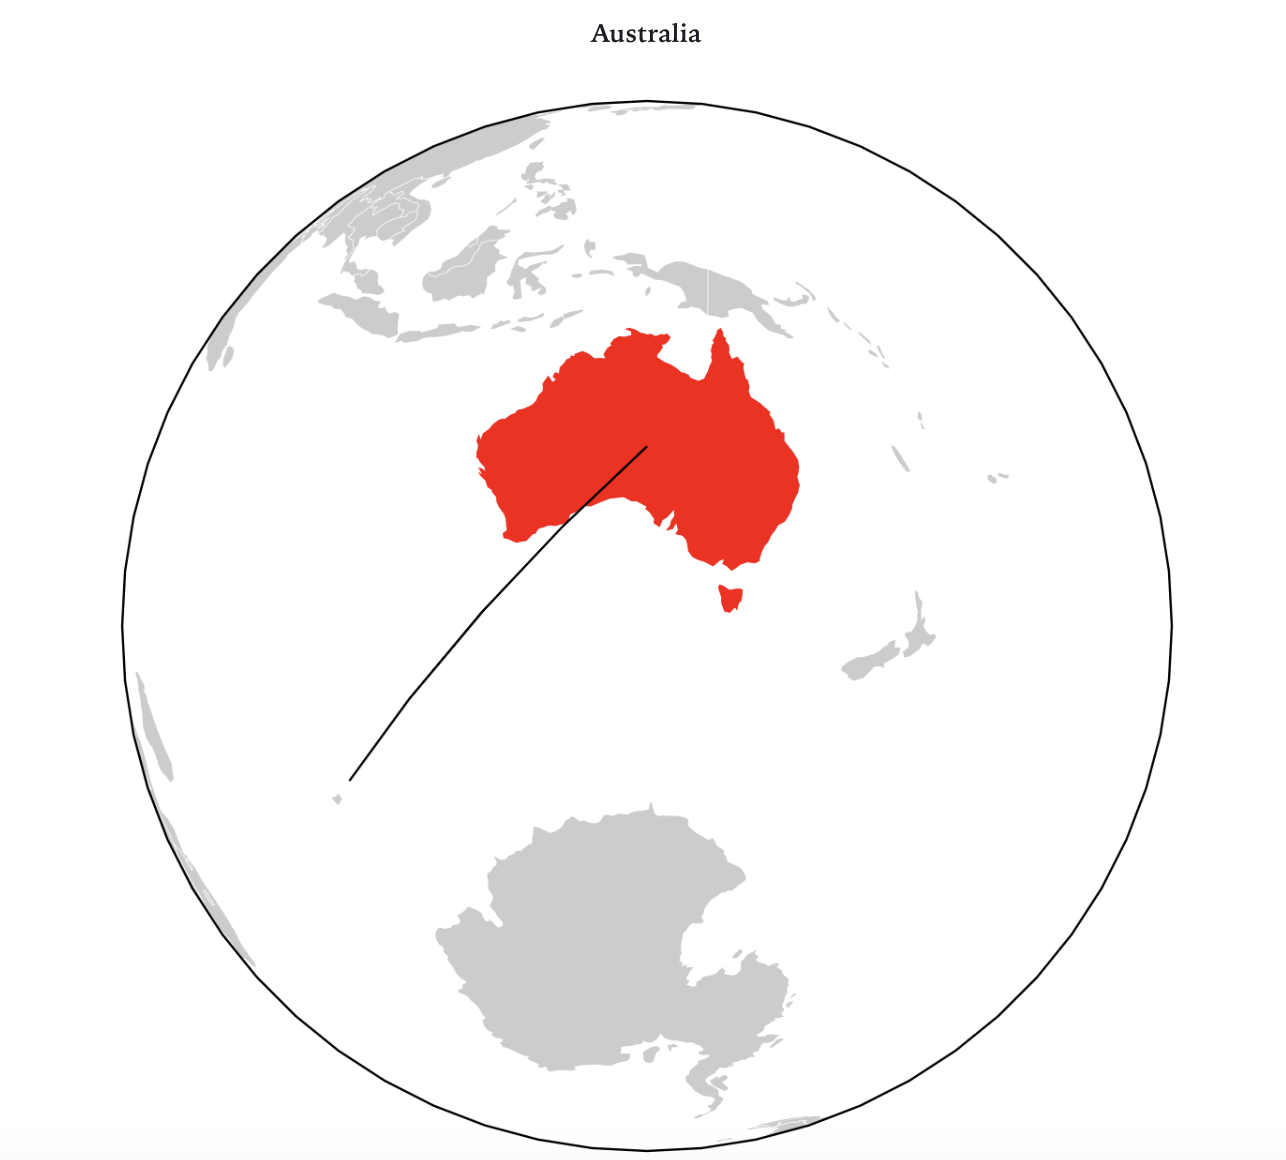
Aigua de l'aixeta al món
WORLD MAP
Problemes
Estructura
FOOTER
- Significat propi
- Poc text
- Coherència gràfica
- Legibilitat

Dissenyar conceptes
FOOTER


FOOTER
El teu torn
Altres recursos
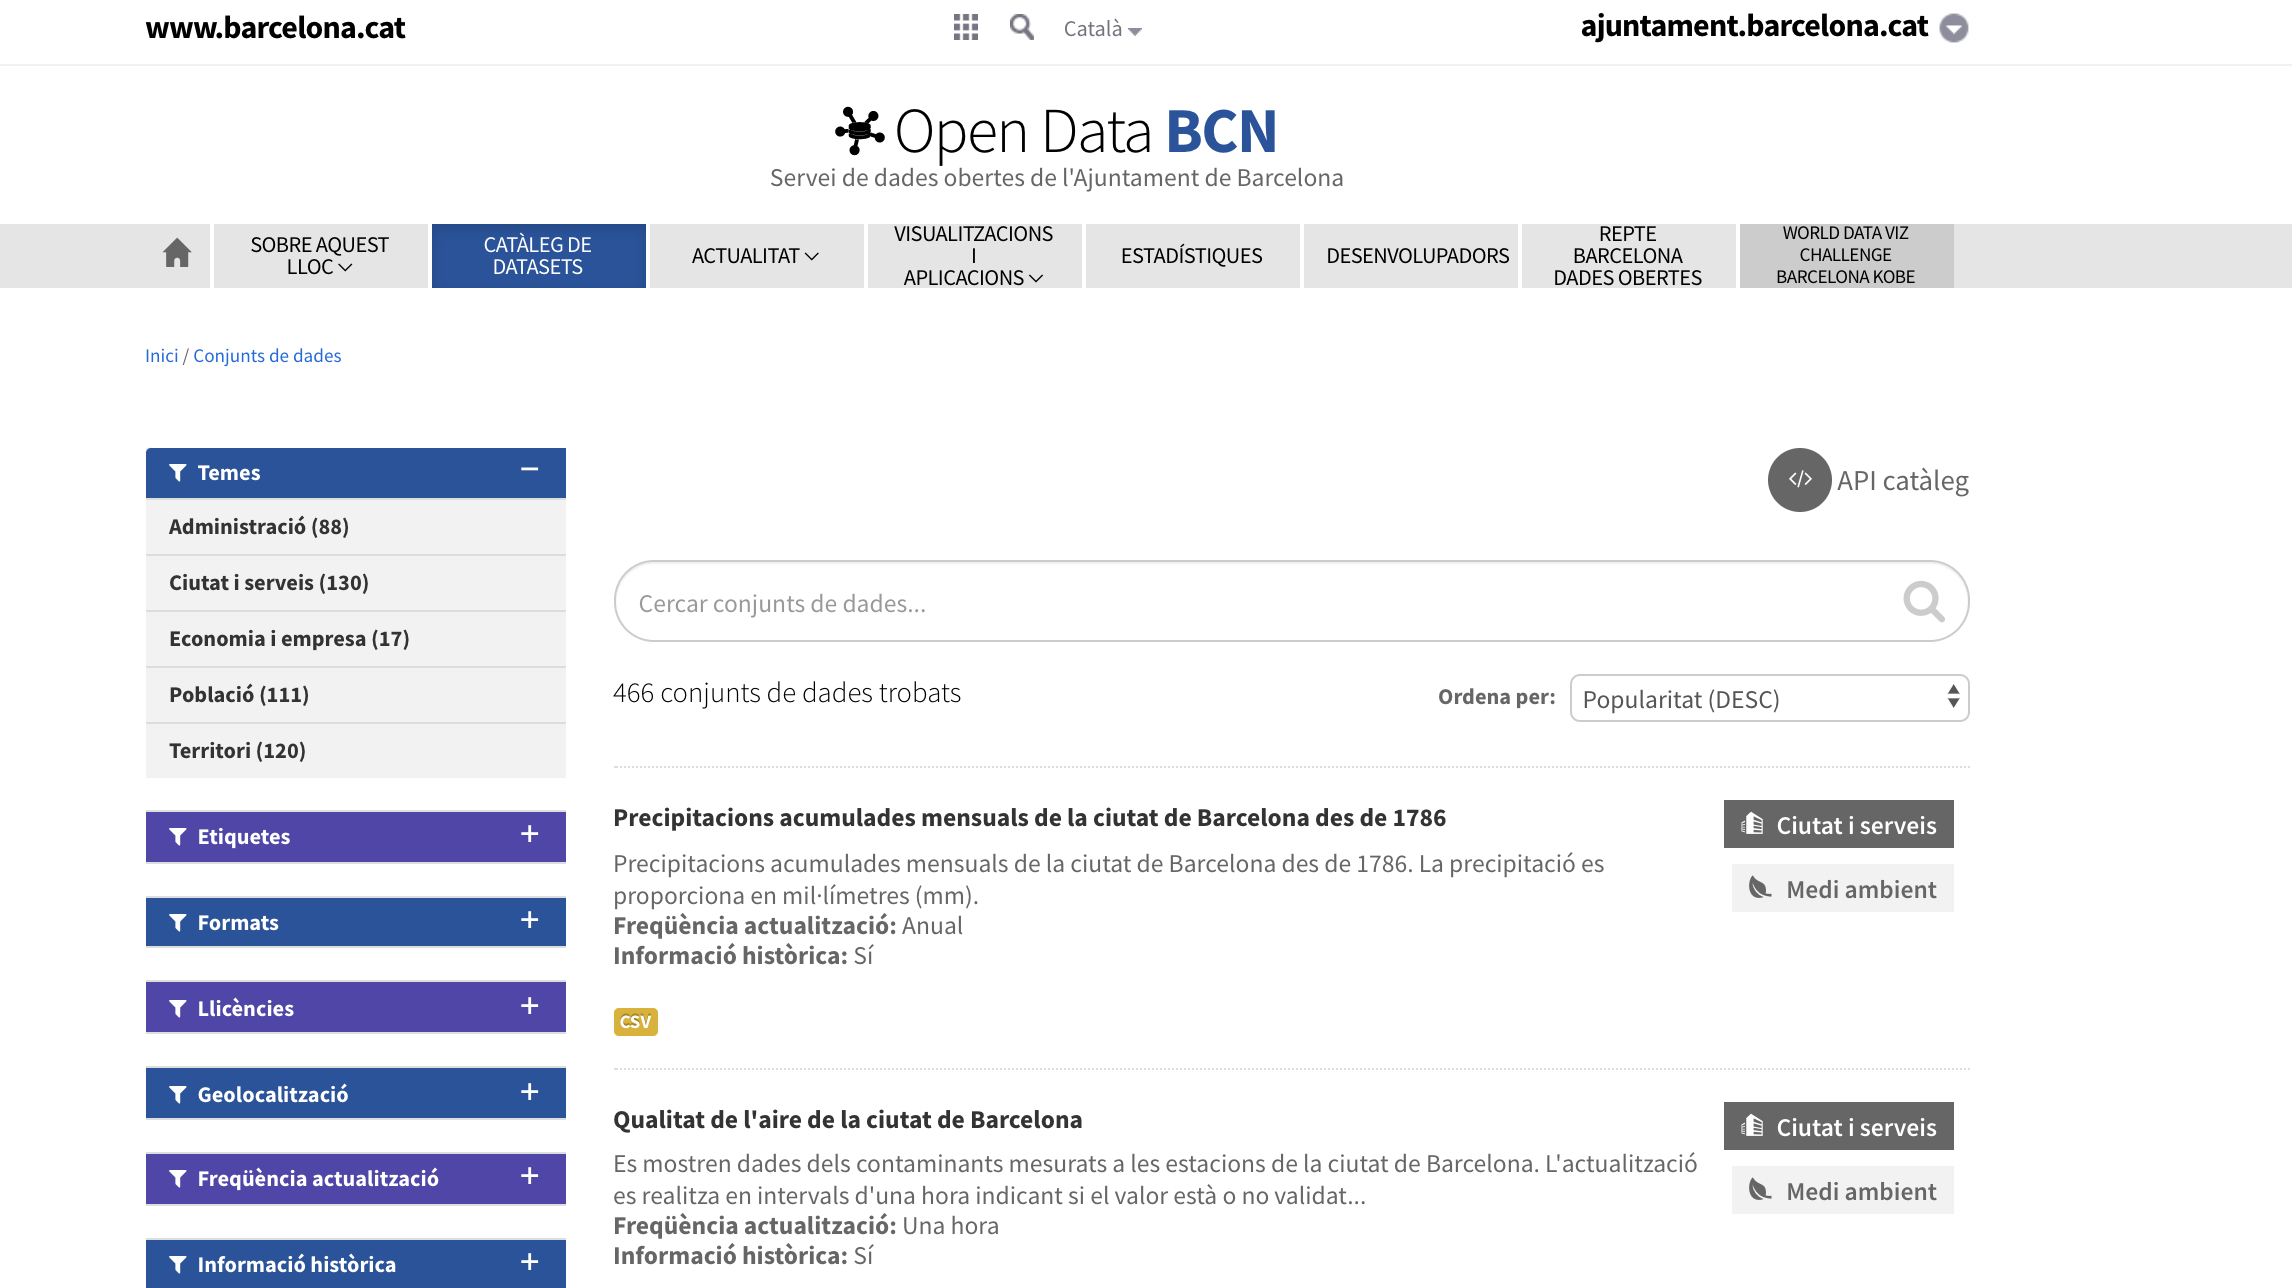
· Open Data Barcelona:
https://opendata-ajuntament.barcelona.cat/data/ca/dataset
· Open Data Gencat:
https://governobert.gencat.cat/ca/dades_obertes/inici/
· Barcelona en Dades:
https://ajuntament.barcelona.cat/dades/ca
· INE:
https://www.ine.es/
· Kaggle:
https://www.kaggle.com/
Fonts de dades
Storytelling and Data Visualization
· Geographical Institutes websites / Open Data:
http://centrodedescargas.cnig.es/CentroDescargas/index.jsp
· Idescat:
https://www.idescat.cat/tema/xifpo
· Agència Salut Pública Bcn:
https://webs.aspb.cat/covid19aldiabcn/
Gracias
eli@storydata.cat
Twitter @eli_vivas | @storydatabcn
IG @storydata
VISUALITZACIÓ DE DADES master comunicación científica
By Storydata


