1.3 Six Elements of ML
A defining framework for understanding concepts in the course
Recap: Machine Learning
What we saw in the previous chapter?
(c) One Fourth Labs
Repeat the last slide of the previous chapter
A jargon cloud
How do you make sense of all the jargon?
(c) One Fourth Labs

From jargons to jars
What are the six jars of Machine Lerarning
(c) One Fourth Labs


Data data everywhere
What is the fuel of Machine Learning?
(c) One Fourth Labs


Data data everywhere
How do you feed data to machines ?
(c) One Fourth Labs
We encode all data into numbers - typically high dimension
For instance, in this course you will learn to embed image and text data as large vectors
Data entries are related - eg. given a MRI scan whether there is a tumour or not
Include a table that shows two/three MRI scans in first col, shows large vectors in second column, 1/0 for last column of whether there is tumour or not
Include a table that shows two/three reviews in first col, shows large vectors in second column, 1/0 for last column for whether review is positive or negative
Title the columns as x and y


| Input-1 | Input-2 | Input-3 | Input-4 | y |
|---|---|---|---|---|
| 2.3 | 5.9 | 11.0 | -10.3 | 0 |
| -8.5 | -1.7 | -1.3 | 9.0 | 0 |
| 12.3 | 5.4 | 3.4 | 2.4 | 1 |
| 1.9 | 7.9 | 8.1 | -3.3 | 1 |
| -9.1 | 1.2 | -2.1 | 7.8 | 0 |
| 3.2 | -11.2 | 5.6 | 12.1 | 1 |
| 4.5 | 3.75 | -1.2 | -10.0 | 1 |

Data data everywhere
How do you feed data to machines ?
(c) One Fourth Labs
We encode all data into numbers - typically high dimension
For instance, in this course you will learn to embed image and text data as large vectors
Data entries are related - eg. given a MRI scan whether there is a tumour or not
Include a table that shows two/three MRI scans in first col, shows large vectors in second column, 1/0 for last column of whether there is tumour or not
Include a table that shows two/three reviews in first col, shows large vectors in second column, 1/0 for last column for whether review is positive or negative
Title the columns as x and y
| Input-1 | Input-2 | Input-3 | Input-4 | y |
|---|---|---|---|---|
| 4.3 | 5.9 | 1.0 | 13.2 | Positive |
| -9.5 | 1.7 | 1.3 | 9.2 | Positive |
| 2.3 | 5.4 | 3.8 | 2.9 | Negative |
| 19.1 | 8.9 | 8.2 | -3.3 | Positive |
| -9.2 | 11.2 | -12.1 | 1.8 | Positive |
| 4.5 | -11.2 | 4.6 | 2.1 | Negative |
| 12.2 | -3.8 | 0.2 | -1.0 | Negative |


Data data everywhere
How do you feed data to machines ?
(c) One Fourth Labs
We encode all data into numbers - typically high dimension
For instance, in this course you will learn to embed image and text data as large vectors
Data entries are related - eg. given a MRI scan whether there is a tumour or not
Include a table that shows two/three MRI scans in first col, shows large vectors in second column, 1/0 for last column of whether there is tumour or not
Include a table that shows two/three reviews in first col, shows large vectors in second column, 1/0 for last column for whether review is positive or negative
Title the columns as x and y
| 1.3 | -4.3 | 2.1 | -6.7 | ... | 1.5 | 8.9 | 10.1 | -4.5 |
| 2.6 | 7.9 | -0.3 | 8.1 | ... | -4.2 | 0.3 | -11.2 | 9.4 |
| -5.2 | -3.2 | 4.2 | 0.3 | ... | 3.5 | 8.3 | -1.4 | -8.7 |
| 8.5 | 2.1 | -6.3 | 5.3 | ... | 7.2 | -1.3 | -4.5 | 11.8 |
| 2.3 | -5.6 | -1.2 | 7.8 | ... | 9.9 | 10.1 | -12.1 | 3.5 |
Data curation
Where do I get the data from?
(c) One Fourth Labs
Source data from existing datasets
- Google datasets
- Mitesh link on datasets
- data.gov.in, etc. => Assignment: Go check out this website and formulate ML problems
Collect data yourself/others => Dataturks => Assignment: create a project, upload 5 images of sign boards, and ask five friends to label
- Take pictures of Indian dishes
- Labelling of data
Create data specific to your problem
- Also in capstone
Data data everywhere
What is the fuel of Machine Learning?
(c) One Fourth Labs
Show data jars
Tasks
What do you do with this data?
(c) One Fourth Labs
Consider the case of Amazon with product data
Multiple tasks can be done with this:
1. From product description to structured specs
2. From specs + reviews to writing FAQs
3. From specs + reviews + FAQs to question answering
4. From specs + reviews + personal data to recommendations
Tasks
What do you do with this data?
(c) One Fourth Labs
Consider the case of Facebook photos
Multiple tasks can be done with this:
1. From photos identify people, places, activities
2. From posts + personal data recommend posts
3. From video detect profanity, etc.
Tasks
What do you do with this data?
(c) One Fourth Labs
Different types of tasks:
1. Supervised
- Classification - text or no text
- Regression - fitting bounding boxes (more later)
2. Unsupervised
- Clustering - clustering news articles by similarity
- Generation - deep art, deep poetry
Most of the realworld ML tasks (90%) are supervised. This course will exclusively focus on this class of problems. Except for easter eggs.
In supervised ML it is about finding y given x
Tasks
What do you do with this data?
(c) One Fourth Labs
In the dataturks labelled data, define tasks that you can perform. At least 3
// Binary classification of whether there is text
// Detect text with bounding box - is accuracy easy to define here?
Tasks
What do you do with this data?
(c) One Fourth Labs
Show data, tasks jars
What is the mathematical formulation of a task?
(c) One Fourth Labs

\( x \)
\( y \)
bat
car
dog
cat
Models
\( \left[\begin{array}{lcr} 0.2, 0.1, 0.7, ......0.8 \end{array} \right]\)
\( \left[\begin{array}{lcr} 0, 0, 1,0 \end{array} \right]\)
Now show cat, then car then ship, then dog again and keep growing the matrix
\( y = f(x) \) [true relation, unknown]
\( \hat{y} = \hat{f}(x) \) [our approximation]
Models
What are the choices for \( \hat{f} \) ?
(c) One Fourth Labs
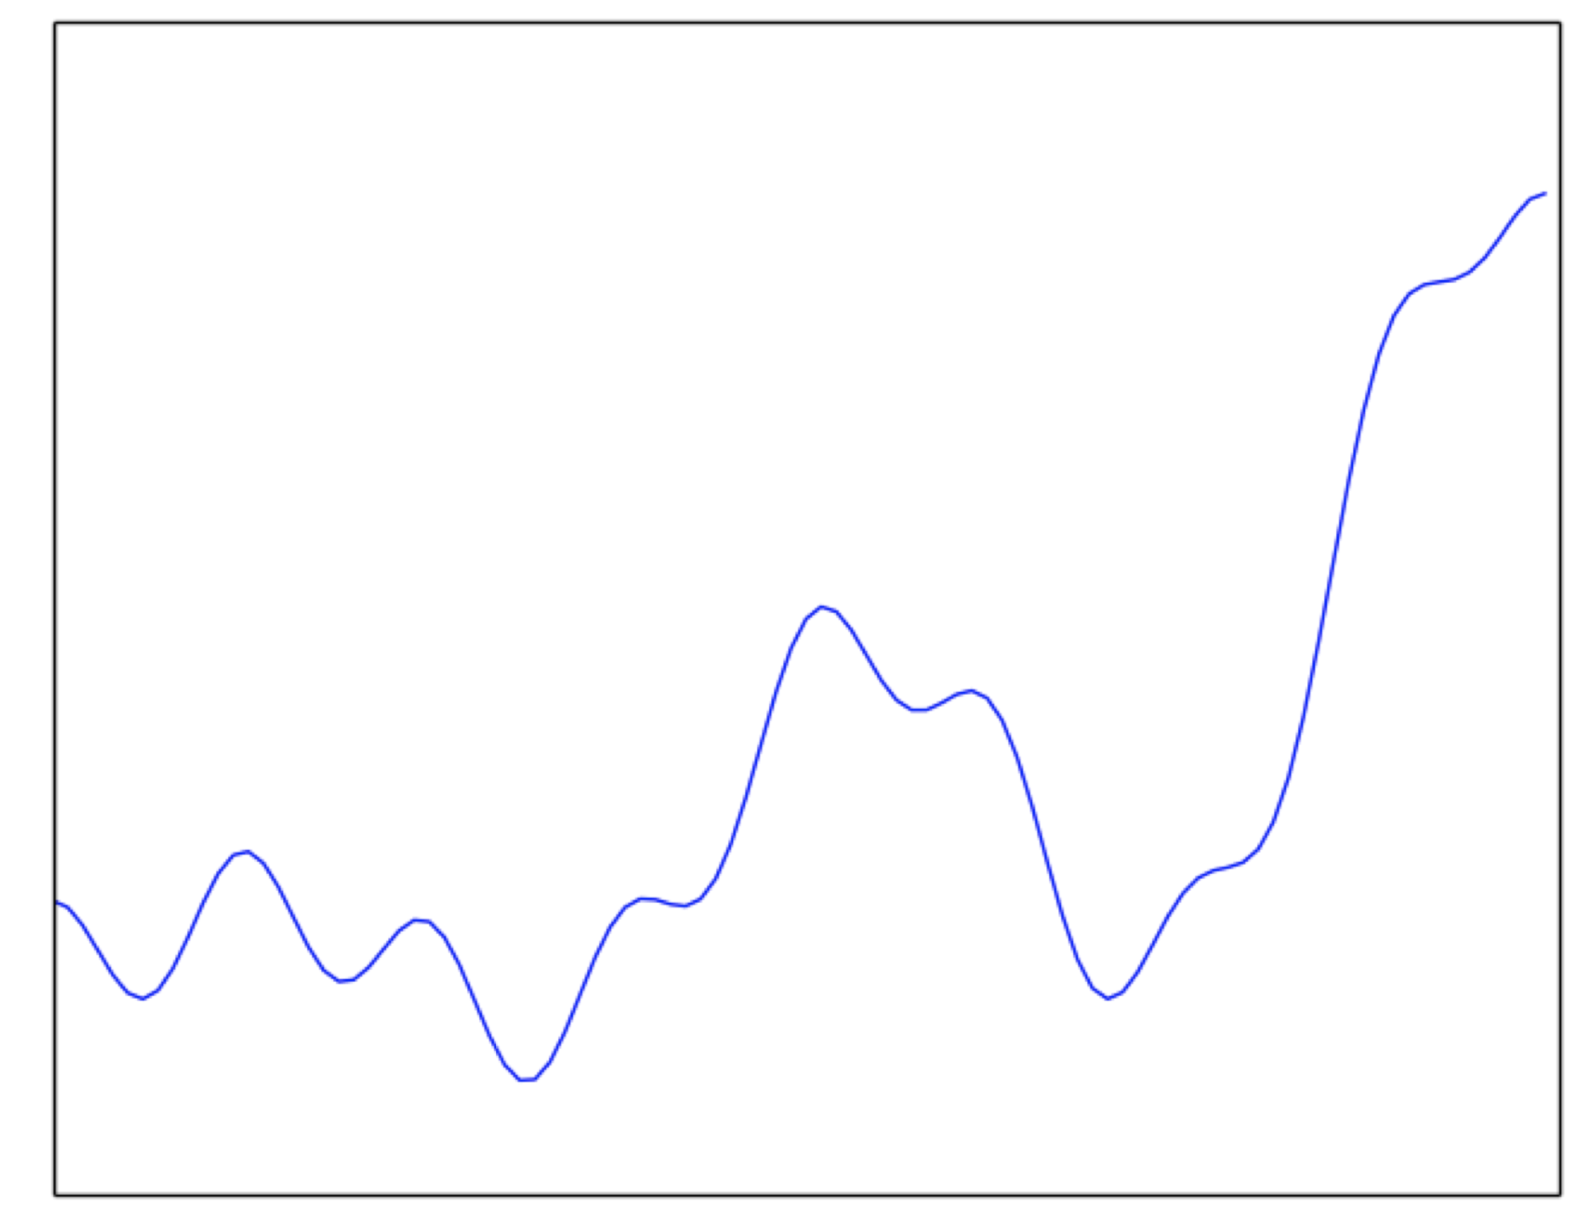
- Show some points sampled from this function
- Say that there is some complex relation between x
- Naively I assumed that its y=mx + c
- no matter how I adjust m and c I can't make f and \( \hat{f} \) equal
- Let's try net function...better...better better
\( y = mx + c \)
\( y = ax^2 + bx + c \)
\( y = \sigma(wx + b) \)
\( y = AlexNet(x) \)
\( y = \hat{f}(x) \) [our approximation]
\( \left [\begin{array}{lcr} 0.2\\ 0.1\\ 0.7\\ ....\\0.8 \end{array} \right]\)
\( \left [\begin{array}{lcr} 2.2\\ 3.1\\ 0.7\\ ....\\4.8 \end{array} \right]\)
\( x \)
\( y \)
\( y = ax^3 + bx^2 + cx + d \)
\( y = ax^4 + bx^3 + cx + d \)
Models
Why not just use a complex model always ?
(c) One Fourth Labs
\( \left [\begin{array}{lcr} 0.2\\ 0.1\\ 0.7\\ ....\\0.8 \end{array} \right]\)
\( \left [\begin{array}{lcr} 0.4\\ 0.2\\ 1.4\\ ....\\1.6 \end{array} \right]\)
\( x \)
\( y \)
This will be replaced by a simple line
We will show animation how it will be easy to fit a line but difficult to fit 100 degree polynomial
\( y = mx + c \) [true function, simple]
\(y = ax^{100} + bx^{99} + ... + c \) [our approximation, very complex]
- Overkill
- Harder to Learn
- Need More data
Models
What are the choices for \( \hat{f} \) ?
(c) One Fourth Labs
Add model jar
Loss Function
How do we know which model is better ?
(c) One Fourth Labs
\( \left [\begin{array}{lcr} 0.2\\ 0.1\\ 0.7\\ ....\\0.8 \end{array} \right]\)
\( \left [\begin{array}{lcr} 0.4\\ 0.2\\ 1.4\\ ....\\1.6 \end{array} \right]\)
\( x \)
\( y \)
\( \hat{f_1}(x) = ax^2 + bx + c \)
\( \hat{f_2}(x) = ax^3 + bx^2 + cx + d \)
\( \hat{f_3}(x) = ax^4 + bx^3 + cx + d \)
?
Show plots for true f and f_1 f_2 f_3... From the plots it will not be clear
but from the columns it will be clear
why is it clear? because you are computing some numbers
\( y_1 \)
\( y_2 \)
\( y_3 \)
Loss Function
What does a loss function look like ?
(c) One Fourth Labs
\( \left [\begin{array}{lcr} 0.2\\ 0.1\\ 0.7\\ ....\\0.8 \end{array} \right]\)
\( \left [\begin{array}{lcr} 0.4\\ 0.2\\ 1.4\\ ....\\1.6 \end{array} \right]\)
\( x \)
\( y \)
\( \hat{f_1}(x) = ax^2 + bx + c \)
\( \hat{f_2}(x) = ax^3 + bx^2 + cx + d \)
\( \hat{f_3}(x) = ax^4 + bx^3 + cx + d \)
?
Show squared error loss
compute the error for y_1, y_2, y_3
Indeed y_2 seems to be the better model
\( y_1 \)
\( y_2 \)
\( y_3 \)
Loss Function
What does a loss function look like ?
(c) One Fourth Labs
Add jar for loss function and have a recap
Who will give us the parameters ?
Learning Algorithm
How do we identify parameters of the model?
(c) One Fourth Labs
Show data on LHS
A box for learning on the RHS
A complex model equation on top of the box
Loss function at the bottom of the box
In Plain English:
Say that this is a search problems
Simplest algorithm is to use brute force on this 3-dimensional parameter space
But now imagine what happens if you have more than 3 parameters!
Learning Algorithm
How do we identify parameters of the model?
(c) One Fourth Labs
Show data on LHS
A box for learning on the RHS
A complex model equation on top of the box
Loss function at the bottom of the box
In Plain English:
We want to find the parameters a, b, c such that when we plugin a x into the f(x) the output should be as close to the true output
Mathematically,
Optimization problem
Minimization function
Learning Algorithm
How do we identify parameters of the model?
(c) One Fourth Labs
Show data on LHS
A box for learning on the RHS
A complex model equation on top of the box
Loss function at the bottom of the box
Now show images of Gradient Descent, Adam, Adagrad, etc. with citations
Learning Algorithm
How do we identify parameters of the model?
(c) One Fourth Labs
Add jar for Learning Algorithm
Evaluation
How do we compute a score for our ML model?
(c) One Fourth Labs
Show a matrix for x and y
Now add a matrix y for model predictions
Now show ticks and crosses and show we can compute accuracy (show formula)
End by saying that there are other metrics such as precision, recall, etc.
Standard evaluation (example ImageNet)
Evaluation
What are some other evaluation metrics
(c) One Fourth Labs
Show a matrix for x and y
Now add a matrix y for model predictions which is a ranked list
Now show ticks and crosses for top-1, top-5
End by saying that there are other metrics such as precision, recall, etc.
Standard evaluation (example ImageNet)
Evaluation
How is this different from loss function ?
(c) One Fourth Labs
Task is whether I should press the brake or not. I just want to know how many times I did this correctly
But to train the model I might choose to use the distance form the obstruction as a metric for training the model.
Evaluation
Should we learn and test on the same data?
(c) One Fourth Labs
Does it make sense to have same question as homework and exam. Why not?
This can over-estimate your performance
For an unbiased evaluation, test data should be different from train data
Typically split 80:20
Evaluation
How is this different from loss function ?
(c) One Fourth Labs
Add jar for evaluation
Putting it all together
How does all the jargon fit into these jars?
(c) One Fourth Labs
Show six jars
Data, democratisation, devices
Why ML is very successful?
(c) One Fourth Labs
Show six jars
Rapid progress and revolution in algorithms which have been democratized
Standardized evaluation, learning, loss, models
Standardize frameworks
You focus on getting data and formulating tasks
Typical ML effort
How to distribute your work through the six jars?
(c) One Fourth Labs
Show six jars
Connecting to the Capstone
How to distribute your work through the six jars?
(c) One Fourth Labs
- Data curation, labelling
- Task identification
- Model selection
- Formulating loss function
- Learning algorithm with bag of tricks
- Evaluation
Assignment
How do you apply the six jars to a problem that you have encountered?
(c) One Fourth Labs
Explain the problem
Give link to the quiz
Suman's Copy of 1.3 The Six Elements of ML
By suman banerjee


