Measuring the Intangible
How to convince your HiPPO with science!
#DDDEU Hands-on
It's Friday afternoon!
Time for some exercise!
Think about something in your past that you thought would be too hard or even impossible to measure!
...and put it on a sticky note!
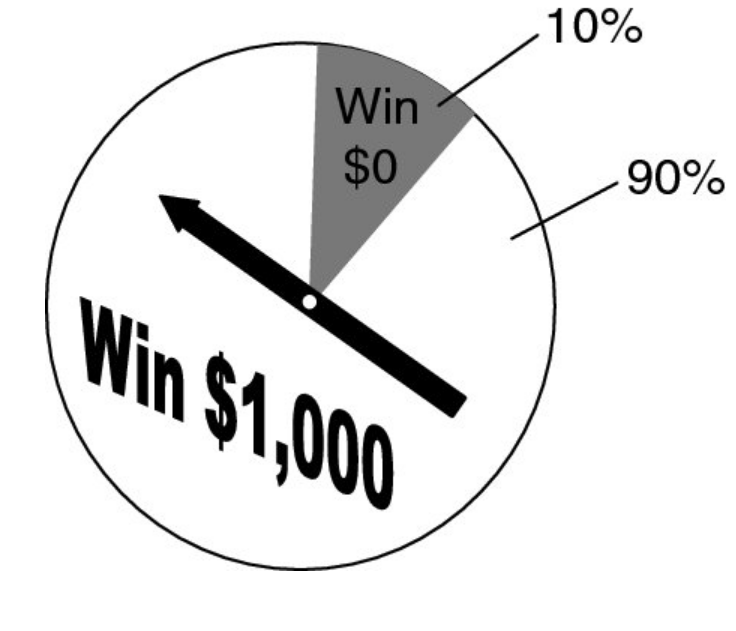
The Mystery Urn
Suppose I have a warehouse full of large urns.
Each urn is filled with marbles and each marble is either green or red.
The percentage of green marbles is anywhere between 0% and 100%, and all percentages are equally likely.
The remaining portion of the urn is red marbles.
The Mystery Urn
Let's play a betting game!
You draw an urn at random and then bet on the majority of marbles.
Question
What your chance of being correct?
50%
The Mystery Urn
Let's now give this game another twist!
You are right: 10€ for you
You are wrong: 10 € for me
But you can buy a peek into the urn!
Group A: 1€ per peek
Group B: 4€ per peek
Group C: 5€ per peek
Group D: 7€ per peek
Within your group please discuss if you should play the Mystery Urn game when you have to pay:
Activity
5 min
Value of Information
V_i = V_b - V_a
The value of information of a sample is simply the value before the observation minus the value afterwards.
Why is our intuition wrong?
Our thesis is that people have strong intuitions about random sampling; that these intuitions are wrong in fundamental respects; that these intuitions are shared by naive subjects and trained scientists; and that they are applied with unfortunate consequences in the course of scientific inquiry.
Kahneman, Tversky
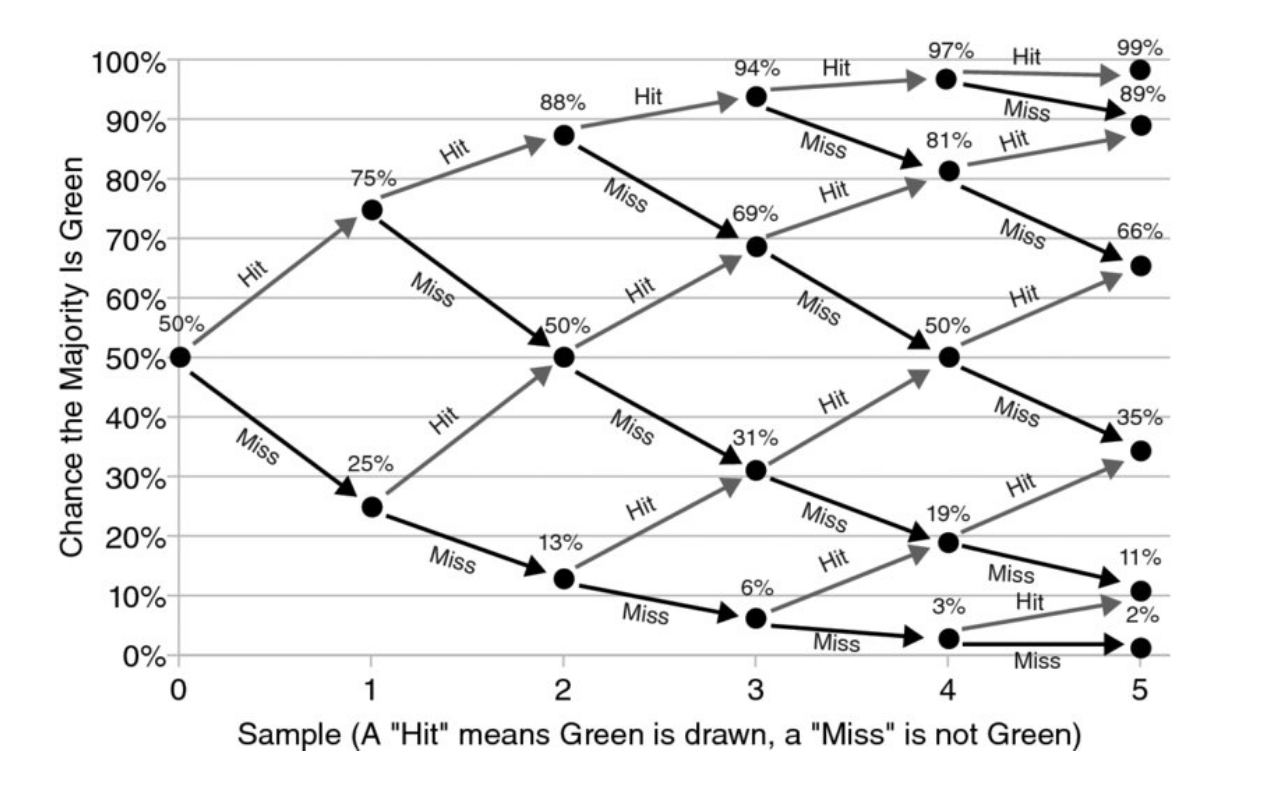
The power of small samples
The Rule of Five:
There is a 93.75% chance that the median of a population is between the smallest and largest value in a sample of five from that population.
The Single Sample Majority Rule:
Given maximum uncertainty (0% - 100%) about a population, there is a 75% chance that a single randomly selected sample is from the majority of the population.
Activity
5 min
Within your group please discuss what measurement means to you and write it down the definition on the whiteboard/flipchart.
Definition of Measurement
An "Information Theory" version
Measurement: A quantitatively expressed reduction of uncertainty based on one or more observations.
Definition of Uncertainty
Uncertainty: The lack of complete certainty; the existence of multiple possibilities and the outcome is unknown
Measurement of Uncertainty: A set of probabilities assigned to a set of possibilities.
Example: "There is a 60% chance that the market will double in five years, a 30% it will grow at a slower rate, and a 10% chance that it will shrink over the same period
Definition of Risk
Risk: A state of uncertainty where some of the possibilities involve a loss, catastrophe or other undesirable outcomes
Measurement of Risk: A set of possibilities each with quantified probabilities and quantified losses.
Example: "There is a 40% chance that the proposed oil well will be dry with a loss of €12 million in drilling costs."
Scenario
-
€ 500 million revenue in 2019 (-20%)
-
Waterfall project management
-
Monolithic application with a high degree of coupling
-
Tech costs: € 80 million in 2019 (+15%)
-
Market share: 35% in 2019 (-10%)
Applied Information Economics
- Define a decision problem and the relevant uncertainties
- Determine what you know now
- Compute the value of additional information (if none, go to 5)
- Invest into making high-value measurements (return to 2)
- Make a decision and act on it (repeat with step 1)
in five steps...
Defining the Decision problem
Decision requirements
- It has two or more realistic alternatives
- There is uncertainty
- It has potentially negative consequences
- It has a decision maker
A decision has to be defined well enough
to model it quantitatively!
A ridiculously simple decision model
- Estimated Costs of Action X
- Estimated Benefits of Action X
- If Benefits of Action X exceed Costs of Action X
execute Action X
Now just decompose costs and benefits into more detail as needed!
Wait, there was some science!
-
Lead time for changes (A)
-
Deployment frequency (B)
-
Time to restore service (C)
-
Change failure rate (D)
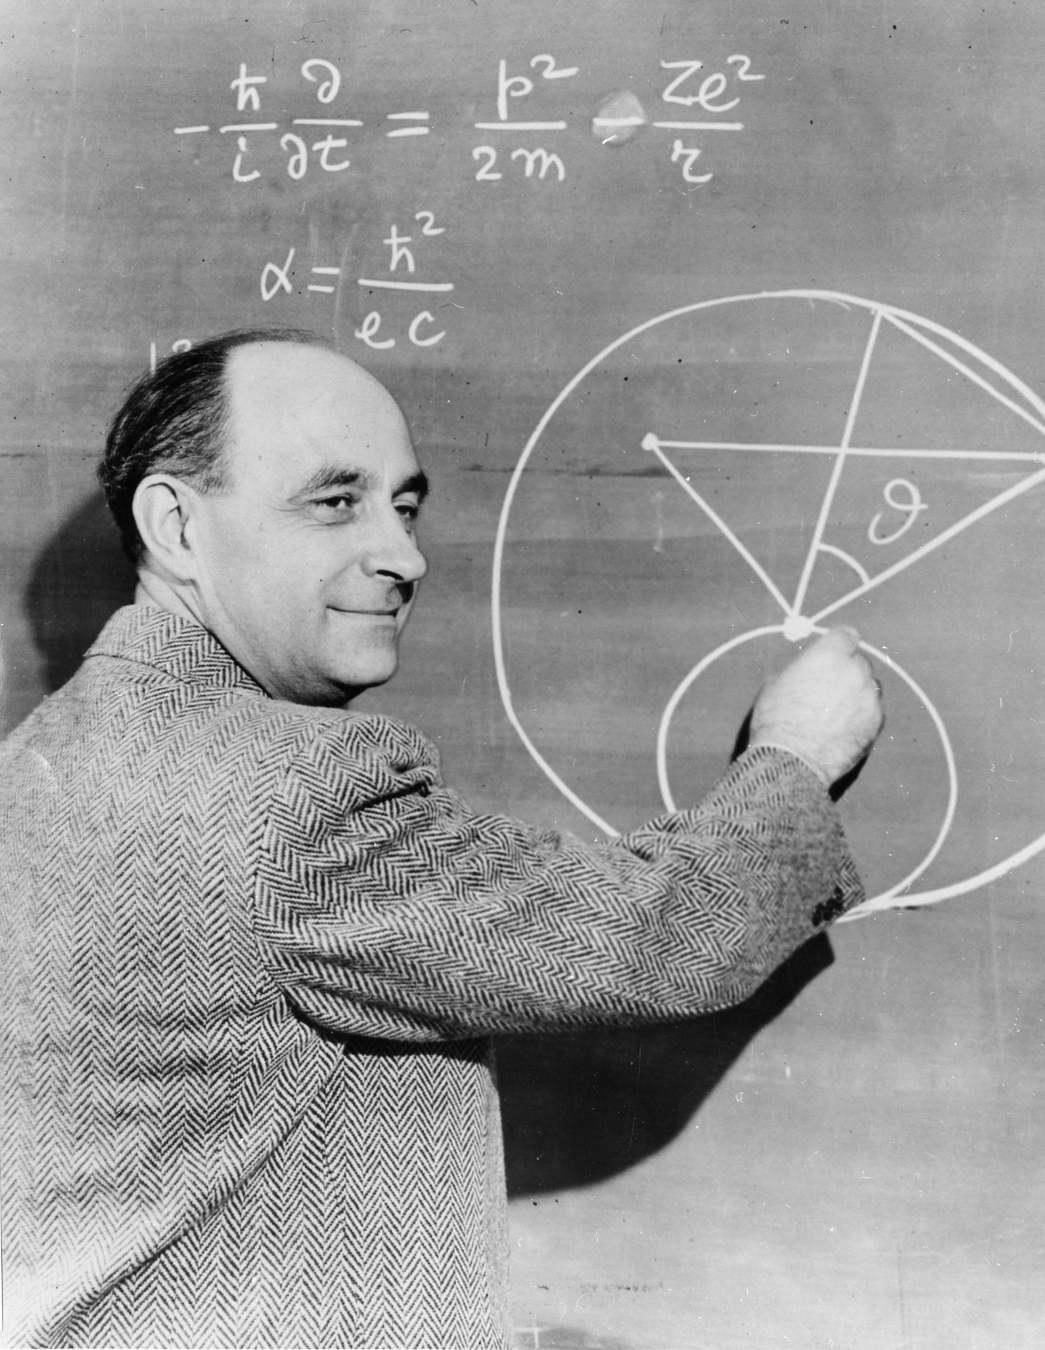
* 29th September 1901 in Rome, Italy
† 28. November 1954 in Chicago, Illinois
Enrico Fermi
Noble price for physics in 1938
Time to decompose!
Activity
15 min
- Within your group identify an action that you could take to influence one of the predictors.
- Decompose the possible costs and benefits that you expect further.
Tip: Apply the Alien Scientist heuristic!
How much do you know now?
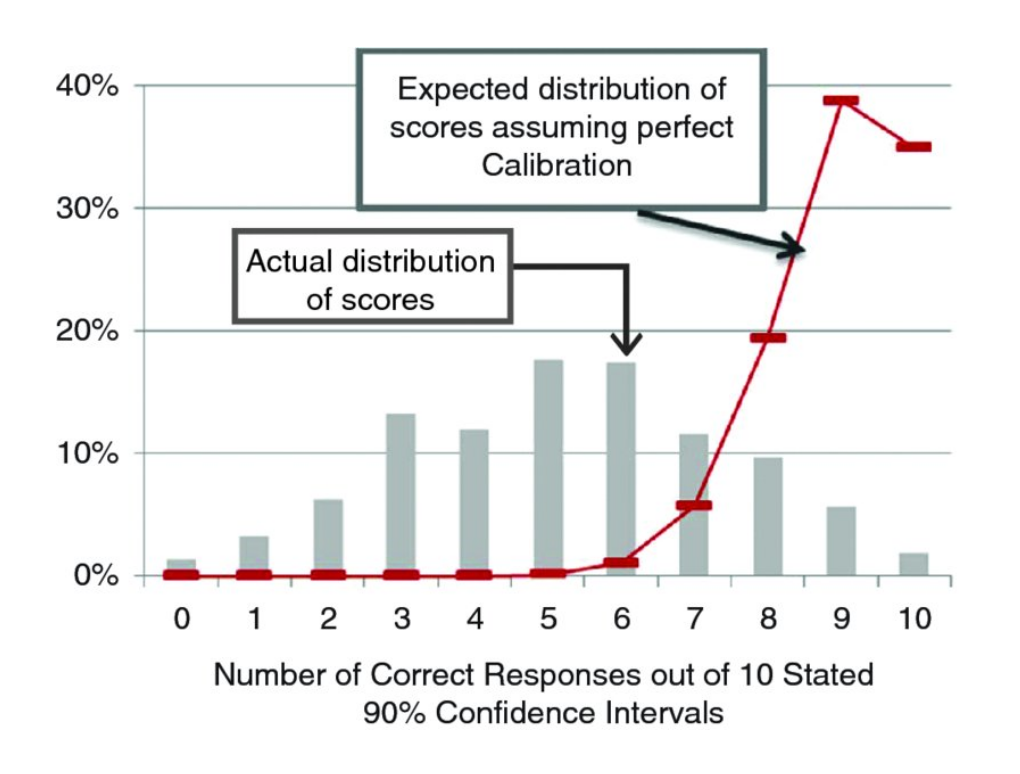
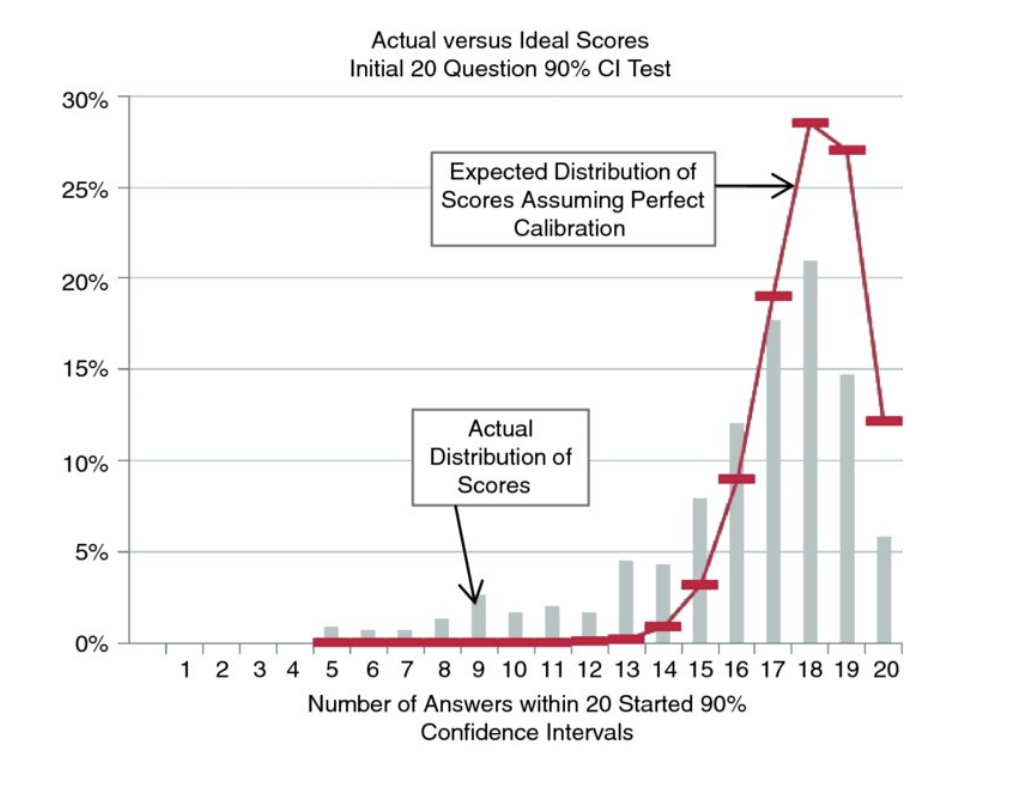
Calibrated Estimates
The most important questions of life are indeed, for the most part, really only problems of probability
Pierre Simon Laplace
How much do you know now?
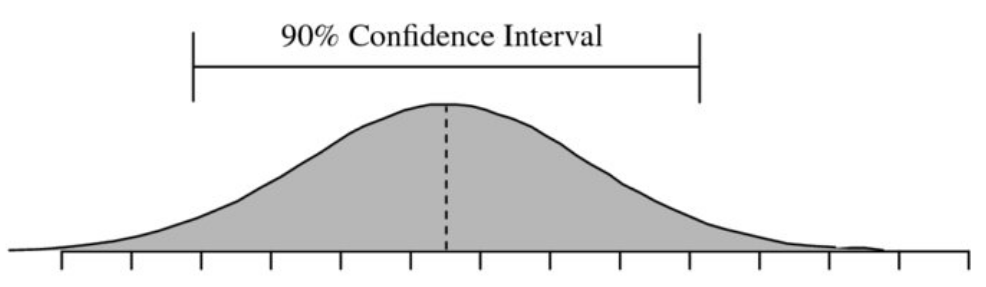
Confidence Intervals
In statistics, a range that has a particular chance of containing the correct answer is a Confidence Interval (CI)
Subjective Confidence
Overconfidence: When a person routinely overstates knowledge and is correct less often than he or she expects.
Underconfidence: When a person routinely understates knowledge and is correct much more often than he or she expects.
Time to estimate!
Activity
10 min
- Pick the three most important variables from the decomposition (i.e. dot voting)
- Each group member should estimate their 90% CI for the variables
Assessing your own uncertainty is a
general skill that can be taught with measurable improvement!
Heuristics #1 - Equivalent Bet
Heuristics #2 - You're wrong
Assume you're wrong and explain to yourself why!
Heuristics #3 - Avoid anchoring
Are you 95% certain that the correct answer over/under the lower/upper bound?
Heuristics #4 - Reverse anchoring
Start with an extreme wide range and make an absurdity test
Revisit your estimates!
Activity
10 min
Apply the aforementioned heuristics to your estimates.
Heuristics #1 - Equivalent Bet
Heuristics #2 - Assume you're wrong
Heuristics #3 - Avoid anchoring
Heuristics #4 - Absurdity test
When presented new information, we have no other option than to relate it to what we already know - there is no blank space in our minds within which new information can be stored so as not to "contaminate" it with existing information.
Clifford Konold, University of Massachusetts
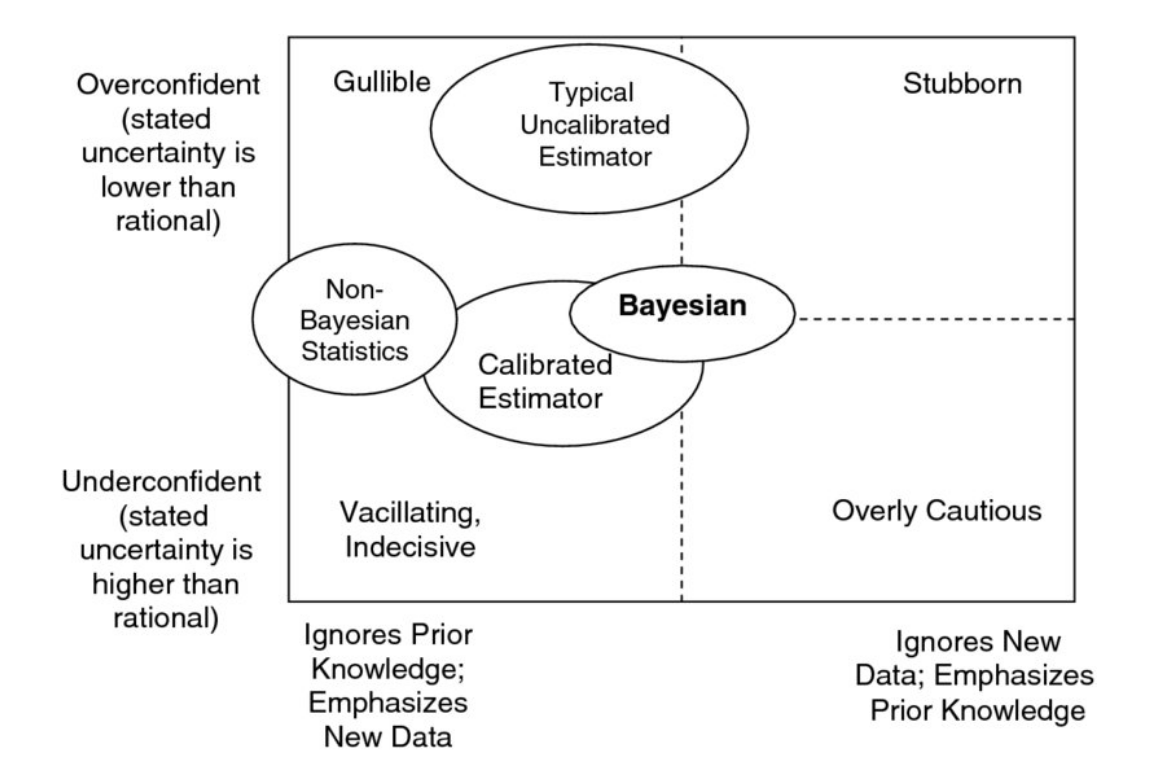
Instinctive Bayesian Approach
- Start with your calibrated estimate
- Gather additional information
- Update your calibrated estimate
No maths needed!
Observation Biases
- Expectancy Bias
- Selection Bias
- Observer Bias
Let's go to Monte Carlo
Activity
10 min
Let's come together and discuss how we can build a Monte Carlo simulation.
sd_{90\%} = 3.29

Hands-on: Measuring the intangible
By Thomas Ploch
Hands-on: Measuring the intangible
A repeating pattern I have discovered during discussions with participants of DDDEU over the last years was always that people are not able to calculate risk and potential value for intangible assets like "organisational flexibility" in the presence of uncertainty for adopting the modern organisational patterns and principles that the DDD community embraces. Senior managers in larger organisations are seldomly convinced to board such an endeavour just by opinions and subjective assessments. During these conversations I regularly ask if people have thought about creating a business case that would enable senior management to make a risk vs. value potential decision. And most of the time people do not know how to create such a case, because these "intangibles" seem impossible to measure. But they are! It is possible by employing statistical methods to derive probabilities for ranges of possible outcomes that are built from various sources of information, i.e. calibrated expert knowledge. Said information can be annotated with an "expected value" when discovered, and other quantitative and qualitative data that doesn't seem obvious in the beginning. This workshop would teach the basics of bayesian probabilities, how to calibrate people to better estimate ranges of possible outcomes (50% confidence, 70% confidence, 90% confidence), how to weigh results by the expected value of


