Applied Microeconomics
Lecture 2
BE 502
Plan for Today
Elasticity
Demand Estimation
Tagamet Case
Tagamet Case
Firm Costs (if there's time!)
Review: Supply and Demand
From "Terrible Timing for a Hotel Boom" (NYT, July 2008)
A record number of hotels are opening this year, and the timing could not be worse… Until recently, the industry was in the midst of a major boom… But business in particular areas – like Maui in Hawaii … – has already fallen off a cliff.
What changed for the hotels in the article?
Review: Supply and Demand
(Putting numbers to the analysis -- take the Qs to be in 1000s):
Demand for high-end hotel stays in Maui in 2006 is given by:
Qd=400-(1/4)*P
The quantity supplied (in the short run) is fixed at 200.
What is the equilibrium price?
Why is this an equilibrium?
Review: Supply and Demand
In 2008, demand for high-end hotel stays drops to:
Qd=300-(1/4)*P.
At the same time, because of the hotel construction boom, supply has increased to Qs=250.
What is the new equilibrium price and quantity?
Review: Supply and Demand
Australia's Wines Expanding Their Global Shelf Space.
What were some factors mentioned in the article that affected the supply of Australian wines?
What were some factors that affected the demand for Australian wines?
What were some factors mentioned in the article that affected the supply of Australian wines?
What were some factors that affected the demand for Australian wines?
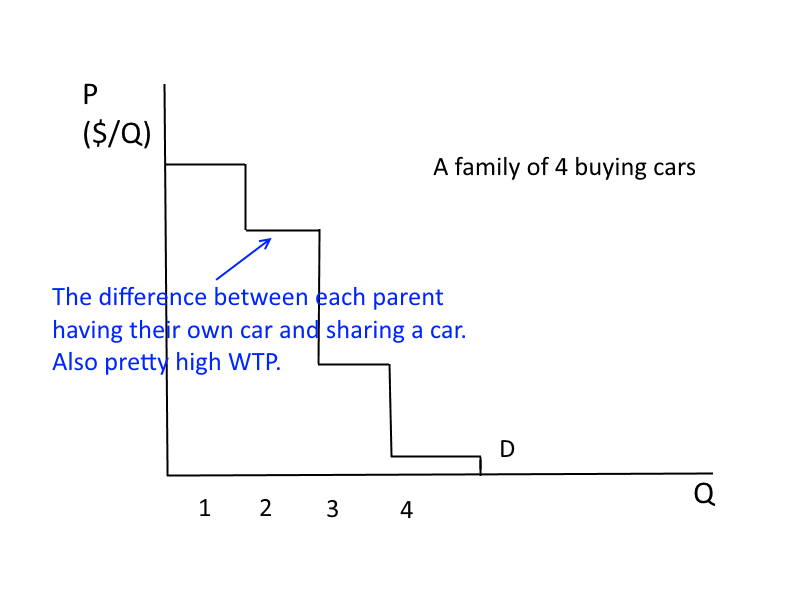
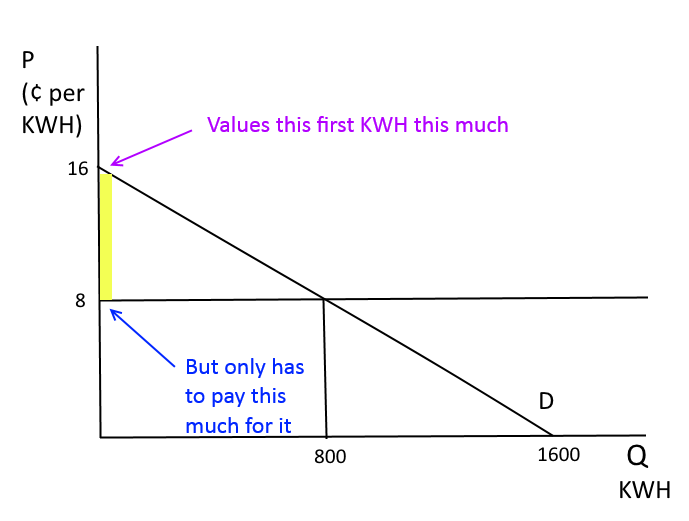
Willingness to Pay
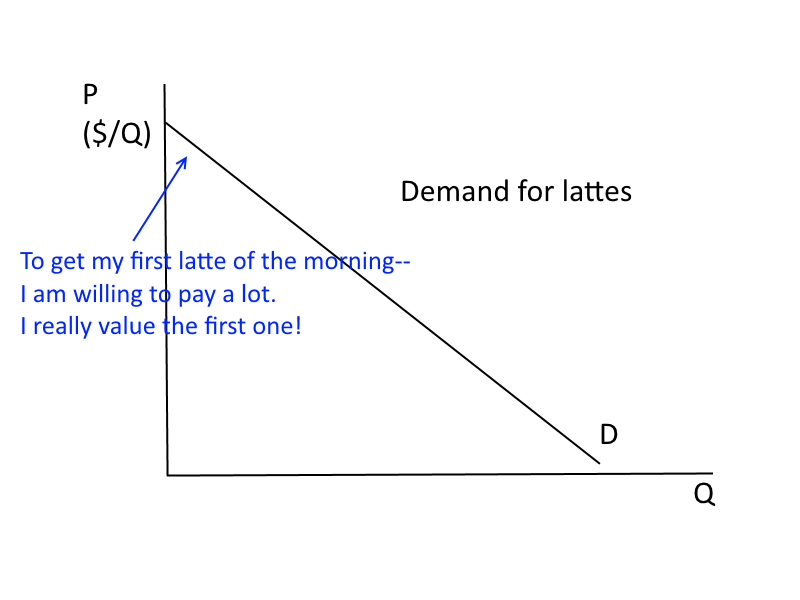
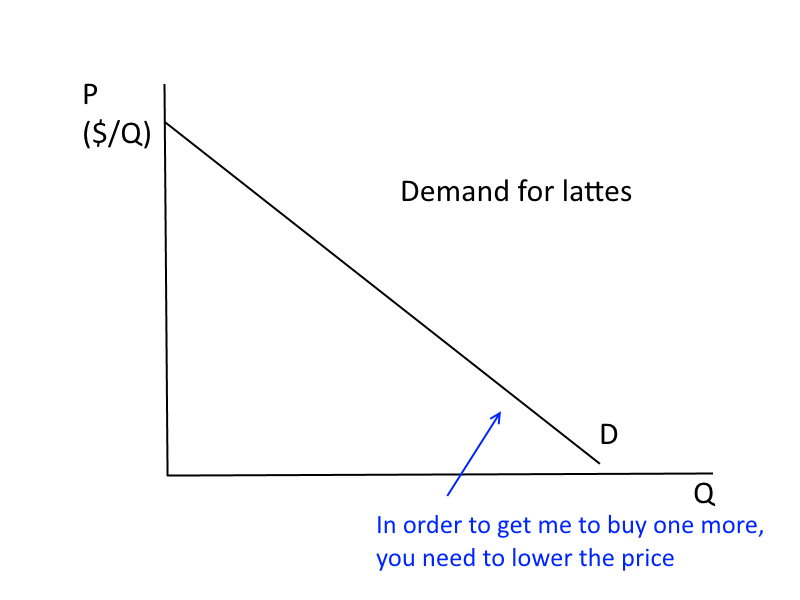
"Willingness to pay" interpretation of the demand curve:
The height of the demand curve shows the maximum amount the consumer is willing (and able) to pay to get one more unit of the good.
Willingness to Pay
Willingness to Pay
Willingness to Pay
Another way to think of it...
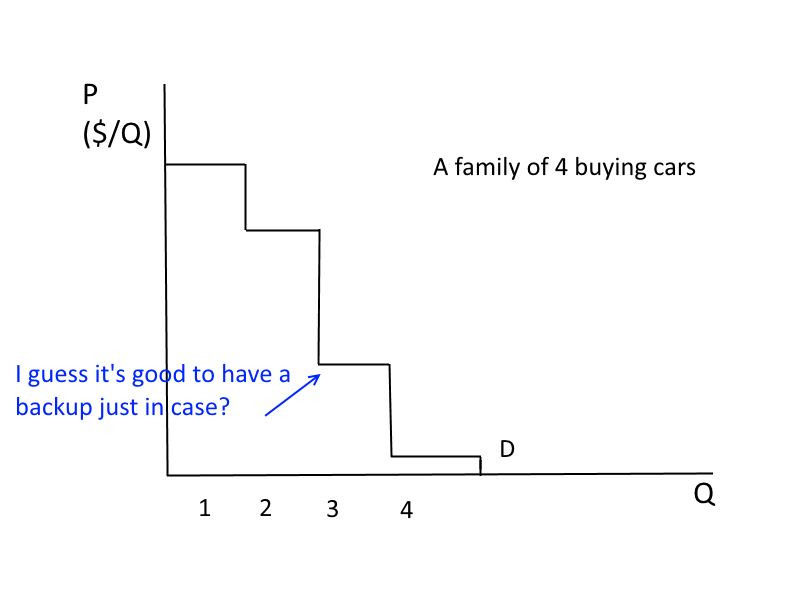
Willingness to Pay
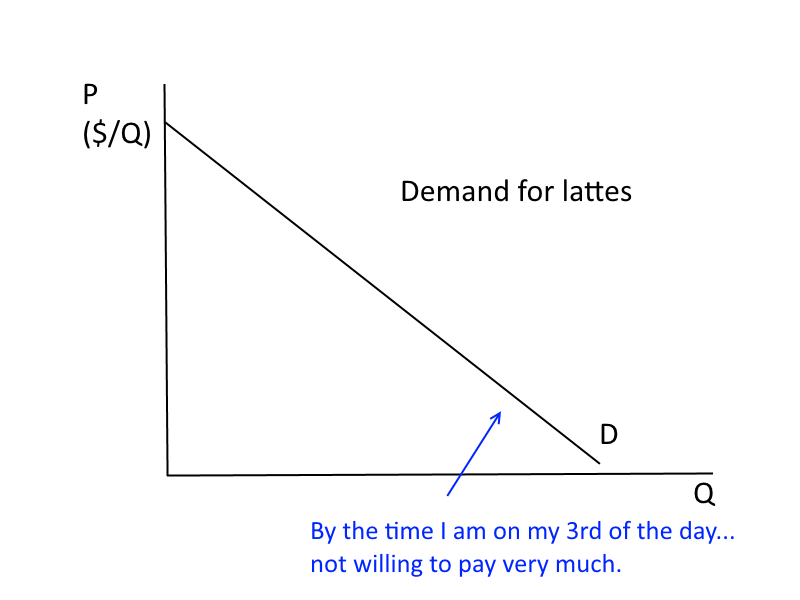
Economists refer to this phenomenon as
Diminishing marginal utility (or diminishing marginal value): principle that as more of a good is consumed, the consumption of additional amounts will yield smaller additions to utility.
Willingness to Pay
Willingness to Pay
Willingness to Pay
Willingness to Pay
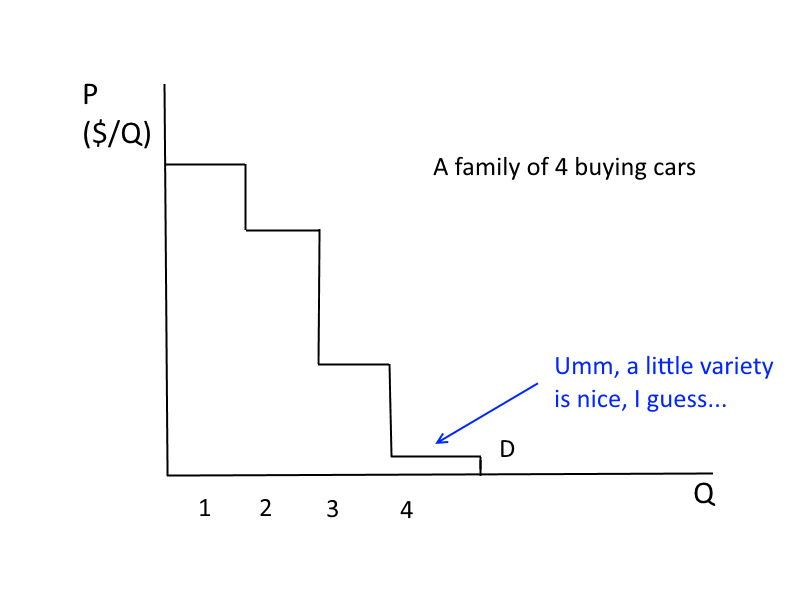
Willingness to Pay
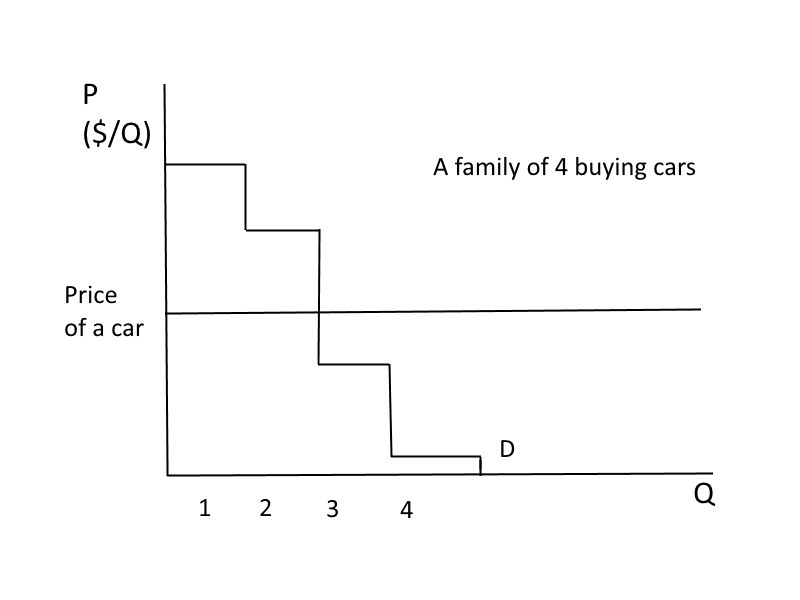
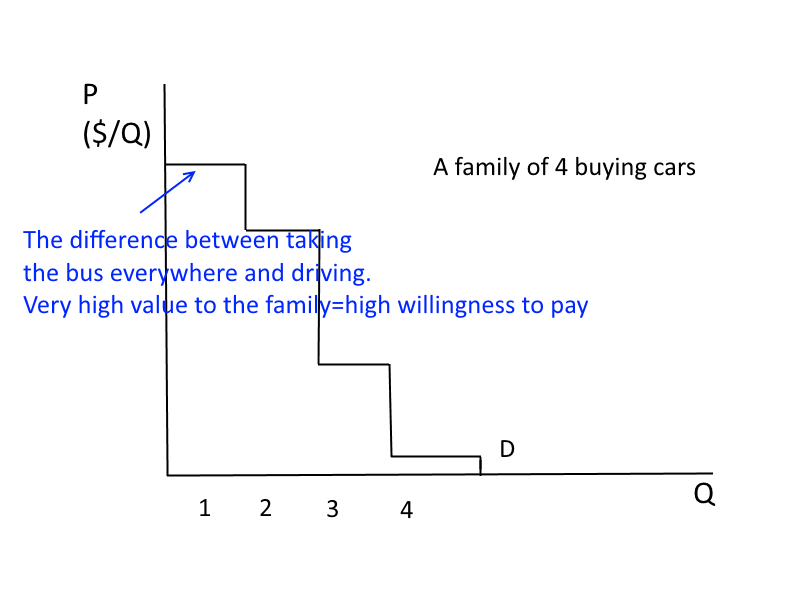
If this is the price--how many cars would the family buy? Why?
Willingness to Pay
The family is making the decision at the margin: do I want to buy one more car?
Electrical Power Purchasing
Philadelphia
Electrical Power Purchasing
Philadelphia
Electrical Power Purchasing
Northern Indiana
Electrical Power Purchasing
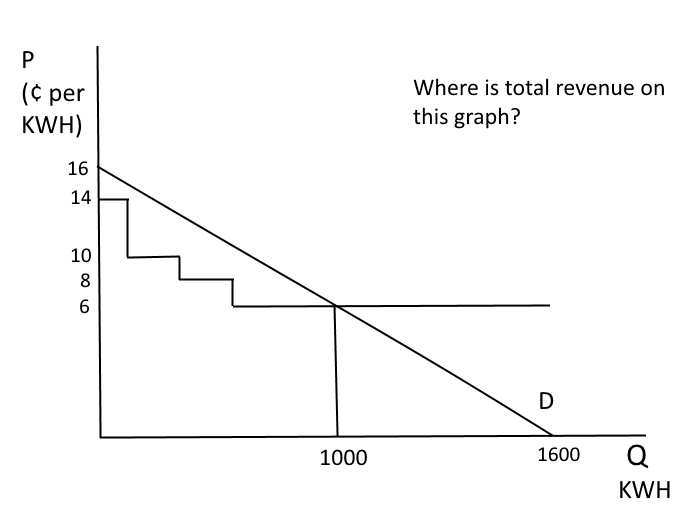
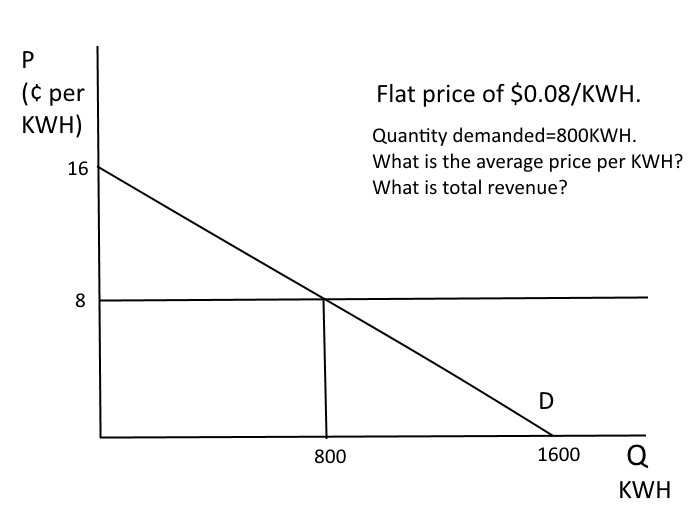
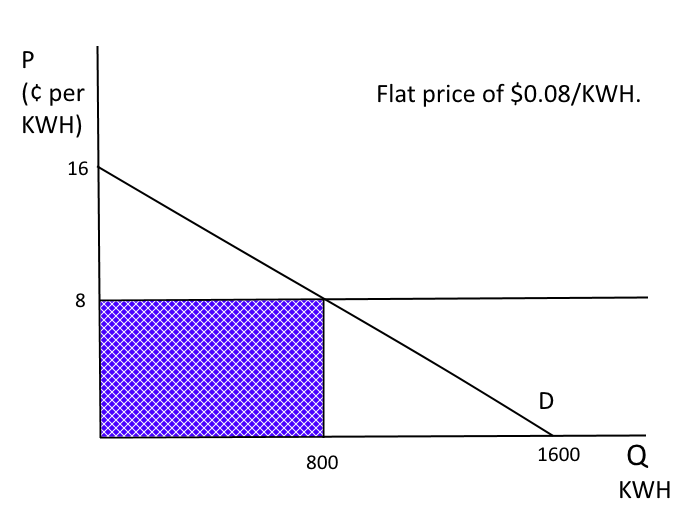
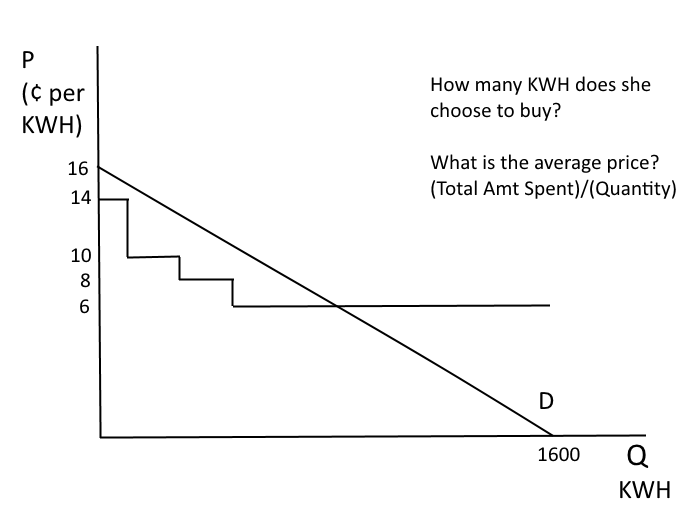
Electrical Power Purchasing
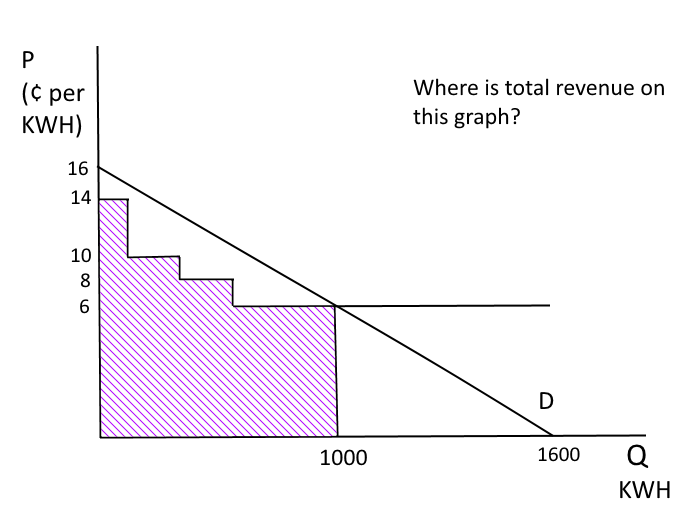
Electrical Power Purchasing
If the average prices are the same, why is she buying more in Indiana?
Where is she better off?
Electrical Power Purchasing
Electrical Power Purchasing
Electrical Power Purchasing
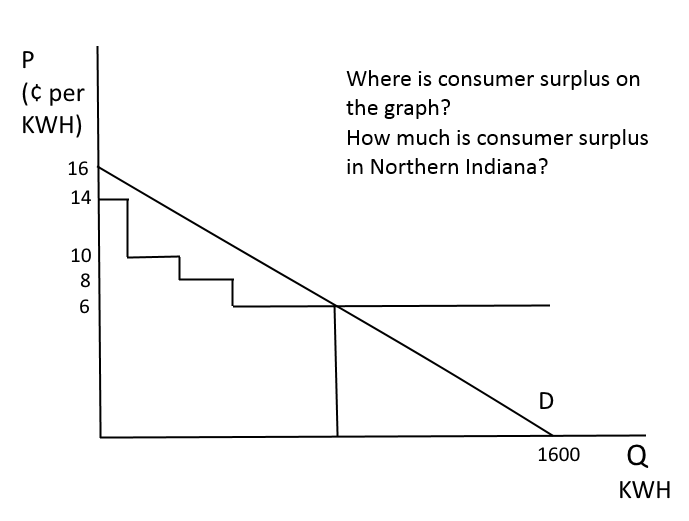
Electrical Power Purchasing
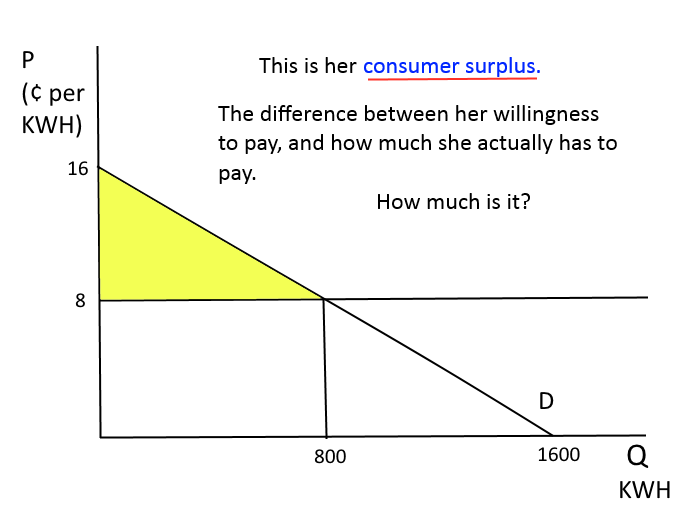
Consumer surplus is how economists measure the value that consumers get out of participating in a market.
Advantages:
-
Quantifies consumer value (what are the units?).
-
Allows us to conduct "normative" analysis (i.e., consumer is "better off" in one situation or another)
Disadvantages:
-
Based on being "willing and able to pay".
- You might really value things you cannot pay for (food, clothes, health)
Electrical Power Purchasing
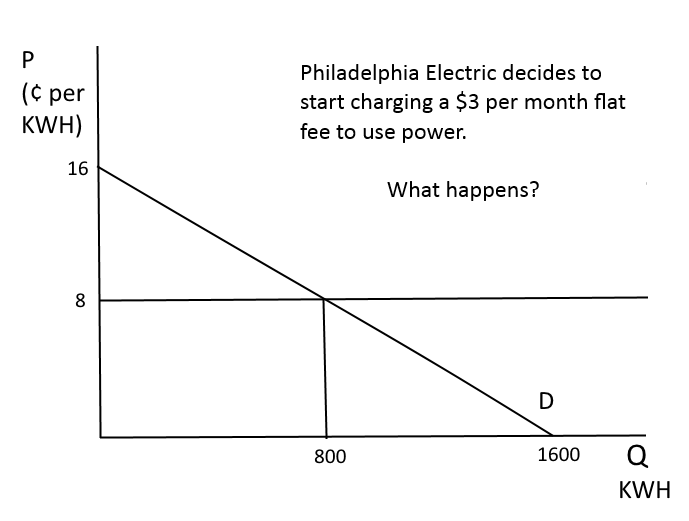
Where else do we see this type of pricing?
Elasticity
When Prices Change, How Will Consumers Respond?
From “Cosi is Good to Go” (August 2008):
RJ Dourney, owner of 13 Cosi franchises in the Boston area, has raised prices by 4 percent over the last year. Raising prices is always a suspenseful proposition, but it’s worked out well for Dourney. “I have seen no guest-count erosion,” says Dourney…
When Prices Change, How Will Consumers REspond?
From “Cosi is Good to Go” (August 2008) (cont):
The 4 percent figure wasn't guesswork, Dourney based it on reports that franchisor Cosi Inc. commissions from Revenue Management Services, a Tampa Fla-based consulting firm
"… the reports … tell you how much room you have in pricing before you start losing guests…"
Elasticity
The concept of elasticity measures how sensitive the quantity demanded is to a change in price.
When price changes, how much will the quantity demanded change?
Think of three products--"Not very sensitive", "Somewhat sensitive" and "Very sensitive" and why.
Elasticity
Some things that effect elasticity:
-
Availability of close substitutes
-
Necessities vs Luxuries
-
Narrow vs. broadly defined markets
- Fraction of consumer's budget taken up by the good
Elasticity
One of the most commonly used measures of sensitivity of the demand curve is own price elasticity.
The own price elasticity of demand (ɛ): percentage change in the quantity demanded of a good for a 1 percent increase in its price.
What is the sign of ɛ?
Elasticity
Elasticity is calculated as:
ɛ = (Change in Q)/Q
(Change in P)/P
This can be written as:
ɛ= [Change in Q/Change in P] * (P/Q)
How is this related to our LINEAR graph of demand?
Elasticity
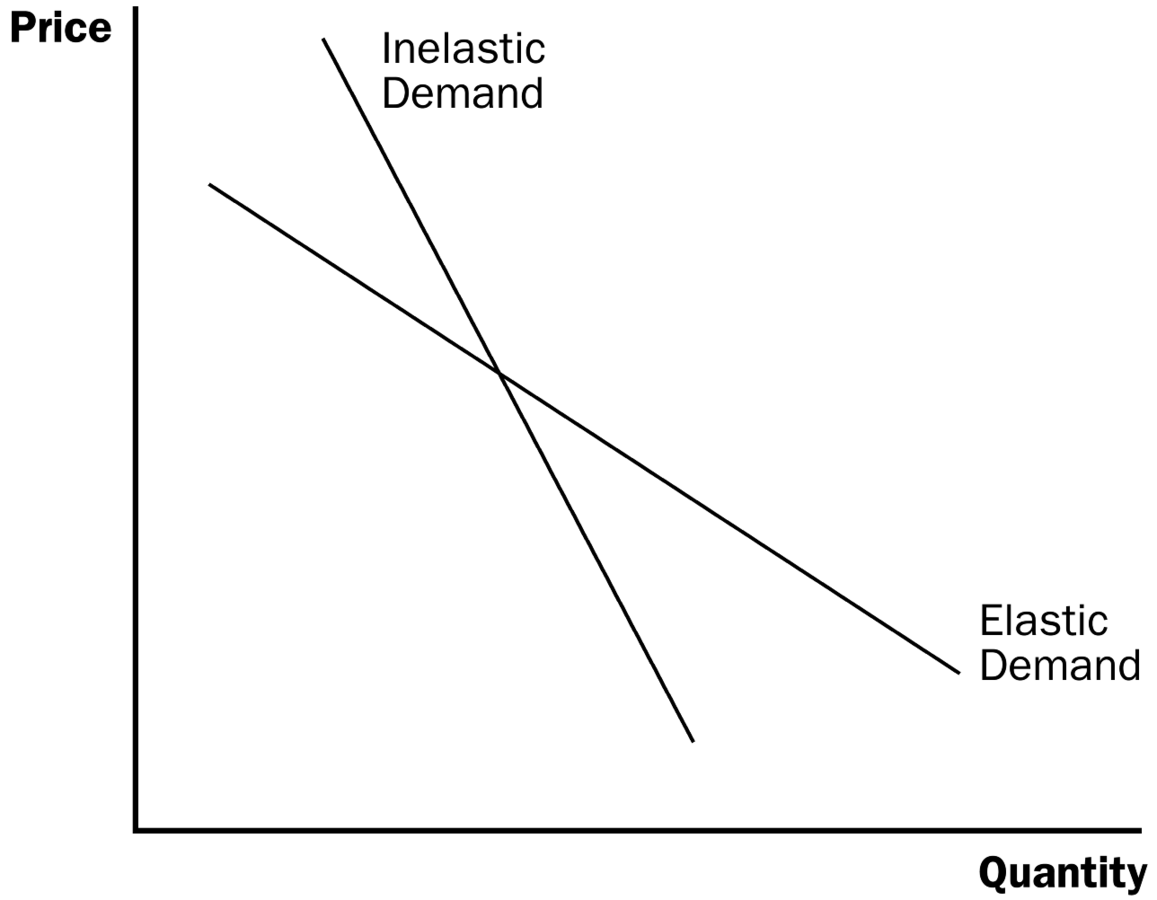
Two important things to note:
(1) Elasticity can be used to compare 2 different demand curves at the same point. The demand curve with the steeper slope is [MORE or LESS ?] elastic than the demand curve with the flatter slope.
(2) Elasticity changes as you move along the same demand curve--some parts of the demand curve are more elastic.
Elasticity
Elasticity
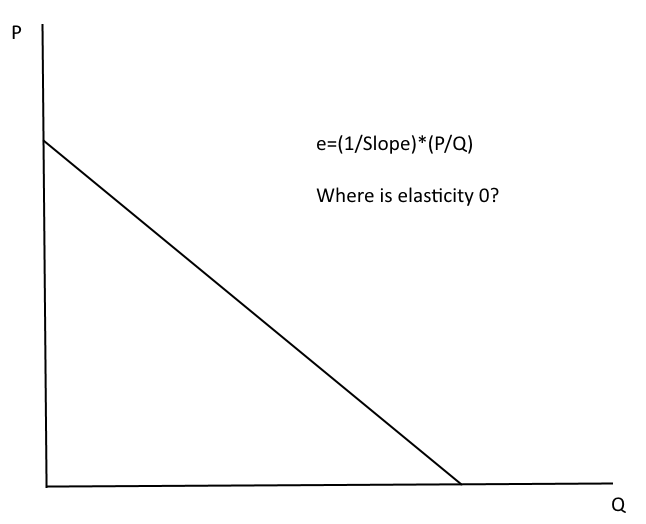
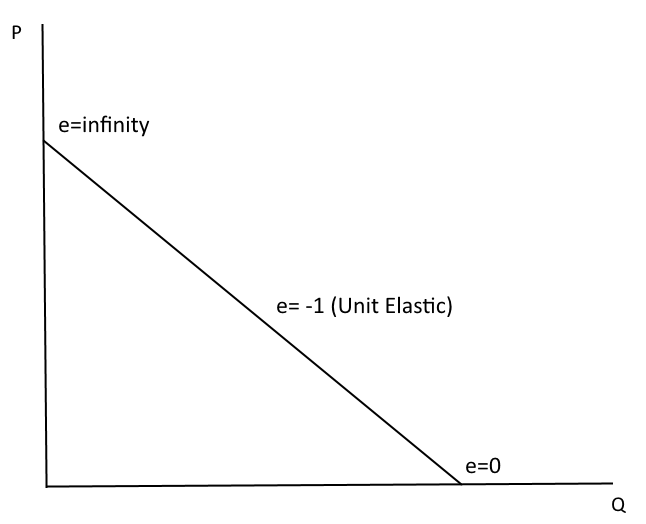
ɛ = (Change in Q/Change in P) * (P/Q)
What changes as we move along a linear demand curve?
Change in Q/Change in P = (1/Slope) -- This is fixed if demand is linear.
(P/Q) -- This changes as we move along the demand curve.
Elasticity
Elasticity
For example, if a 5% increase in price results in a 10% decrease in quantity demanded, elasticity is -2.
Elasticity
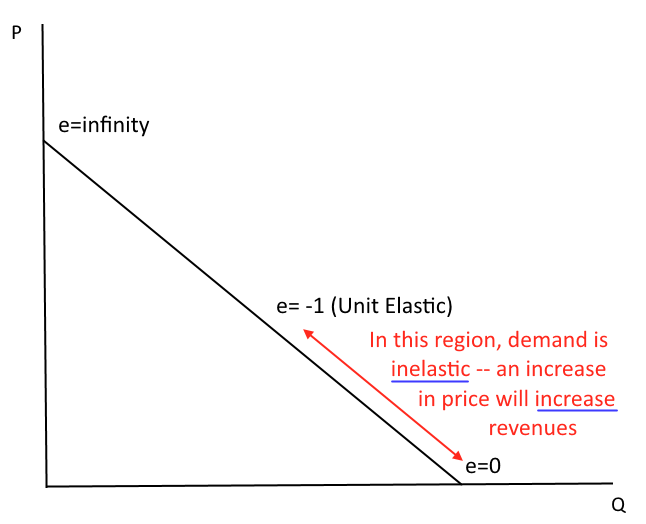
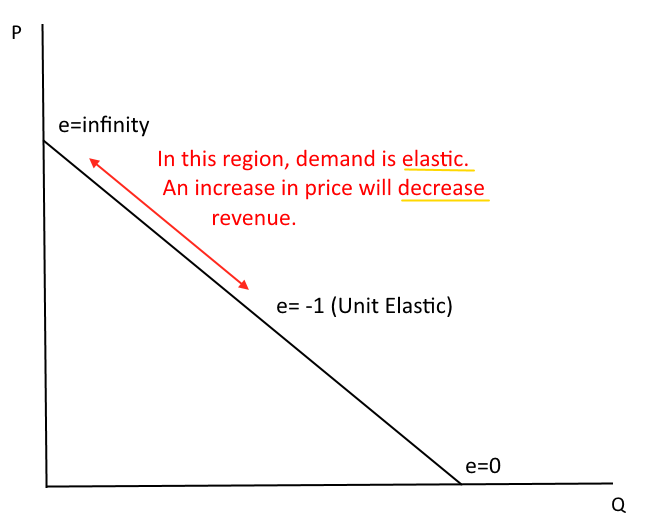
At prevailing prices and quantities, demand is said to be
- Elastic if |ɛ| > 1
- (a 1% change in P causes more than a 1% change in Q)
- Inelastic if |ɛ| < 1
- (a 1% change in P causes less than a 1% change in Q)
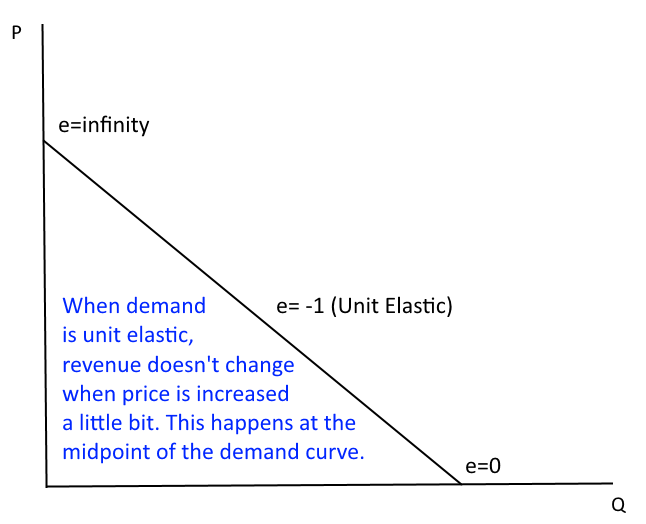
- Unit elastic if |ɛ| = 1
- (a 1% change in P causes exactly a 1% change in Q)
Elasticity
Why care?
Because sensitivity of the demand curve determines whether revenue falls or rises when prices increase.
Elasticity
Elasticity
Elasticity
Elasticity
Suppose iTunes increases its price of an album by 3% and sees a 1% drop in sales.
What is the elasticity of demand for that album?
Is demand elastic, inelastic, or unit elastic at that point?
Elasticity
Two extremes:
Perfectly inelastic: The same quantity is demanded at any price.
Perfectly elastic: Any increase in price will result in demand to go to zero.
What do these demand curves look like?
Elasticity
Elasticity for a product is measured at the current prices and quantities. At going prices and quantities:
- Cigarettes: between -0.3 and -0.5
- Fresh Salmon: -2.5
- U.S. Compact Cars: -3.4
- London Subway: -0.4
- Leisure Travel (air or train): -1.5
- Pet Food: -0.1
Elasticity
Income Elasticity: Percentage Change in Quantity Demanded divided by Percentage Change in Income
What is the sign of the income elasticity for a normal good? For an inferior good?
Elasticity
Cross-price elasticity: Percentage change in quantity demanded divided by percentage change in the price of another good.
What is the sign of the cross price elasticity for substitutes? For complements?
For income and cross-price elasticity, the concept is the same: how sensitive is demand to a change.
Americans Curb Their Thirst For Gasoline
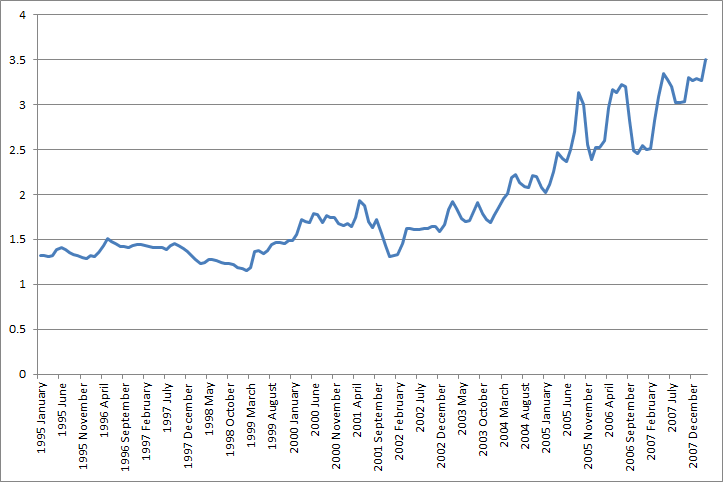
Americans Curb Their Thirst for Gasoline
What has affected gasoline consumption in this article?
- Demand curve shifts left
- "A weaker economy gets some of the credit for lessening demand..."
- Supply curve shifts left due to higher costs
- "As refiners pay more for the oil they use, gasoline prices have gained sharply..."
- Move along demand curve to lower consumption
Americans Start to Curve their Thirst For Gasoline
Would you describe demand for gasoline as elastic or inelastic?
Americans Start to Curve their Thirst For Gasoline
"The longer gasoline prices remain high, the greater the potential consumer response. A 10% rise in gasoline prices reduces consumption by just 0.6% in the short term, but it can cut demand by about 4% if sustained over 15 or so years, according to studies compiled by the Congressional Budget Office."
What is the short run price elasticity of demand? How about long-run?
Demand is always more elastic in the long run!
Demand Estimation
Demand Estimation
As we've seen, understanding demand has important implications for pricing. But what does the demand curve look like? Common techniques:
- Best judgement of managers.
- Consumer surveys.
-
Ask questions about maximum price willing to pay.
- Consumer focus groups or experiments.
- Consumer laboratory or clinic -- simulate market setting
Demand Estimation
Common techniques (cont):
- Informal Estimation Using Historical Market Data or Test Market Data
- "Back of the envelope" estimation. You only need two points to estimate a linear demand curve.
- Statistical Approach: Regression Analysis
- Specify a model for product demand.
- Collect cross section or time series data.
- Use multiple regression to estimate a line or curve through the data.
Demand Estimation
Statistical methods are important if you want an accurate measure of how demand responds to different factors.
2001 Business Communications Review -- Information taken from article in which a senior executive was speaking at a conference and asserted that telecom demand elasticity (U.S. domestic long distance) is –3.
Authors of the article don’t believe it. They say: “...a correct
calculation of elasticity needs to take into account trendline growth;
i.e., growth that would have occurred in any case.” Authors estimate a
“true” price elasticity of –1.
Demand Estimation
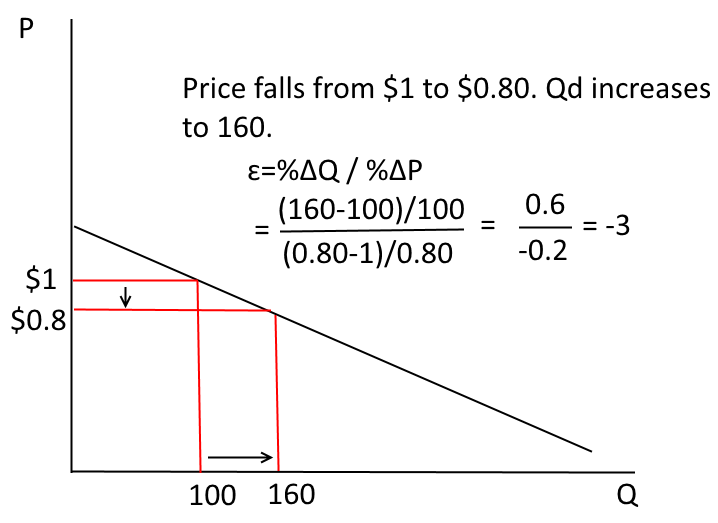
What we see...
Demand Estimation
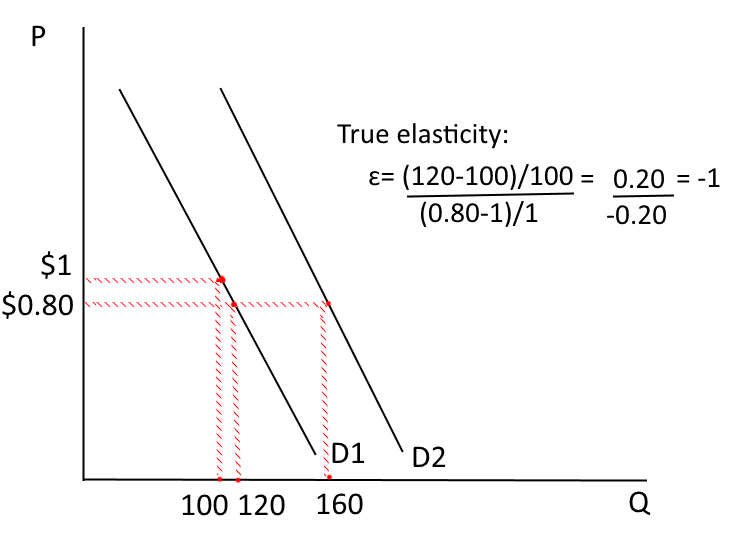
What was actually going on...
Demand Estimation
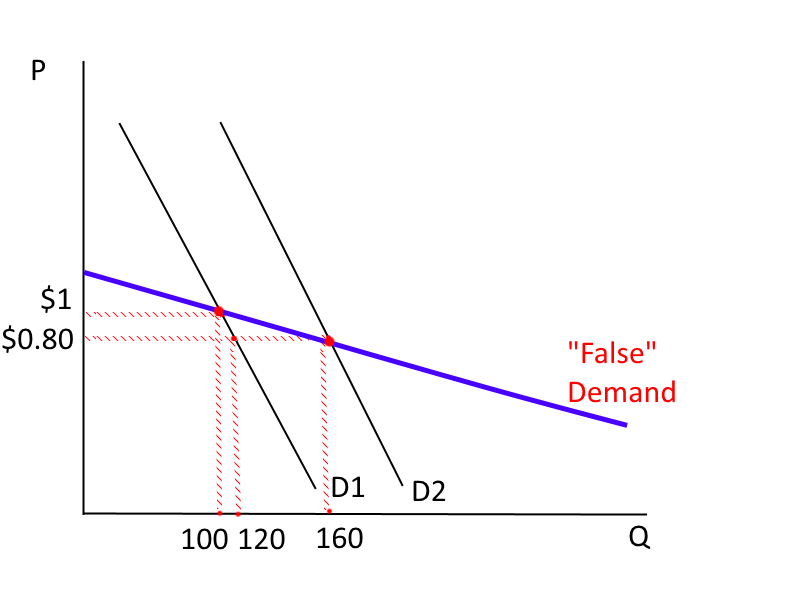
Conclusion: You must control for variables that shift the demand curve so that you can isolate the price-quantity relationship.
Demand Estimation
To account for multiple factors that may be affecting demand simultaneously, we use regression analysis.
Demand Estimation
A simple regression model might look like:
- We can estimate the intercept and slope, learn about the magnitude of the relationship (how large is β1?), and use the estimates to make predictions.
- Caution: Running a regression and finding a positive or negative relationship between X and Y does not prove causation; it only shows correlation. You provide the story to explain the relationship between the variables.
Demand Estimation
We want the best fit possible--and clearly there are many possibilities.
Regression analysis chooses the line that minimizes the sum of squared deviations from the line--that is, it is the line for which the sum of our "mistakes" (squared) is smallest.
Tagamet
Background:
Tagamet is an ulcer treatment drug.
- 1977: Tagamet introduced by SmithKline-Beecham; the first H2 antagonist -- substantially more effective than existing treatments.
- 1983: Zantac introduced by Glaxo, Inc; similar to Tagamet but fewer side effects, almost twice the price.
- By mid-80s: Zantac surpasses Tagamet as leading brand; new entrants are Pepcid (1986) and Axid (1988).
Tagamet

Source: Azoulay, JEMS 2002
Tagamet

Source: Azoulay, JEMS 2002
Tagamet
Estimated Demand Relationship (monthly data, 1983-89):
QTagamet = 354.08 - 321.83*PTagamet + 18.76*PZantac
+ 128.16*PCarafate - 0.09*Income
Mean values of each of these variables over 1983 -1989:
- QTagamet: 68.52 (millions sold per month)
- PTagamet: 0.29 (1982 $)
- PZantac: 0.65 (1982 $)
- PCarafate: 0.26 (1982 $)
- Income: 2641.56 (billions of 1982 $)
Tagamet
Estimated Demand Relationship:
QTagamet = 354.08 - 321.83 * PTagamet + 18.76 * PZantac
+ 128.16 * PCarafate - 0.09 * Income
Are the signs of the estimated parameters as you would expect?
Tagamet
Estimated Demand Relationship:
QTagamet = 354.08 - 321.83 * PTagamet + 18.76 * PZantac
+ 128.16 * PCarafate - 0.09 * Income
What is the own-price elasticity of Tagamet (at prevailing prices and quantities)?
Is demand elastic or inelastic? Does this make sense to you intuitively?
Tagamet
Estimated Demand Relationship:
QTagamet = 354.08 - 321.83 * PTagamet + 18.76 * PZantac
+ 128.16 * PCarafate - 0.09 * Income
What are the cross-price elasticities of demand between Tagamet and Carafate and between Tagamet and Zantac (at the means)?
Which of these drugs seems to be a closer substitute for Tagamet? Does this make sense given the facts of the case?
Tagamet
Does this economic model account for all the important factors affecting the demand for Tagamet? What other variables might you want to include and why?
The Demand Side: Key Points
- Individual demand refers to the relationship between how much of a product a person buys and its price, everything else constant
- Consumers make decisions at the margin: buy units as long as the benefit from the last unit is at least as large as the price of the product
- Consumer surplus is the difference between your willingness to pay for a particular quantity of a good, and how much you actually pay
- Firms do better when they find ways to extract consumer surplus -- for example by lump-sum or upfront fees.
The Demand Side: Key Points
- An elasticity is the percentage change in one variable divided by the percentage change in another.
- Own Price Elasticity = % Change Q Demanded/%Change Price
- Other elasticities: income elasticity, cross-price elasticity
- When demand is elastic, decreasing price leads to higher revenues; when demand is inelastic, price increases lead to higher revenues.
- Factors that affect price sensitivity include the number of substitutes, the time frame (short or long run), etc.
The Demand Side: Key Points
Companies estimate and forecast demand for their products all the time to answer questions such as
- What will happen if I decrease my price by 5%
- What will happen if my competitor decreases price by 1%
- What if I increase my advertising budget by 10%, etc.
Some methods are regression, consumer surveys, and "informal" demand analysis--but be sure you are measuring the right thing!
Lecture 2
By umich


