Applied Microeconomics
Lecture 1
BE 501
Plan for Today
Broad overview of economics
Individual demand
"Basic" supply and demand model
Syllabus and administrative details
Economics
The dismal science
The study of how scarce resources are allocated among competing ends.
Microeconomics:
The study of the decision-making of firms and households and how firms and households interact in the marketplace.
Macroeconomics:
The study of economywide phenomena, including inflation, unemployment, and economic growth.
Economics
More conceptual than other MBA courses.
But, closely related to other subjects:
- Finance: Subfield of economics
- Strategy: Game theory underlies a portion
- Accounting: Principal-Agent models, game theory
- Operations and Technology: Auction theory used in research
- Marketing: Economic models of demand, distribution, behavioral economics
Models in Economics
Economists use models to describe the world around us.A model is a simplified view of reality. It abstracts away from details and makes assumptions.

Consumer Demand
We think of an individual consumer's demand for a product as a function of many things:
Qd=f(Price, ... )
What determines the quantity of a product that consumers want to buy?
Consumer Demand
A consumer's demand curve shows the quantities that an individual is willing to buy at every possible price holding everything else constant (ceteris paribus).
Consumer Demand
A simple example: the market for lattes at UM

"need... caffeine..."
Consumer Demand
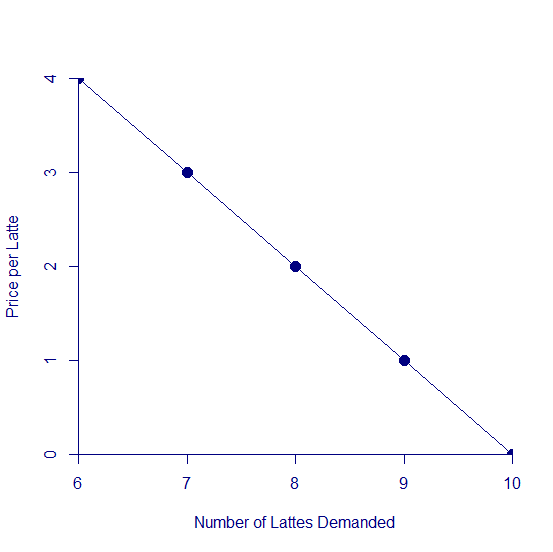
My Demand for Lattes
If the price is.... I would like to buy (in a week)...
- Free lattes!...10 lattes
- $1 per latte... 9 lattes
- $2 per latte... 8 lattes
- $3 per latte... 7 lattes
- $4 per latte... 6 lattes
Consumer Demand
Consumer demand (quantity) is a function of price.
Qd=f(P).
But, we always graph an inverse demand curve where P is on the y axis.
Consumer Demand
My Demand for Lattes
- Free lattes!...10 lattes
- $1 per latte... 9 lattes
- $2 per latte... 8 lattes
- $3 per latte... 7 lattes
- $4 per latte... 6 lattes
If I never drinks Pepsi, no matter what the price, what would her demand for Pepsi look like?
Consumer Demand
- We characterize the inverse demand function as the amount a consumer is "willing and able to pay" for a certain quantity of the good.
Consumer Demand
Law of Demand: the observation that, ceteris paribus, the quantity demanded of a good falls when the price of the good rises.
Why?
Consumer Demand
My Demand for Lattes
- What leads to movement along the demand curve?
- What might shift the demand curve?
Consumer Demand
“New World Pasta files for bankruptcy” (USA Today, 5/10/2004)
New World Pasta, the nation's largest maker of dry pasta products, on Monday announced that it filed for Chapter 11 bankruptcy protection, a casualty of low-carbohydrate diets and balky accounting.... The popularity of low-carbohydrate diets such as the Atkins diet led to a 7% drop in pasta sales so far this year, on top of a 5% decline in the fourth quarter of 2003, and price discounts are commonplace.
How would you use a graph to show how the increased popularity of low carb diets affected demand for New World Pasta?
Other Pastabilities (sorry)
How would the demand curve be affected in these scenarios?
- A competing pasta manufacturer increases their price
- New World Pasta lowers their price
- Americans increasingly start eating out at restaurants
- New World Pasta experiences higher costs of production
Consumer Demand
Normal Good: A good which, ceteris paribus, an increase in income leads to an increase in demand.
Inferior Good: A good which, ceteris paribus, an increase in income leads to a decrease in demand.
What is an example of an inferior good?
Consumer Demand
"A few companies, such as McDonald's, have outperformed the Dow Jones industrial average during the slowdown and also have beaten Wall Street earnings estimates. Boosted by strong worldwide sales, McDonald's third-quarter earnings rose 6% from a year ago to $6.3 billion."
USA Today, 12/5/2008
How do you think demand for McDonalds changes as income changes for an individual consumer?
Consumer Demand
(Sample question:)
Helen's weekly demand for lattes:
Qd = (1/100)*Income - (1/2) Price
Graph Helen's demand for lattes when her income is $1000 per week.
CONSUMER DEMAND
Substitutes: Two goods for which an increase in the price of one leads to an increase in the quantity demanded of the other.
For example, Coke and Pepsi are substitutes.
Consumer Demand
Complements: Two goods for which an increase in the price of one leads to a decrease in the quantity demanded of the other.
For example, hot dogs and hot dog buns.
Consumer Demand
"The Statin Market in a Generic Lipitor World" (Forbes, Dec 2011)
A new survey of physicians shows that [generic] Lipitor will capture an incremental 10 percent to 20 percent of the statin market, which implies volume growth of 50 percent to 70 percent....
Consumer Demand
"The Statin Market in a Generic Lipitor World" (Forbes, Dec 2011)
.. But what about those other brand-name drugmakers? Overall, up to 30 percent of the physicians questioned the need for branded statin therapy once generic Lipitor is broadly available... Specifically, the physicians forecast that 20 percent of Crestor patients will switch to generic atorvastatin, otherwise known as Lipitor, which translates to a drop of 3.4 percent of market share over the next 12 to 24 months.
Consumer Demand
Based on this information, are Crestor and Lipitor substitutes or complements?
How would we represent the change in demand for Lipitor when Lipitor "goes generic"?
How would we represent the change in demand for Crestor when Lipitor goes generic?
Consumer Demand
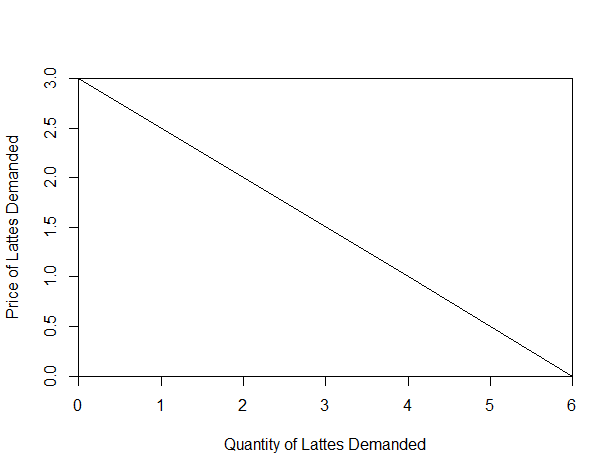
John's Demand for Lattes
If the price is.... John would like to buy (in a week)...
- Free lattes!...6 lattes
- $1 per latte... 4 lattes
- $2 per latte... 2 lattes
- $3 per latte... 0 lattes
Consumer Demand
Here is John's demand curve:
Market Demand
Suppose John and I are the only two people at the University of Michigan who like to drink coffee.
We can use their individual demand curves to find the total demand or the aggregate demand for lattes in this market.
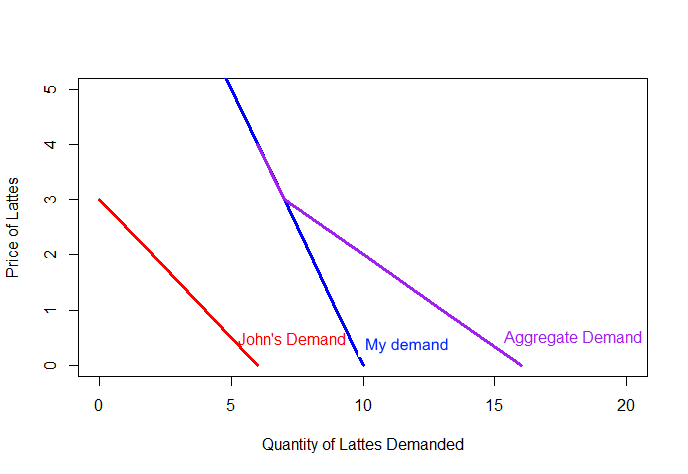
Market Demand
If the prices is.... Then I want ... and John wants... So total demand is...
- Free lattes!...10 lattes...6 lattes...16 lattes.
- $1 per latte... 9 lattes...4 lattes... 13 lattes.
- $2 per latte... 8 lattes... 2 lattes... 10 lattes.
- $3 per latte... 7 lattes... 0 lattes...7 lattes.
- $4 per latte... 6 lattes... 0 lattes... 6 lattes.
Market Demand
Graphically, aggregate demand can be found by adding individual demand curves horizontally.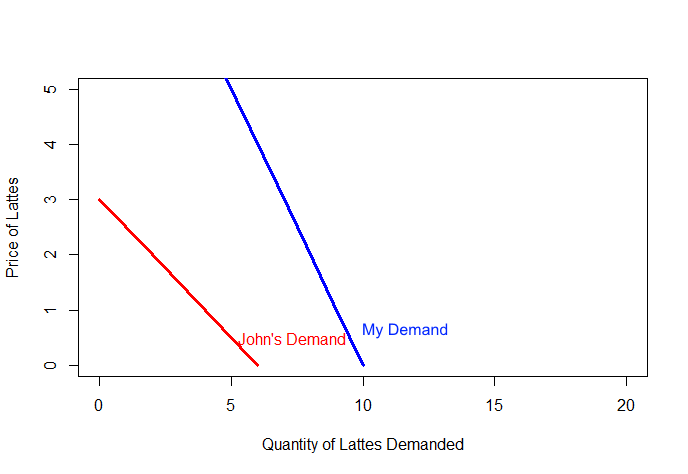
Market Demand
Graphically, aggregate or market demand can be found by adding individual demand curves horizontally.
Market Demand

Why is the aggregate demand curved "kinked"?
If there are many consumers, how would you expect it to look?
For simplicity, we will assume the demand curve is smooth
Market Demand
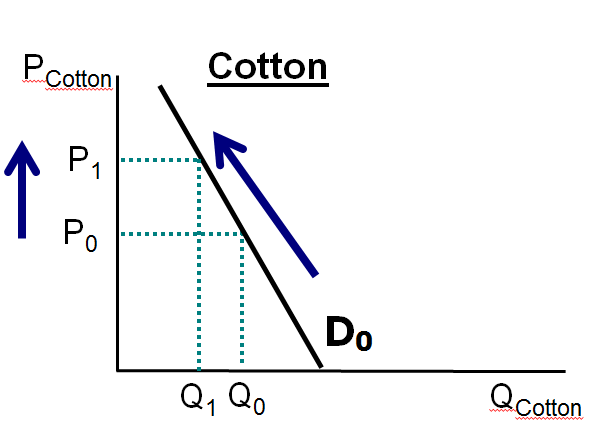
Since aggregate demand is simply the product of individual demand curves, it can shift for similar reasons. From Financial Times, 2011:
US Clothing companies are warning of a jolt in consumer prices in the latter half of this year, affecting everything from socks to evening dresses…Some US clothing brands have started passing on an initial wave of price increases in their spring collections, after last year’s initial escalation in cotton prices….
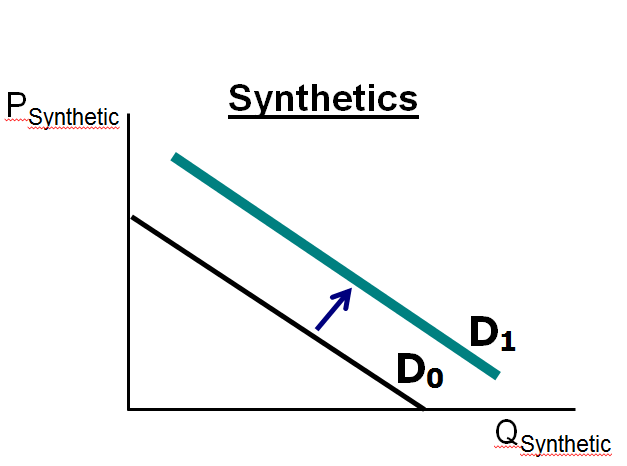
Market Demand
The cost of the commodity has risen 150 percent since the start of 2010. Efforts by manufacturers to reduce costs by switching to cheaper alternative materials have also led to sharp price increases in polyester and other synthetic fibres …”
Market Demand
Remember:
-
When the price of the good changes, you move along the demand curve to a new quantity demanded.
-
When anything else changes, entire demand curve shifts.
Market Demand
Which of the following would cause the market demand curve for Kellogg breakfast cereals to shift to the left?
-
Kellogg lowers price.
-
Kellogg’s costs rise.
-
Kellogg launches an advertising campaign.
-
General Mills, a rival of Kellogg, lowers price.
-
There is a general upturn in the economy.
Supply
A competitive market is a market where no individual buyer or seller can affect the price.
For now, we will assume markets are competitive. That means:
-
Many buyers and sellers
-
Homogeneous product (commodity)
-
Perfect information
-
Firms can enter and exit the market "easily"
Supply

Quantity supplied: the amount of a good that sellers are willing and able to sell
Supply
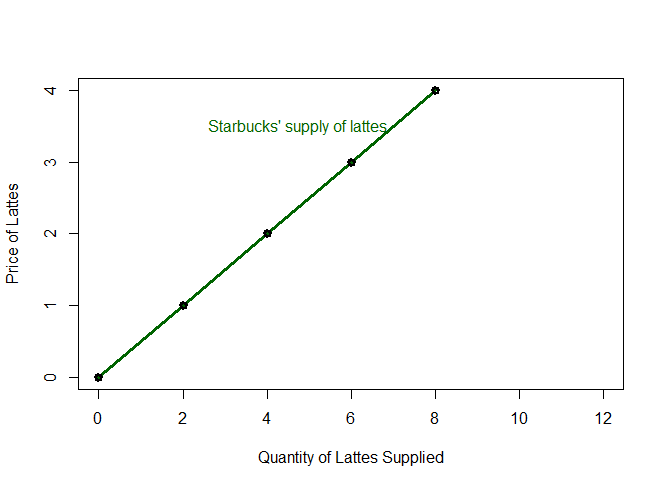
Starbucks Supply of Lattes
If the price is... Starbucks wants to produce...
$0 per latte... 0 lattes
$1 per latte... 2 lattes
$2 per latte... 4 lattes
$3 per latte... 6 lattes
$4 per latte... 8 lattesSupply
Supply
The Law of Supply: the observation that, ceteris paribus, the quantity supplied of a good rises when the price of the good rises.
Supply
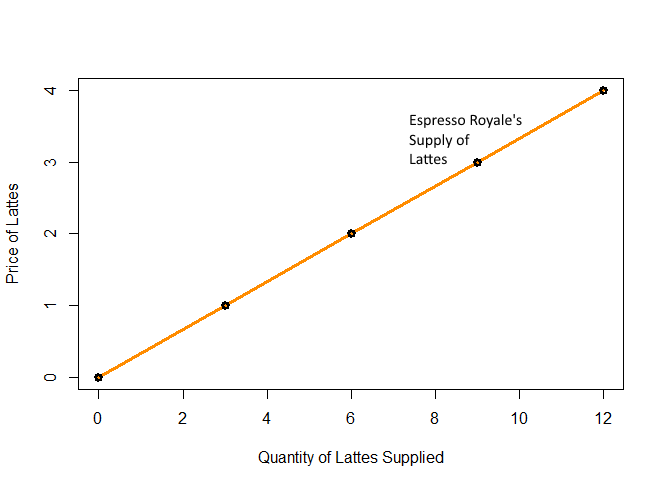
Espresso Royale's Supply of Lattes
If the price is... Espresso Royale's wants to produce...
$0 per latte... 0 lattes
$1 per latte... 3 lattes
$2 per latte... 6 lattes
$3 per latte... 9 lattes
$4 per latte... 12 lattesSupply
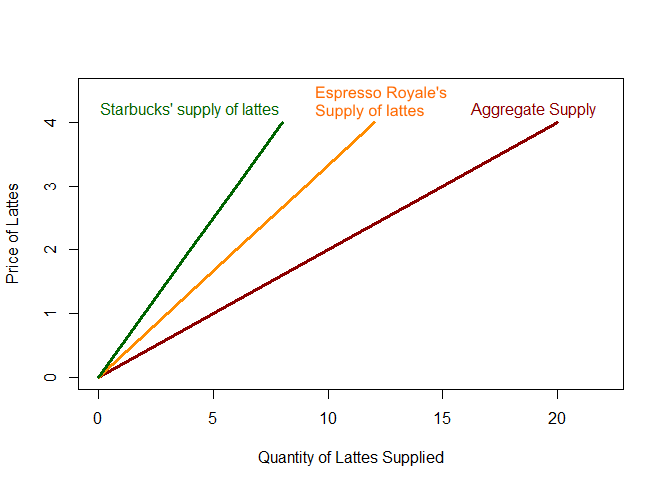
Market Supply
When the prices is... the total supply of lattes is...
$0 per latte... 0 lattes
$1 per latte... 3 (ERoyale's)+2 (Starbucks)=5 lattes
$2... 6+4=10 lattes
$3... 9+6=15 lattes
$4... 12+8=20 lattes
Market Supply
What might shift the supply curve?
Market Supply
As with demand, forces other than price might shift supply.
How would the following affect the global supply curve for coffee beans?
-
Good weather this year in Brazil (a major producer) yields a bumper crop.
-
A 2009 study shows that drinking several cups of coffee per day could significantly reduce risk of Alzheimer’s disease.
-
Higher fair-trade wages are set globally.
- There is a significant improvement in harvesting technology, adopted globally.
- Micro loans allow large numbers of small farming communities to begin coffee production.
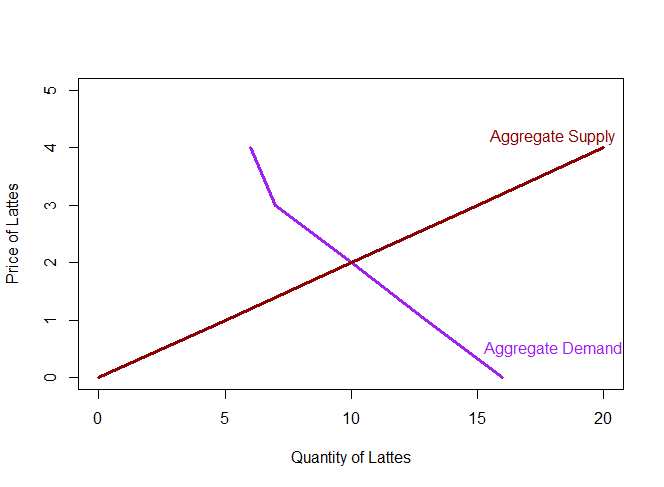
Equilibrium
Equilibrium: A situation in which the market price has reached the level at which quantity supplied equals quantity demanded.
Equilibrium
| Price |
Aggregate Demand
|
Aggregate Supply
|
| $0 | 16 | 0 |
| $1 | 13 |
5 |
| $2 | 10 | 10 |
| $3 | 7 | 15 |
| $4 |
6 |
20 |
Where is the equilibrium?
Equilibrium
Equilibrium
Equilibrium Price: The price that balances quantity supplied and quantity demanded.
We denote this P*.
Equilibrium Quantity: The quantity supplied and the quantity demanded at the equilibrium price.
We denote this Q*.
Equilibrium
What happens when the price is set above the equilibrium price?
What happens when price is set below the equilibrium price?
Equilibrium
Equilibrium
(Sample problem:)Market demand for Uber rides in Ann Arbor at 7:00pm on New Years Eve can be written as
Q_d=300 - 10*P
Similarly, supply of rides can be represented with the equation
Q_s= 20*P.
Graph these functions with P on the y-axis. What is the equilibrium price?
Equilibrium
(Sample problem (cont):)
By midnight, demand for Uber rides has become:
Q_d= 900-10*P.
Supply of rides remains unchanged (aside: is this a good assumption?)
Q_s=20*P.
What has happened to price?
Equilibrium
(Sample problem (cont):)
At midnight, what is the quantity of rides demanded? What is the quantity of rides supplied?
How should we think about the difference in those two quantities?
Equilibrium
Supply and demand analysis:
- Determine whether there is a shift in the supply curve, demand curve, or both.
- Determine the direction these curves shift.
- Find the new equilibrium.
Equilibrium
Demand for theatre tickets at a certain venue is given by
Qd = 250 - 5*P.
The theatre has 100 seats.
- Graph the supply and demand curves with P on the y-axis.
- What is the equilibrium price and quantity?
Copy of Lecture 1
By umich


