Applied Microeconomics
Lecture 1
BE 502
Economics
The dismal science
The study of how scarce resources are allocated among competing ends.
Economics
This is applied economics – learn how to apply thinking like an economist to different situations.
Let's start with an example.
The National Raisin Reserve
US government determines a price for raisins each year
- To meet that price, there is a limit on how many raisins can be sold.
- Remaining raisins are seized by the government – in 2003, they took 47% of every farmer’s raisin crop without payment for the Raisin Reserve.
It is illegal to sell more of your share of raisins!
The National Raisin Reserve
Who does this program help?
Who does this program hurt?
Some farmers switched to growing other crops like almonds. Why would they do that?
The National Raisin Reserve
Meet Marvin Horne:

“The hell with the whole mess,” he says now. “It’s like being a serf.” (Washington Post, 2013)
The National Raisin Reserve
Was it fair for Marvin to sell his raisins?
Good News for Marvin!
Last summer, the US Supreme Court declared National Raisin Reserve unconstitutional! A victory for raisin farmers?

Thinking critically in economics
We can make predictions about what might happen in a market -- like the market for raisins-- by making assumptions about what the players in that market want and how the market will react.
We assume Marvin behaved that way because he wanted to make more money from his raisin crop.
Consumers want raisins at a lower price.
Raisin farmers want a higher price.
Flooding the raisin market will lower the price.
Models in Economics
Economists use
models to describe the world around us.
A model is a simplified view of reality. It abstracts away from details and makes assumptions.
A simple model is often enough to reach the correct conclusion.
Sometimes we need quantitative data and numbers
- How much are farmers hurt by program?
- What is the price of raisins in a free market?
- Measuring fairness or well-being

Consumer Demand
Our first model will be a model of consumer's demand for a product.
But first--let's collect some data!
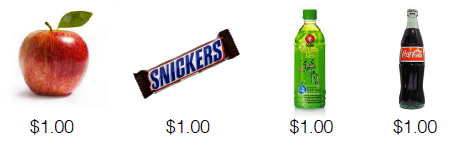
THe Be 502 Store
-
Imagine you have a total income of $5 to spend on these four products.
-
You can buy as much of the products (or none), but you must spend all $5.
-
http://tinyurl.com/Store502/
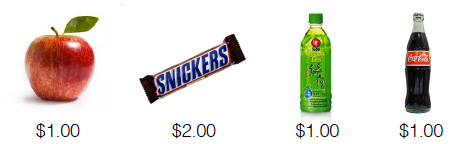
A Peanut Shortage!
-
Week 2: Due to a peanut shortage, the price of Snickers has gone up to $2.
- You still have $5 to spend this week.
-
You can buy as much of the products (or none), but you must spend all $5.
- http://tinyurl.com/Store502/
I'm In the Money!
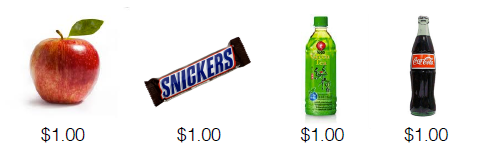
Imagine it's a new week and the price of Snickers has fallen back to $1. But now, you have $8 to spend!
http://tinyurl.com/Store502/
Consumer Demand
We think of an individual consumer's demand for a product as a function of many things:
Qd=f(Price, ... )
What determines the quantity of a product that consumers want to buy?
Consumer Demand
A consumer's demand curve shows the quantities that an individual is willing to buy at every possible price holding everything else constant (ceteris paribus).
If something that affects demand other than price changes, the demand curve will shift.
Demand
There are three "levels" of demand for a product:
- Individual demand: how much of a product an individual would like to buy at any given price.
- Market demand: total quantity of a product that can be sold in the market at any given price.
- Firm-level demand: the demand faced by a single firm.
Consumer Demand
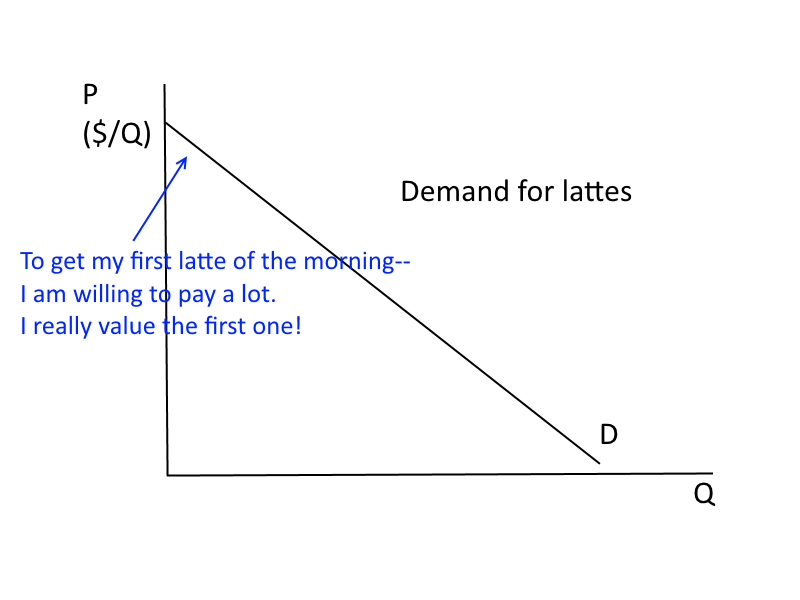
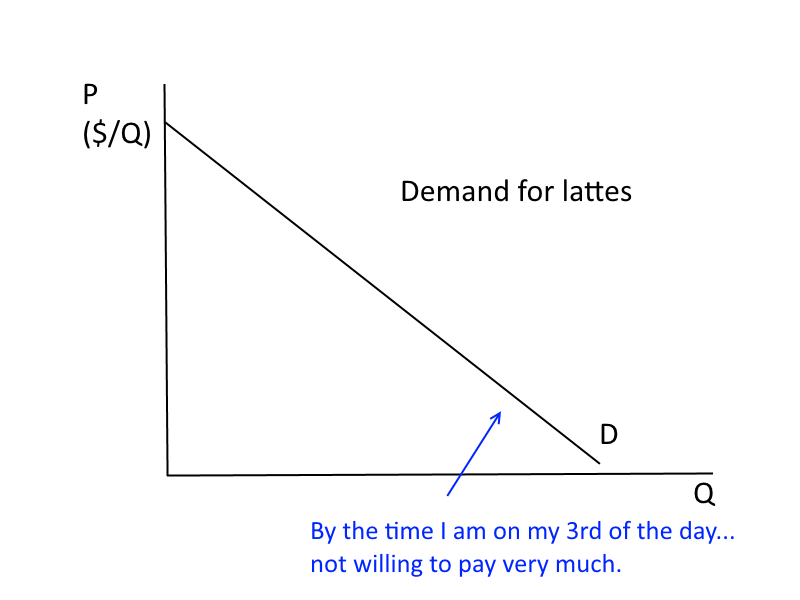
A simple example: the market for lattes at UM

"need... caffeine..."
Consumer Demand
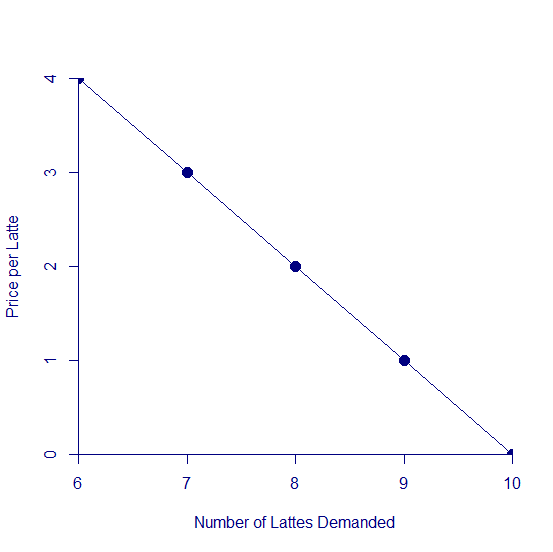
My Demand for Lattes
If the price is.... I would like to buy (in a week)...
- Free lattes!...10 lattes
- $1 per latte... 9 lattes
- $2 per latte... 8 lattes
- $3 per latte... 7 lattes
- $4 per latte... 6 lattes
Consumer Demand
Consumer demand (quantity) is a function of price.
Qd=f(P).
But, we always graph an inverse demand curve where P is on the y axis.

Consumer Demand
My Demand for Lattes
- Free lattes!...10 lattes
- $1 per latte... 9 lattes
- $2 per latte... 8 lattes
- $3 per latte... 7 lattes
- $4 per latte... 6 lattes
Or: P=10 - Q
Does demand have to be linear?
Consumer Demand
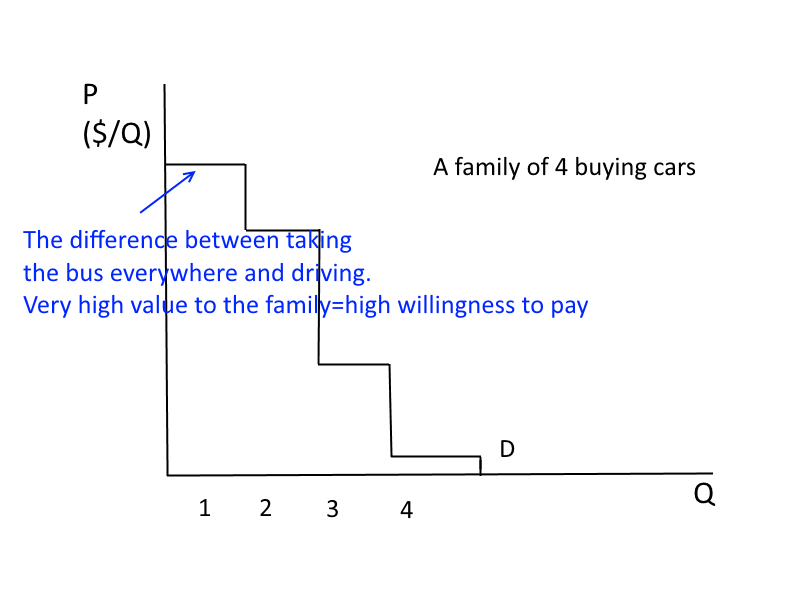
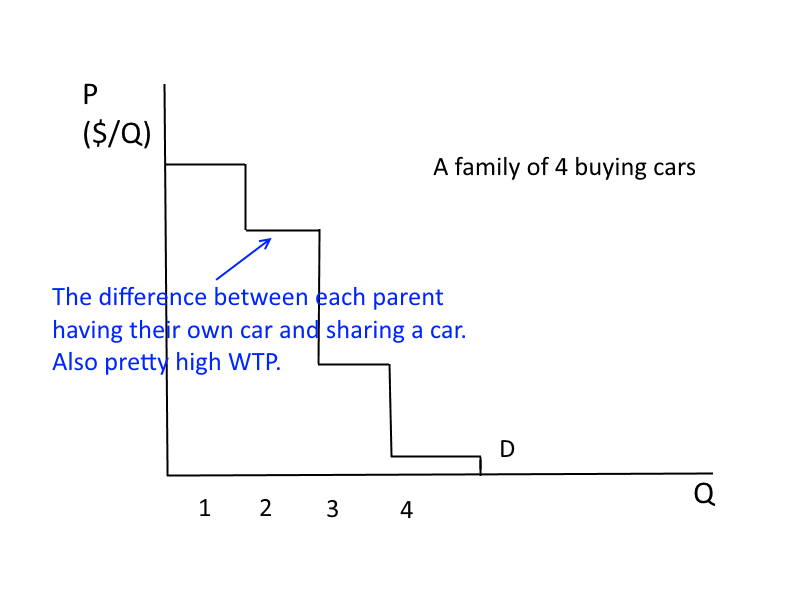
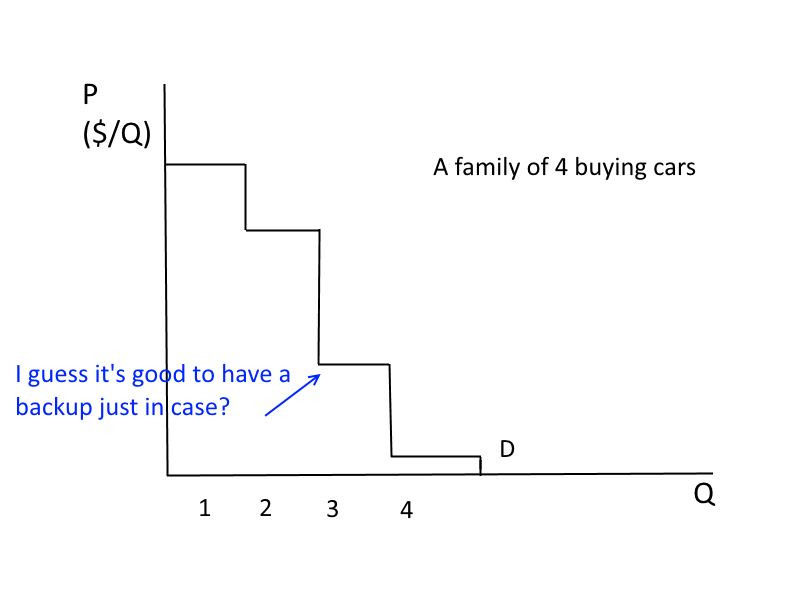
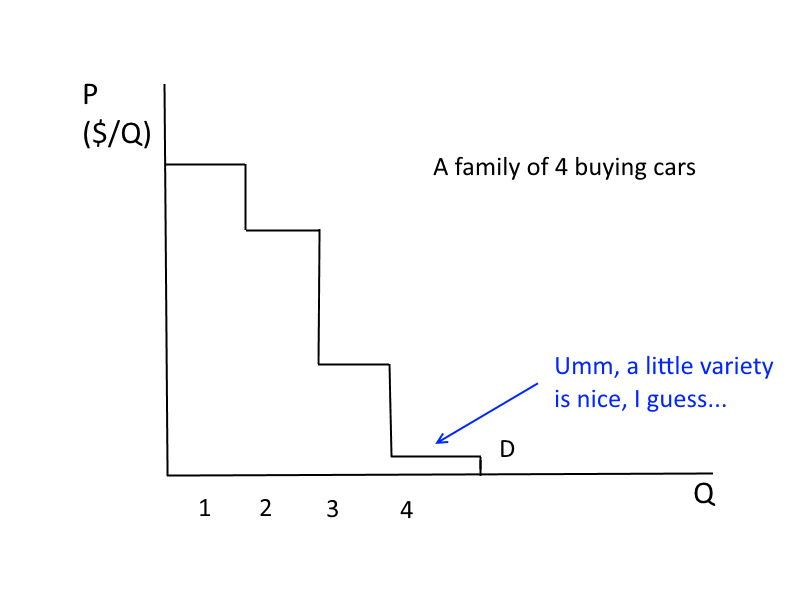
If I always buy 7 lattes per week no matter the price, what does my demand look like?
- We characterize the inverse demand function as the amount a consumer is "willing and able to pay" for a certain quantity of the good.
Consumer Demand
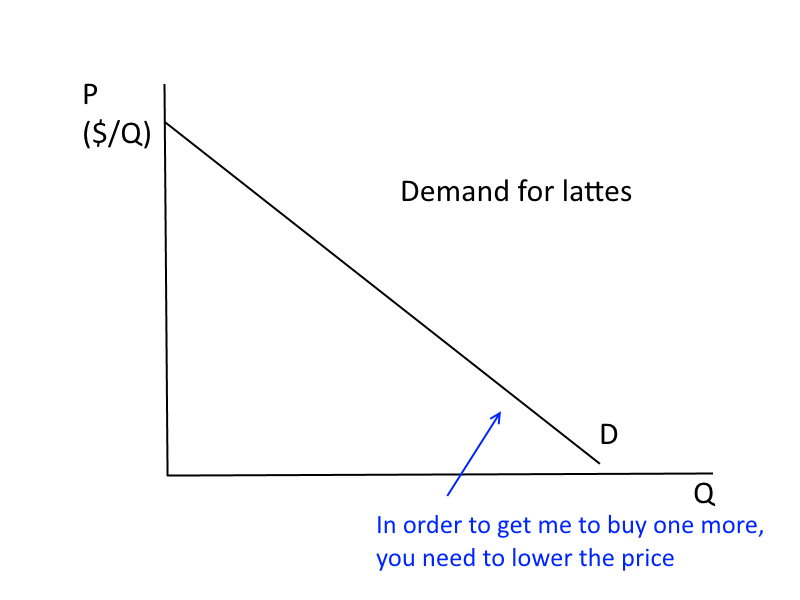
Law of Demand: the observation that, ceteris paribus, the quantity demanded of a good falls when the price of the good rises.
Why? Are there any goods that do not behave this way?
Consumer Demand
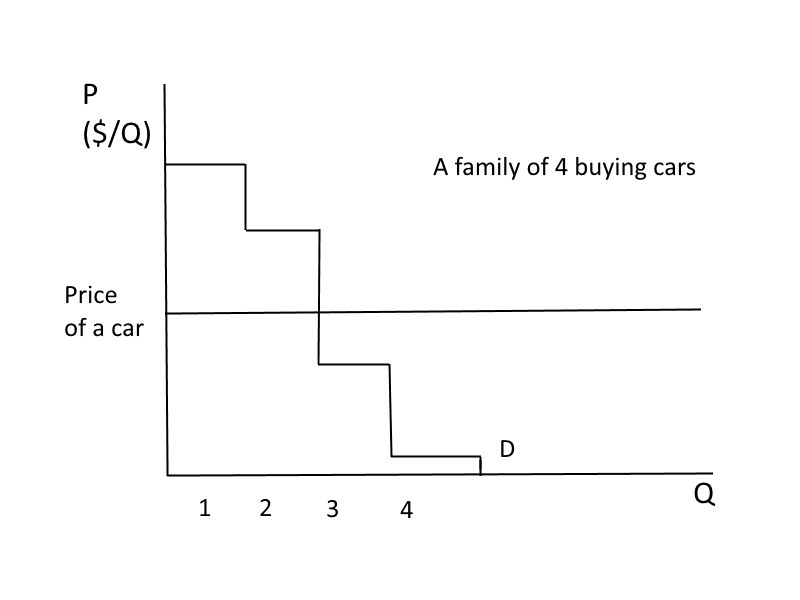
Thinking on the margin is an important recurring theme in this class.
I will buy lattes until the price of the next latte is above my willingness to pay.
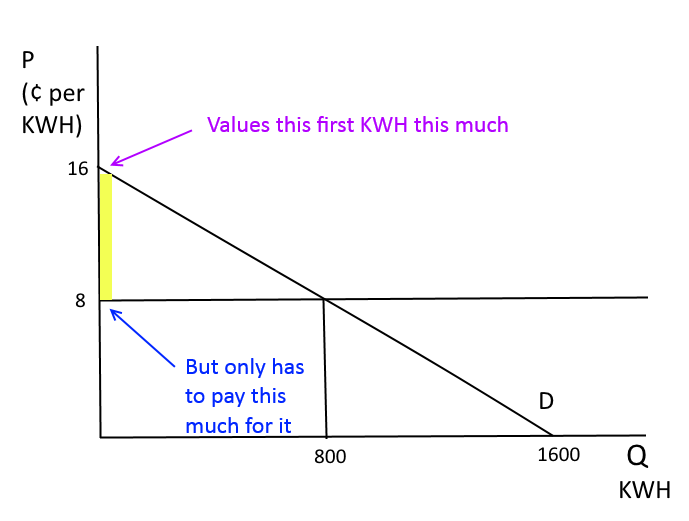
Willingness to pay is one way we measure how much a consumer "values" a good--how much will he be willing to give up to get the good?
Willingness to Pay
Willingness to Pay
Willingness to Pay
Another way to think of it...
Willingness to Pay
Economists refer to this phenomenon as
Willingness to Pay
Willingness to Pay
Willingness to Pay
Willingness to Pay
Willingness to Pay
Electrical Power Purchasing
Electrical Power Purchasing
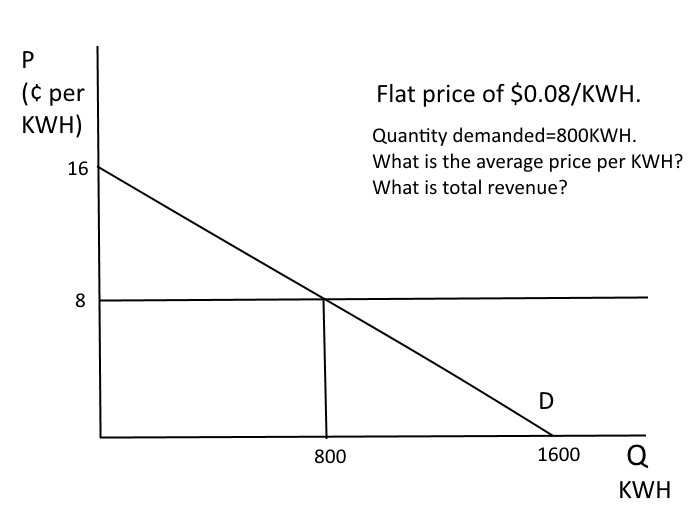
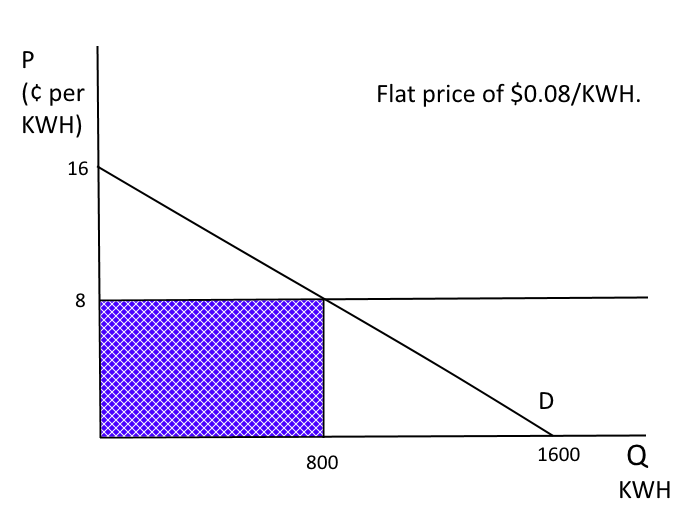
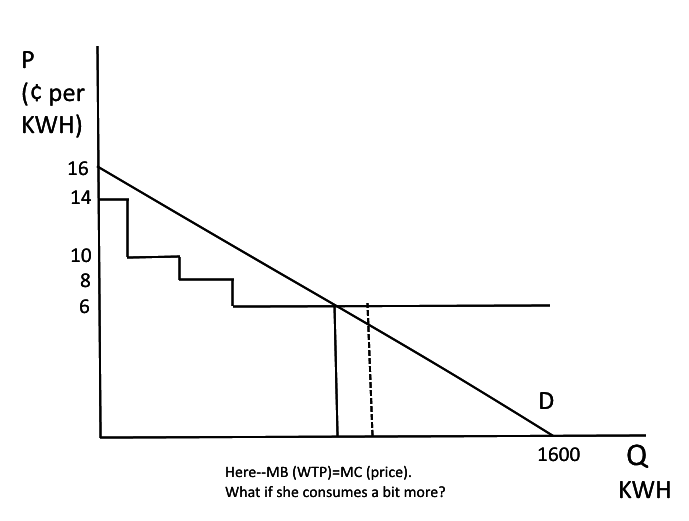
Individual demand curve: Q=1600-100P.
How do we plot this? (y-intercept?)
Remember--we graph price on the y-axis!
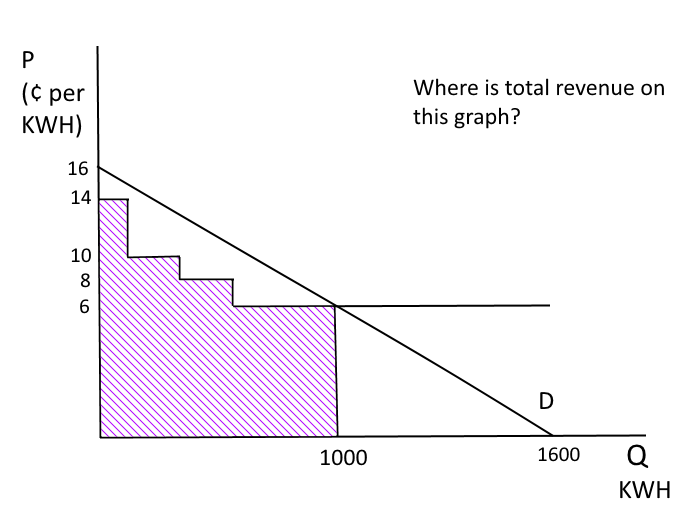
Inverse Demand: P = 16 – 0.01Q
Electrical Power Purchasing
Philadelphia
Electrical Power Purchasing
Philadelphia
Electrical Power Purchasing
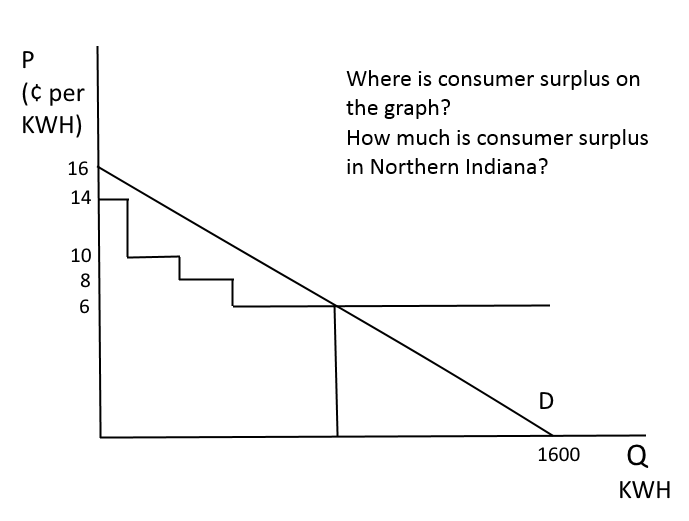
Northern Indiana
Electrical Power Purchasing
Electrical Power Purchasing
Electrical Power Purchasing
If the average prices are the same, why is she buying more in Indiana?
Where is she better off?
Electrical Power Purchasing
Electrical Power Purchasing
Electrical Power Purchasing
So, where is she better off?
Electrical Power Purchasing
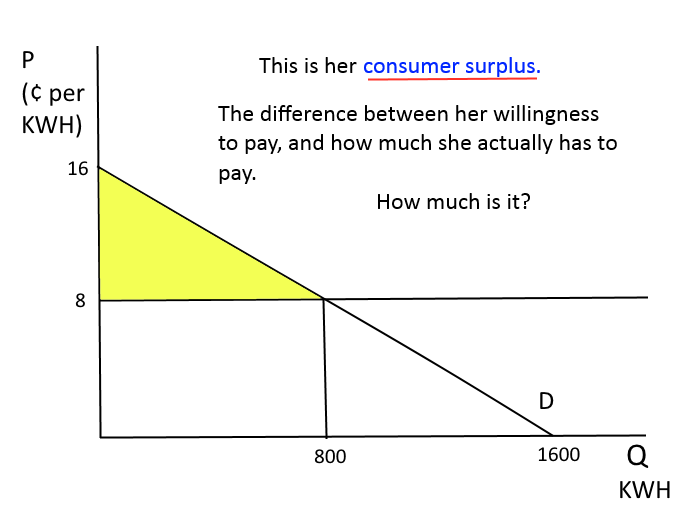
Consumer surplus is how economists measure the value that consumers get out of participating in a market.
Advantages:
-
Quantifies consumer value (what are the units?).
-
Allows us to conduct "normative" analysis (i.e., consumer is "better off" in one situation or another)
Disadvantages:
-
Based on being "willing and able to pay".
- You might really value things you cannot pay for (food, clothes, health)
Electrical Power Purchasing
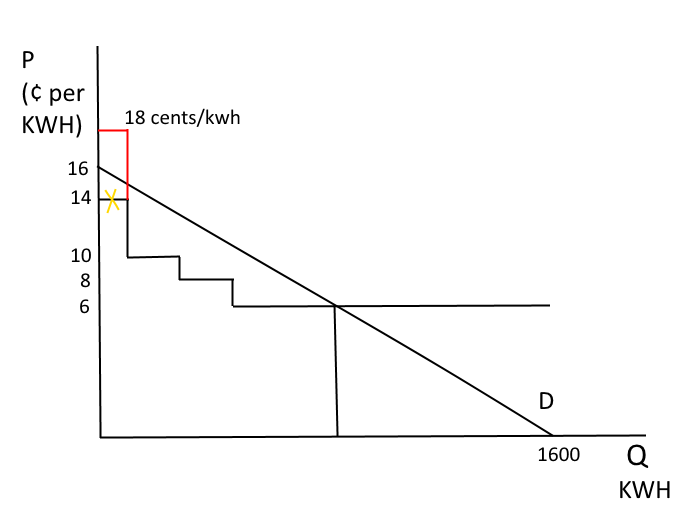
Decision Making on the Margin Rule:
For the consumer, continue to purchase up to point where Marginal Benefit (measured by WTP)=MC
If MB>MC, ↑Q; if MB<MC, ↓Q
This makes the consumer as well off as possible; this decision rule maximizes her consumer surplus
Electrical Power Purchasing
Electrical Power Purchasing
"Thinking on the margin" logic works (most of the time)
Electrical Power Purchasing
Where else do we see this type of pricing?
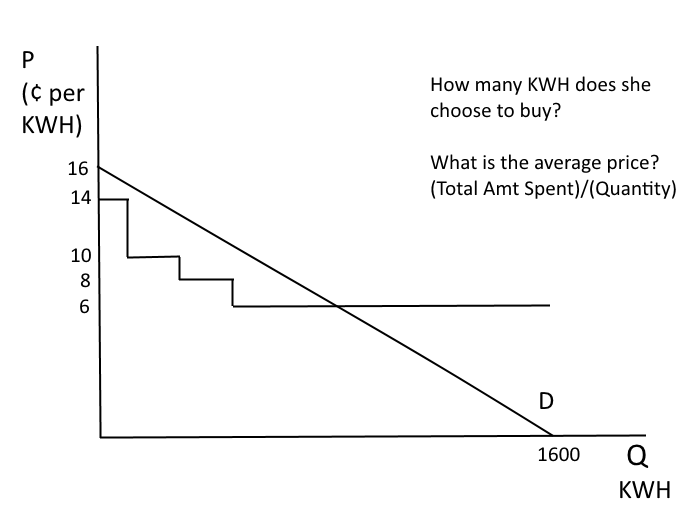
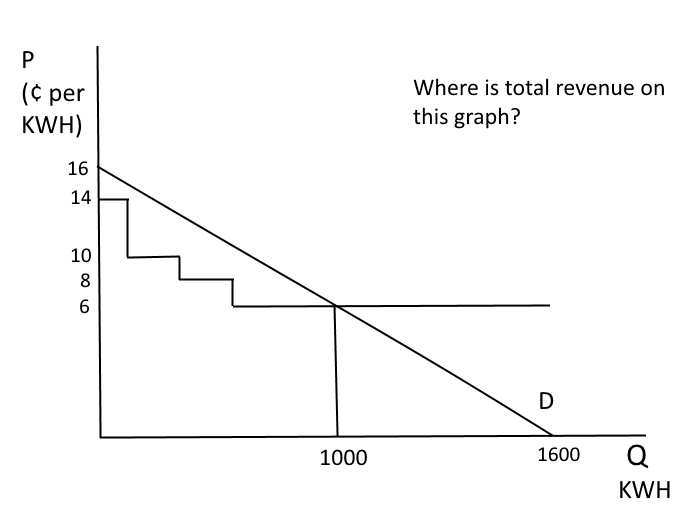
Electrical Power Purchasing
Electrical Power Purchasing
In Ann Arbor, Detroit Edison has a somewhat strange rate schedule:
First 500 KWH $.07/KWH
Next 300 KWH $.10/KWH
Remaining KWH $.13/KWH
Tiered Pricing
"Water Pricing in Two Thirsty Cities" Since 2001, Santa Fe’s total water consumption has dropped by a fifth, even as the high desert city’s population has increased more than 10 percent. Why?
- Santa Fe, in addition to raising the basic cost of water, decided to make the heaviest users of water pay more — much more …. known as tiered pricing…with water guzzlers paying three to four times more per gallon than more efficient consumers are charged.
- When water costs more as its consumption increases, people respond exactly as an economics textbook would dictate: They use less…per-capita water usage has plunged, falling from nearly 140 gallons a day in 2001 to about 100 now.
- By contrast, in Fresno, which has a single, uniform price for water, per-capita usage was 222 gallons per day last year
-
Tiered pricing offers a balance between fairness and efficiency… Tiered pricing impinges on users who have the most slack…
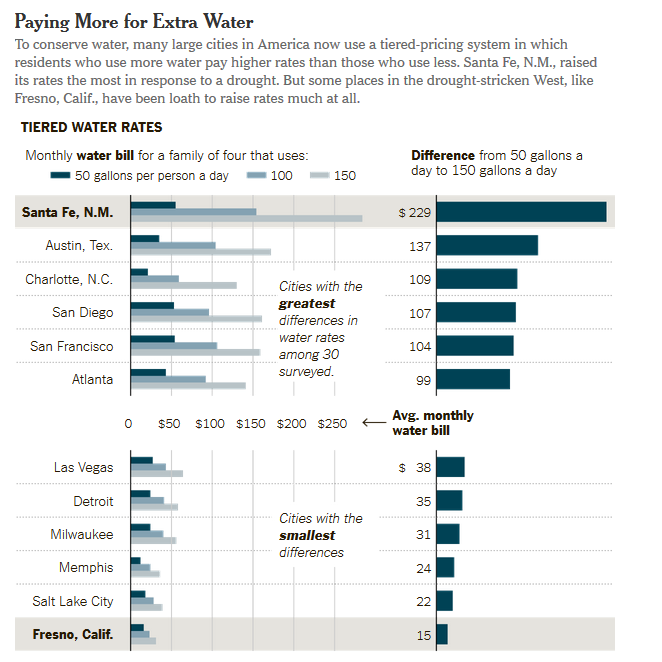
source: New York Times, May 6 2015
Individual Demand: Two Interpretations
For each price, an individual’s demand curve shows the amount of the good the consumer is willing to purchase (all else equal)
- A positive role: explains how consumers behave
For each quantity, demand represents the consumer’s willingness to pay
- A normative role: demonstrates why and how much consumers benefit from their purchase
Summary
Rational Consumer’s Decision Rule
A consumer “should” buy additional units up to point where marginal value/benefit just equals marginal cost
If WTP > MC, consume/purchase more
If WTP < MC, consume/purchase less
Optimal consumption/purchase Q:
WTP (the marginal benefit of consumption) = MC
Following this rule “maximizes” CS
Summary
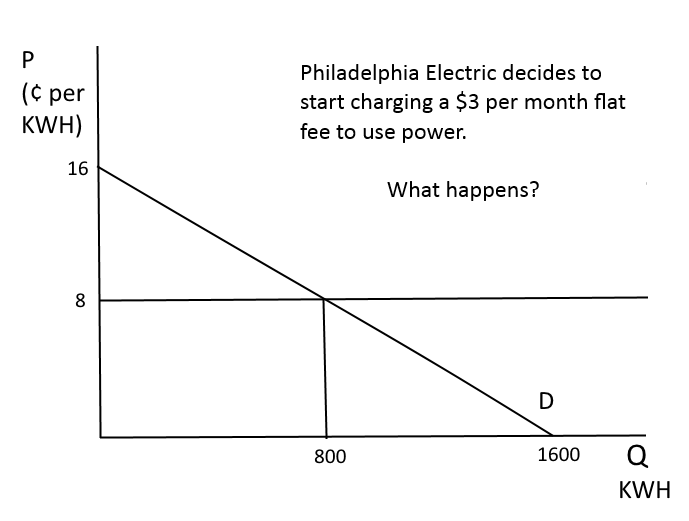
“Inframarginal” charges (e.g, fixed fees):
- Do NOT affect the marginal cost of consumption
- May affect a consumer’s decision of whether to purchase a product at all (if CS became negative)
- May affect a consumer’s willingness to pay (and, hence, her demand) for all goods and services she buys by reducing the consumer’s total disposable income (but often these effects are negligible if the fee is small relative to total income)
Does anyone behave this way?
Does anyone behave this way?
Individual consumers:
Maybe not explicitly or consciously, but … pricing incentives DO make a difference
Does anyone behave this way?
Business customers:
Much more likely to make these calculations
explicitly, especially where large amounts of money are at stake (e.g.,
industrial customers (i) who use a lot of electricity and (ii) for whom
self-generation of power is an “economical” alternative).
But, some research suggests consumers are confused
Do Consumers Respond to Marginal or Average Price? Evidence from
Nonlinear Electricity Pricing, American Economic Review, Koichiro Ito
- “…strong evidence that consumers respond to average price rather than marginal or expected marginal price”
- “This sub-optimizing behavior makes nonlinear pricing unsuccessful in achieving its policy goal of energy conservation and critically changes the welfare implications of nonlinear pricing.”
Are average and marginal price different for most products?
The Energy Paradox
American consumers spend a lot on electricity: ~245 billion USD per year. Yet they are very slow to adopt energy-saving products.
In 2011, only 3% of consumers bought energy efficient (15% return) water heaters
In 2010, only 28% of American HHs who could use CFLs actually used them
If they had adopted, Americans would have saved 15 billion USD (per year)!
Is this lack of info / salience, or do Americans just not like energy-saving bulbs?
What do firms want?
If you were an energy firm, would you want consumers to be highly informed of the marginal cost of your product?
- When would this increase your revenue?
- When would it decrease your revenue?
Course Formalities
email: mille@umich.edu
office: Ross 4416
phone (office): (734) 647-6978
Course web site on Canvas
Course Resources
- Lectures
- Canvas web site: depository for class notes, problem set solutions, practice exams, supplemental readings. Will be used for making announcements so I recommend you adjust your settings to get announcements delivered to your email.
-
Course materials: posted on Study.net
Course Resources
Required (pre-class): cases
Strongly recommended (post-class): practice problems (to check understanding of lectures)
Recommended (pre-class): News articles illustrating class concepts
Textbooks:
(Optional) Textbook: Pindyck and Rubinfeld, Microeconomics, 8th edition, 2012
(Recommended) Study guide for Pindyck and Rubinfeld, by Valerie Suslow and Jonathon Hamilton
Where is the Work?
Very minimal readings – where is the work?
- Active learning:
go over lecture notes in detail, and
do and review all the cases and problems !
- Advice: schedule 5 to 6 hours every week to
go over BE 502 class notes/cases
- do in class problems and problem sets
read case/readings for next class
- Least amount of pre-reading => expect each of you to be well-prepared about case details (Ross Commitment to Learning)
Strategy for Success
Practice, Practice, Practice - You have many problems to work with in this course (Case questions, practice problems in course materials, practice quizzes and exams, Study guide problems), all with solutions – this is critical to really understanding the concepts!!
- If you have difficulty, get help right away (see me, contact the tutor, ask classmates)
- The course is cumulative and moves rapidly. Do not fall behind!
Get Help if you need!
Regular office hours: Tuesday and Thursday, 4:45p - 6:00p
Tutors:
Section 2: Katie Redman (katiered@umich.edu)
Section 5: Abbey McDonald (abbeymc@umich.edu)
Evaluation
Two take-home, open-book quizzes (15% total):
Quiz 1 (5%): due Monday, Sept 19, 9:00AM
Quiz 2 (10%): due Monday, Oct 3, 9:00AM
3 group assignments (25% total):
Assignment 1 (5%): due Monday, Sept 12, 9:00AM
Assignment 2 (10%): due Monday, Sept 26, 9:00AM
Assignment 3 (10%): due Monday, Oct 10, 9:00AM
Quizzes and group assignments are turned in on Canvas.
Evaluation
Participation (10%):
- Attendance + punctuality will be 5%; Quality of participation important for rest 5%
- Please report all absences using iMpact Class Absence Reporting tool
Final Exam (50%): Thursday, October 20, 4:45pm-7:15pm
Evaluation
Conditions that make performance improve rapidly often poor for long-term retention, whereas conditions that appear to create difficulties, slowing the rate of apparent learning, often optimize long-term retention.
E.g. Tests as learning events (Roediger and Karpicke 2006):
Three conditions:
- SSSS: four consecutive 5-min study periods
- SSST: three study period plus a test of recall for the passage
- STTT: one study period plus three consecutive tests of recall for the passage
STTT resulted in higher proportion of long-term retention
The weekly tests/assignments intended to improve long-term recall
Grading
Final grades in core courses at the RSB are on a forced curve:
- First 25% get Excellent
- Next 35% get Good
- Next 35% get Pass
- Next 5% get Low Pass
Fail grade if exams reflect a lack of understanding of key basic concepts
Classroom Protocol
Please sit per seating chart
Namecards – please use them throughout!
Handouts – distributed in class and via Canvas
Missed classes – please:
- report in online system and inform me via email
- get notes from Canvas or from classmates
Avoid:
- late arrivals / comings and goings / ringing cell phones / open laptops
Course Material
Generally same materials across all sections
The course is about how microeconomics helps us understand and predict:
Private decision making by
- consumers & firms
- employees, competitors, suppliers, etc
Public policy (government) decisions and their effect on your firms
A way of thinking about the (business) world!
Course Outline
FOUNDATIONS (1st half of course)
- Module 1: Individual and then market demand
- Module 2: Costs - & how they underlie supply
- Module 3: Profit maximization with Market Power
- Module 4: Perfectly competitive markets
- Module 5: Supply and demand analysis
Course Outline
ADVANCED TOPICS (2nd half of course)
- Module 6: Decisions with risk and asymmetric information
-
Module 7: Advanced pricing strategies
- Module 8: Oligopoly, game theory, and how firms interact in markets
Course Outline
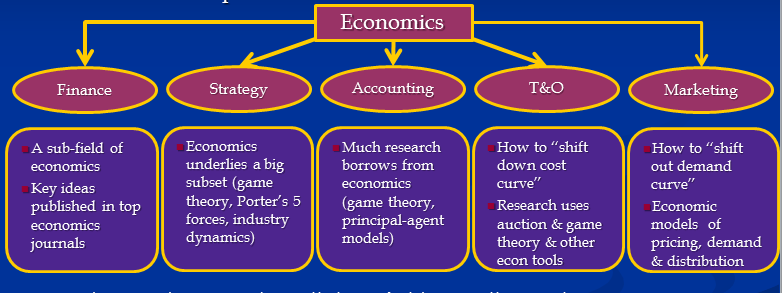
Economics: more "conceptual" than other courses, but strongly connected
Thinking Like an Economist
Some key elements:
- Comparing costs and benefits
- Using marginal analysis i.e. look at the cost/benefits from each additional unit
- Recognizing opportunity and sunk costs
Immediately coming up!
- A practice quiz (PracticeMC_Quiz1.pdf) is posted on Canvas along with answers. These questions will help you evaluate your understanding and are relevant for the first group assignment.
-
Your team for the group assignments is posted on Canvas.
-
Tutor(s) will be available from Wednesday afternoon on--email them for appointments.
- Read case Tagamet on demand estimation, try to answer questions, be ready for discussion.
Lecture 1
By umich


