Automated Frontend Performance Testing Without Asterisks*
John Hill
About Me

Web UI Test Engineer,
Space Mission Control Software, KBR
NASA Ames Research Center


VIPER
In this talk
- Frontend Performance is Mission Critical for your team
- Establish/Reinforce Core Concepts
- Automate a Google Search Performance Test
- Tools and Techniques to Avoid Asterisks in Results
- State of the Union and What's Next!


In this talk
- How to fix performance problems.
- Paid
solutions
- How to fix performance problems.
- Paid problems
Why is frontend performance important?
- Amazon found that every 100 milliseconds in load time correlated to 1% decrease in sales.
- Google found that when they increased the search results from 10 to 30, the load time increased by half a second and resulted in a 20% decrease in ad revenues.
- Frontend is almost always the bearer of bad news.
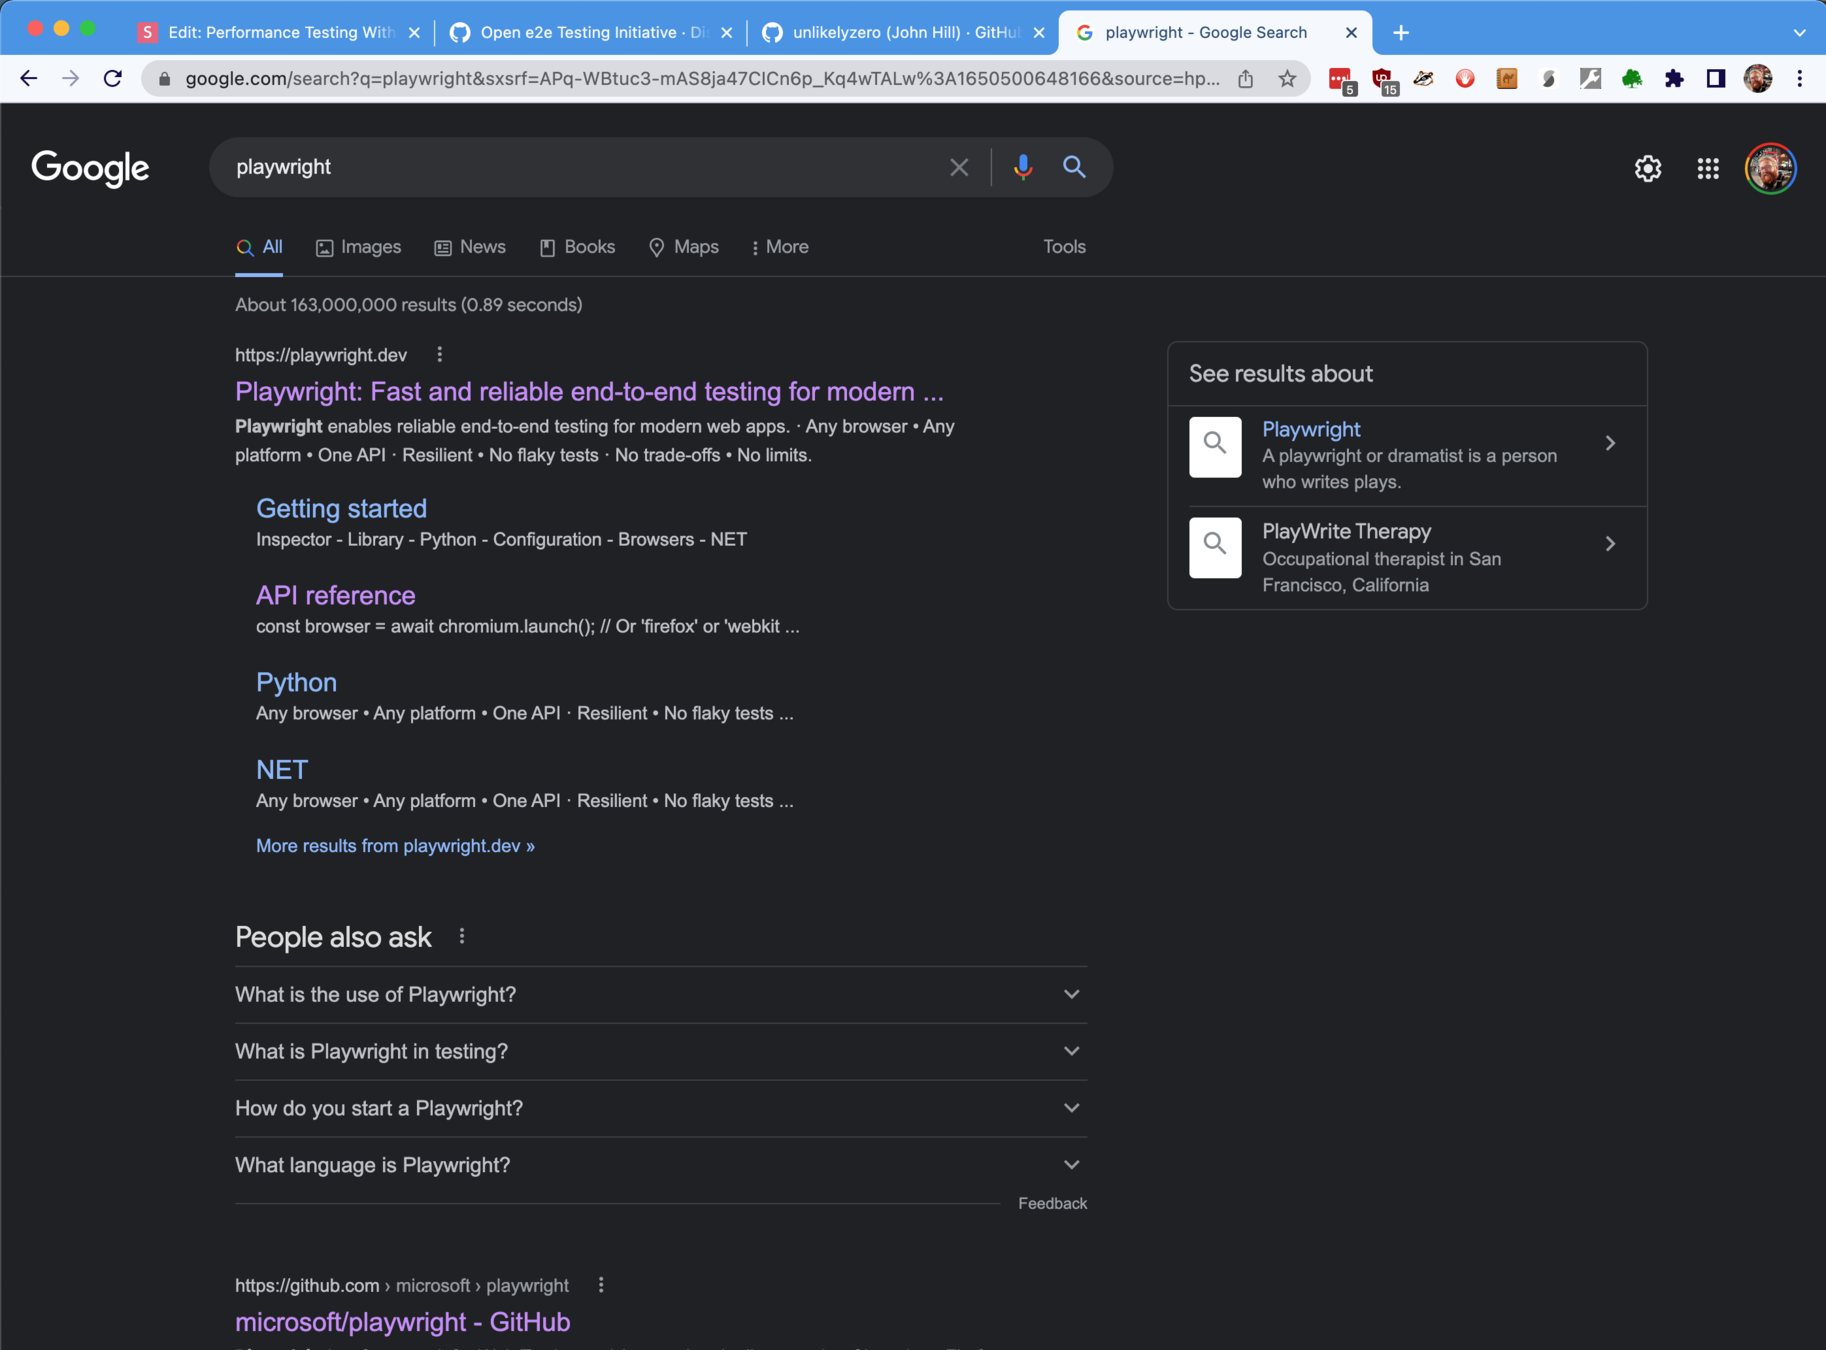
Google Search Devtools Demo
| First Load | Loaded Page | Session |
|---|---|---|
| Easy | Hard | Expert Mode |
Frontend Performance Continuum
All the Frontend Performance Data is there. The problem is how to get to it and what to do with it.
If Bad Network, then DevTools and Lighthouse Score.mov
Lighthouse
- "First load for Frontend teams"
- Scoring and Tips
- Lighthouse-CI
- Only first load :(


| First Load | Loaded Page | Session |
|---|

DevTools - Performance Tab
User Experience on Single Page
- Twitter "Time to First Tweet"
- User Timing API
- Performance.marks() API
performance.mark('first-google-ad');
### Some number of clicks or steps ###
performance.mark('click-on-first-ad');
performance.measure('first-ad-click-duration','first-google-ad','click-on-first-ad');

###returned object
PerformanceMeasure {
  name: 'first-ad-click-duration',
  entryType: 'measure',
  startTime: 4727964.299999952,
  duration: 12436.700000047684
}
- Only applies to a single page!
- *No DevTools Tooling like Lighthouse :(
| First Load | Loaded Page | Session |
|---|
Session Performance
- "Last Mile" of Browser Performance
- CPU
- "Jank" or "Freezing"
- What we're looking for: Long Tasks API
- Where the main thread is locked >50ms
- "Where is the CPU spending time... that it shouldn't"
- Memory
- Leaks.
- Memory Pressure from JSHeap
| First Load | Loaded Page | Session |
|---|
Why is *automated* frontend performance *testing* important?
- Google found that when they increased the search results from 10 to 30, the load time increased by half a second and resulted in a 20% decrease in ad revenues.
- Intentional Product Change
- One Change. Everyone's problem.
Happy Accidents

How do we test for the intended and unintended frontend performance problems?
Synthetic User Monitoring
- Recent Practice of Automated Performance Testing
- "SRE Team running Selenium tests"
- Why? The frontend is bearer of bad news!
- Critical User Journeys covered
- Comes with a lot of asterisks
| First Load | Loaded Page | Session |
|---|
Synthetic User Monitoring Challenges
Synthetic tests aren’t very resilient, and they can easily fail when small UI changes are introduced, generating unnecessary alert noise. This means that whenever a minor application element such as a button is changed, the corresponding test must be, too."
dynatrace.com/news/blog/what-is-synthetic-monitoring/
* Asterisk
- Solution: Share tests between Ops, Dev and QA!
- Java, CSharp, Python, Python Asyncio, JS, Typescript
- Tighter coupling to browser internals than Selenium
- aka "Inside-out Performance Measurements"
- What I'm about to show you is how to remove all asterisks for your tests and results

| First Load | Loaded Page | Session |
|---|
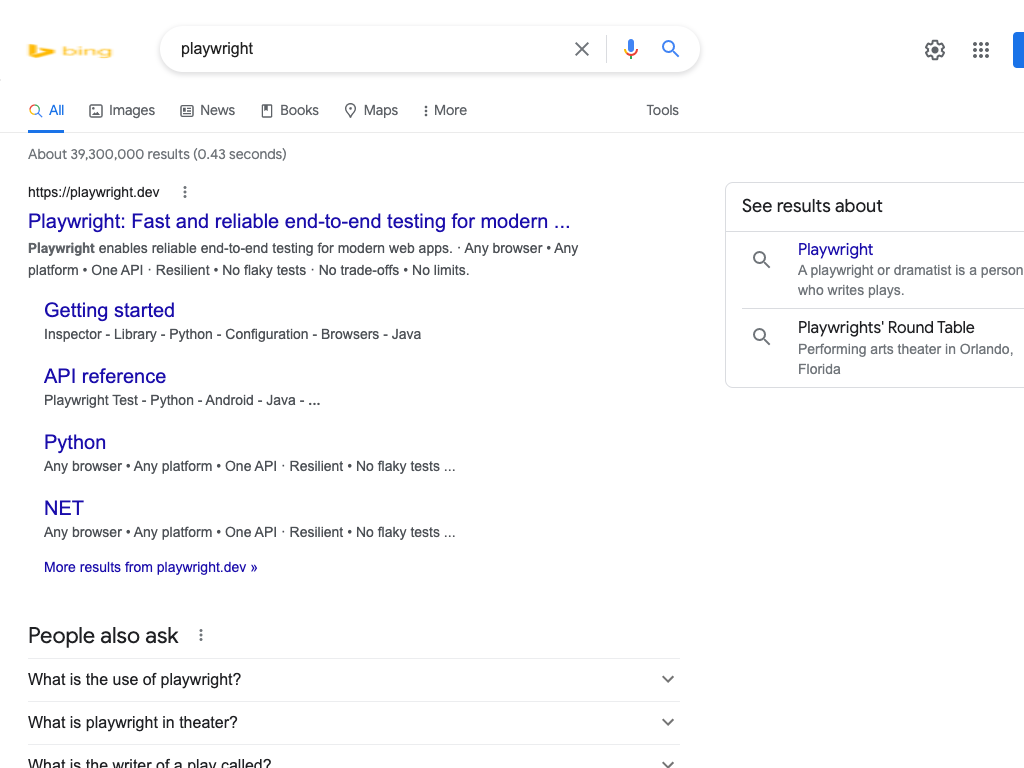
Playwright Demo
npx install playwright
npx playwright codegenPlaywright Capabilities Demo
- Already showed how easy it is to get started
- Already showed how easy it is to use web-first locators
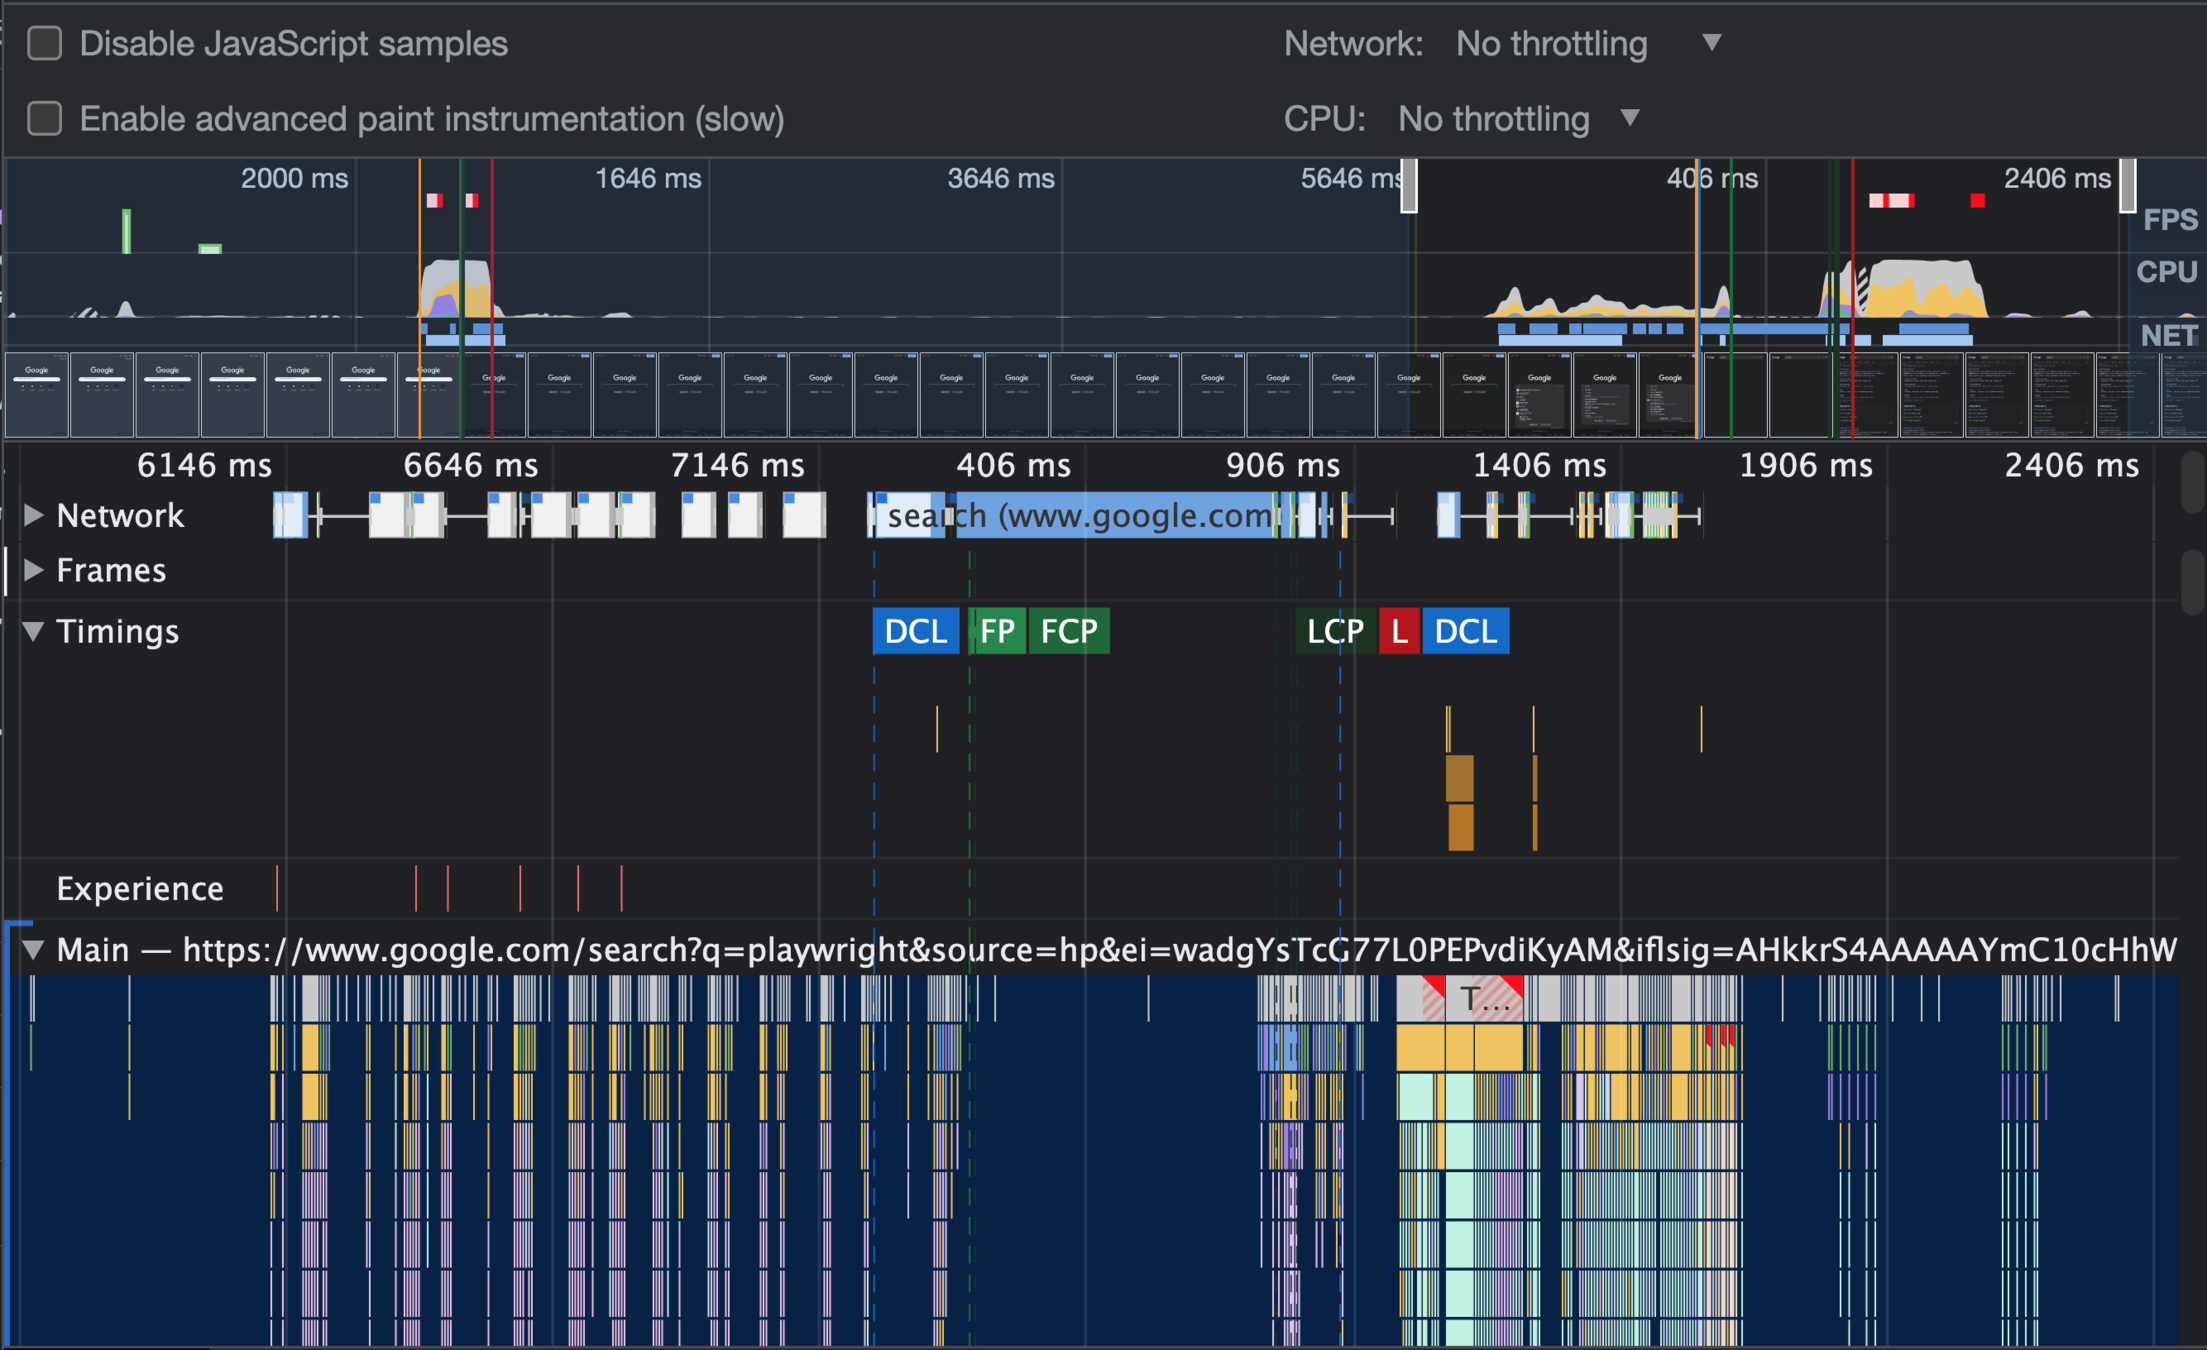
- Capabilities Demo 1: CDP and Performance API
- Capabilities Demo 2: Generated Performance.mark() and DevTool Performance Timeline. Headless.
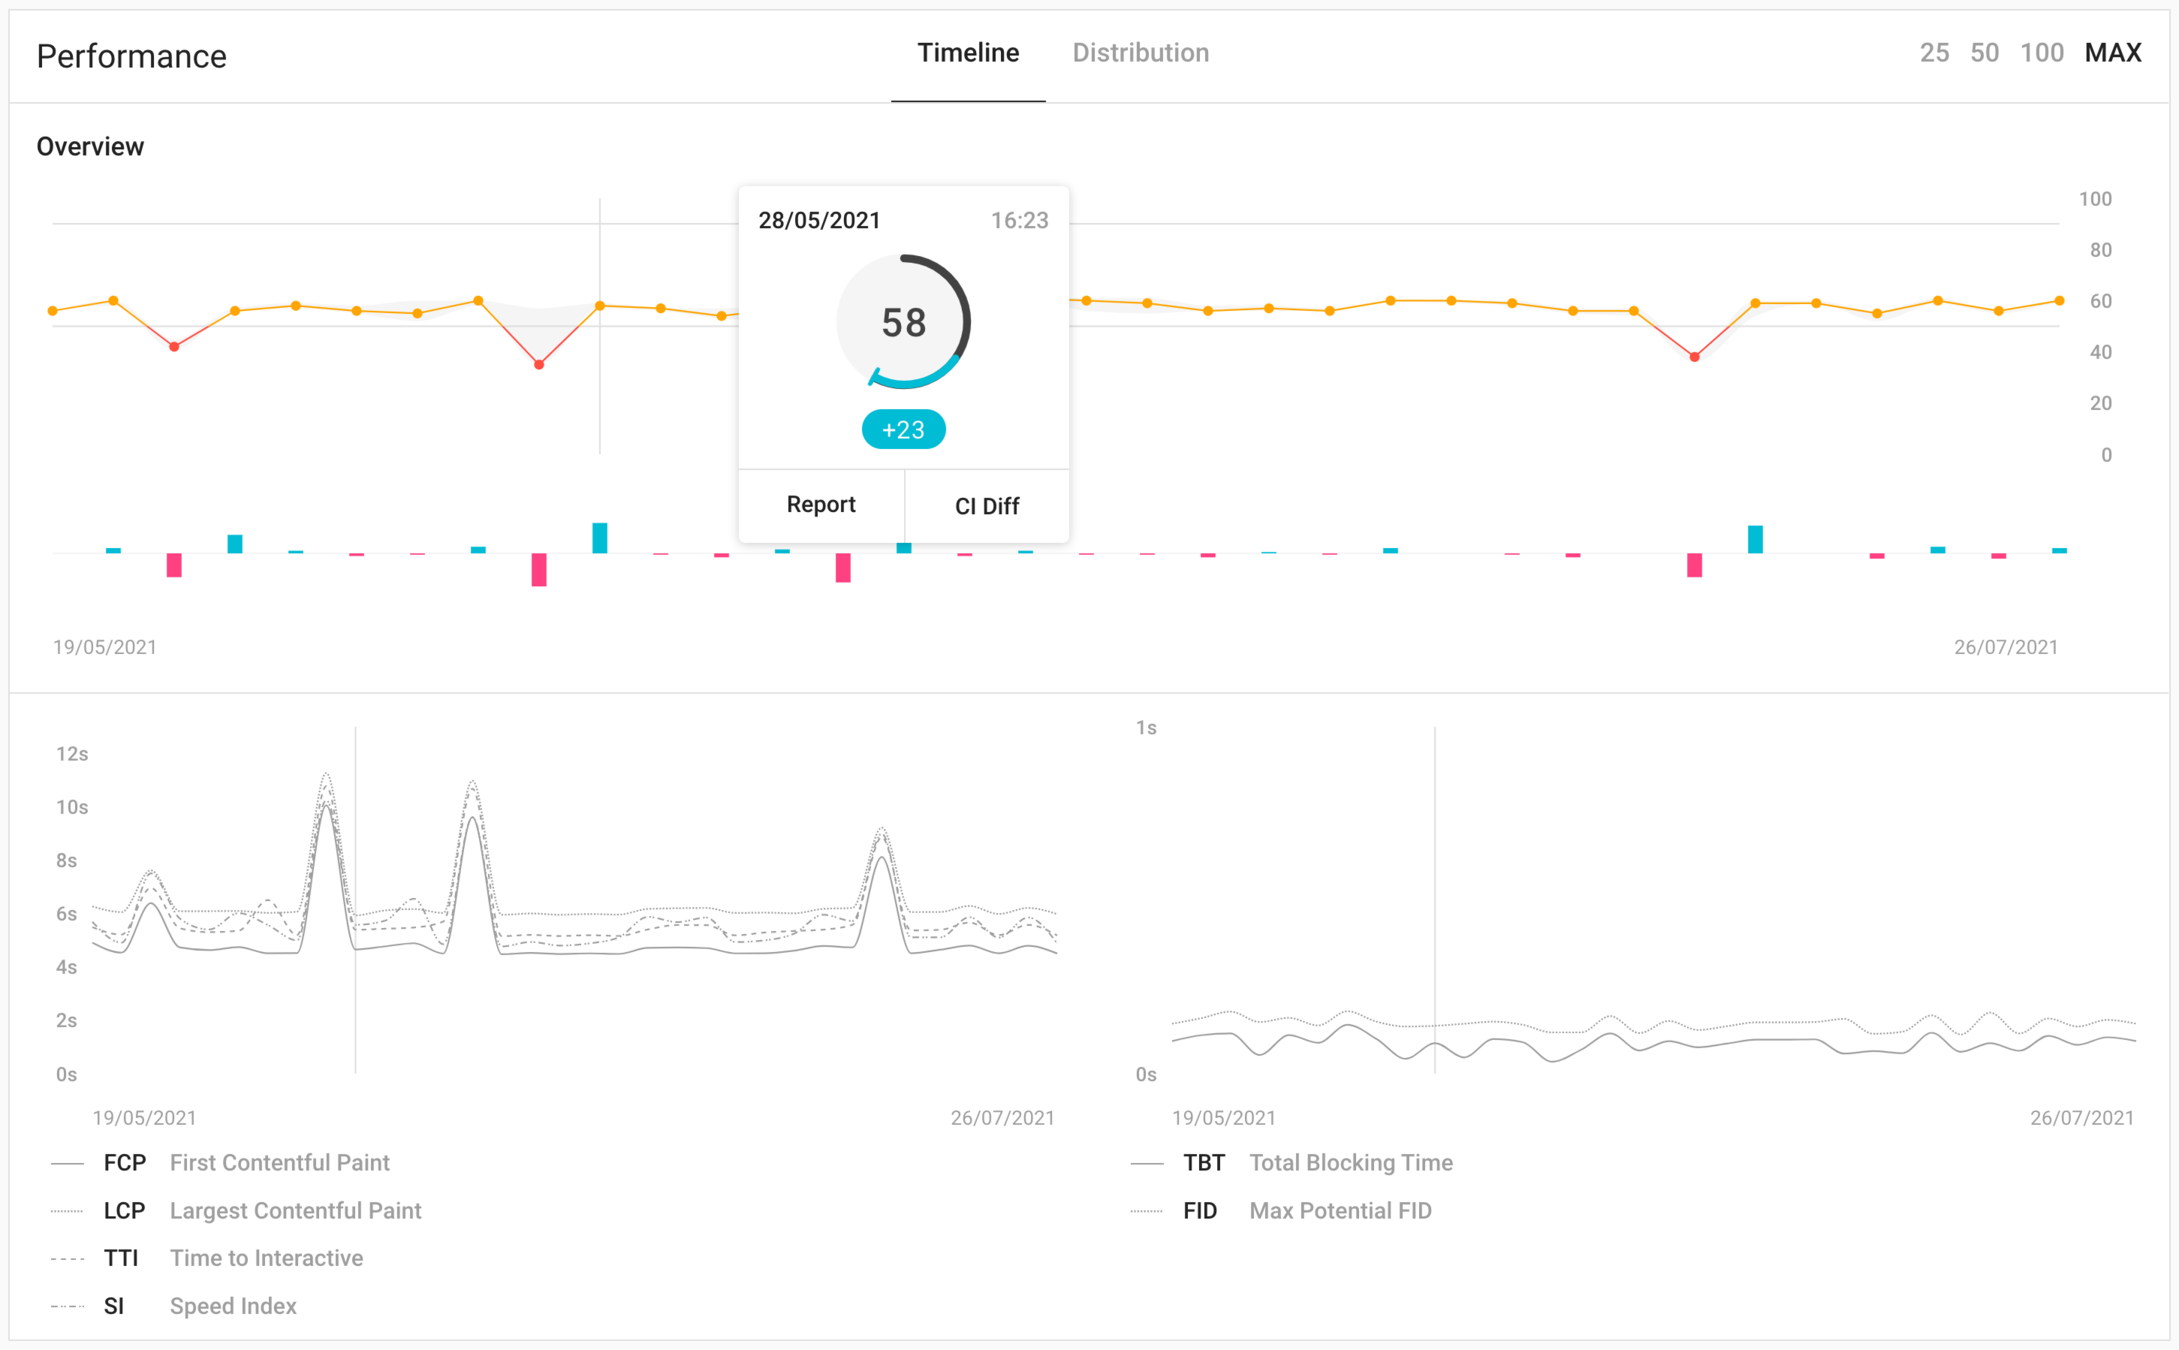
Performance Test Results

from browserstack.com/speedlab
** asterisk
Network Fix - Remove it
Your Internal Network OR
Localhost

CDP

Synthetic User Monitor
"Internet"
Network Fix - Control it
- Inside the browser with CDP access
- Inject CDP Network Profiles
const client = await page.target().createCDPSession();
await client.send('Network.enable');
await client.send('Network.emulateNetworkConditions', {
  # 5% Decrease in Ad revenue
  latency: 500
});
Network Control Pt 2
- Once you're in the browser, you control it all
- Mock Network Responses with API Interception
- Note: Couldn't Replace 10 -> 30 results :(
await page.route('**/*.png', route => {
  route.fulfill({
    body: './bing.png'
  });
});
Browser Variability and Result "Transferability"
- Named Performance Machines?
- Your machine is not the same as mine.
- Or a Jenkins CI Agent shared with some random team in Germany who accidentally forgets to copy artifacts off in a timely manner and constantly leaves processes hung rendering weeks of data useless.
*** asterisk
- "Chrome as a service" and way more than today's demo
- "Interface for Performance Testing"
- Chrome + essentials in a container. Hard.
- Exposes generic CDP endpoint
- Playwright remotely connects via .connectOverCPD() API
- Transferability!
browserless
browserless:
    image: browserless/chrome:latest
    cpus: 2.0
    mem_limit: 4g
github.com/browserless/chrome
Remote CDP
Your Internal Network
connectOverCDP()
emulateNetworkConditions
0 latency
500ms
"3g"
Baselines, Accuracy, and Precision
- Run over run variation
- How do we know if a 10% decrease in a metric in is an application change or... run-over-run variation?
- Controlled as many variables as possible!
- Run a lot. a lot a lot.
- Becomes a data problem.
**** asterisk
Synthetic User Monitoring Challenges (Part Deux)
And lastly, many synthetic monitoring tools lack the context needed to explain why a specific failure happened or what the business implications might be, lengthening time to resolution and making it unnecessarily difficult to prioritize application performance issues."
dynatrace.com/news/blog/what-is-synthetic-monitoring/
***** Asterisk
xk6-browser
- Open Source
- k6 driving playwright APIs
- beta
- supports .connectOverCDP()

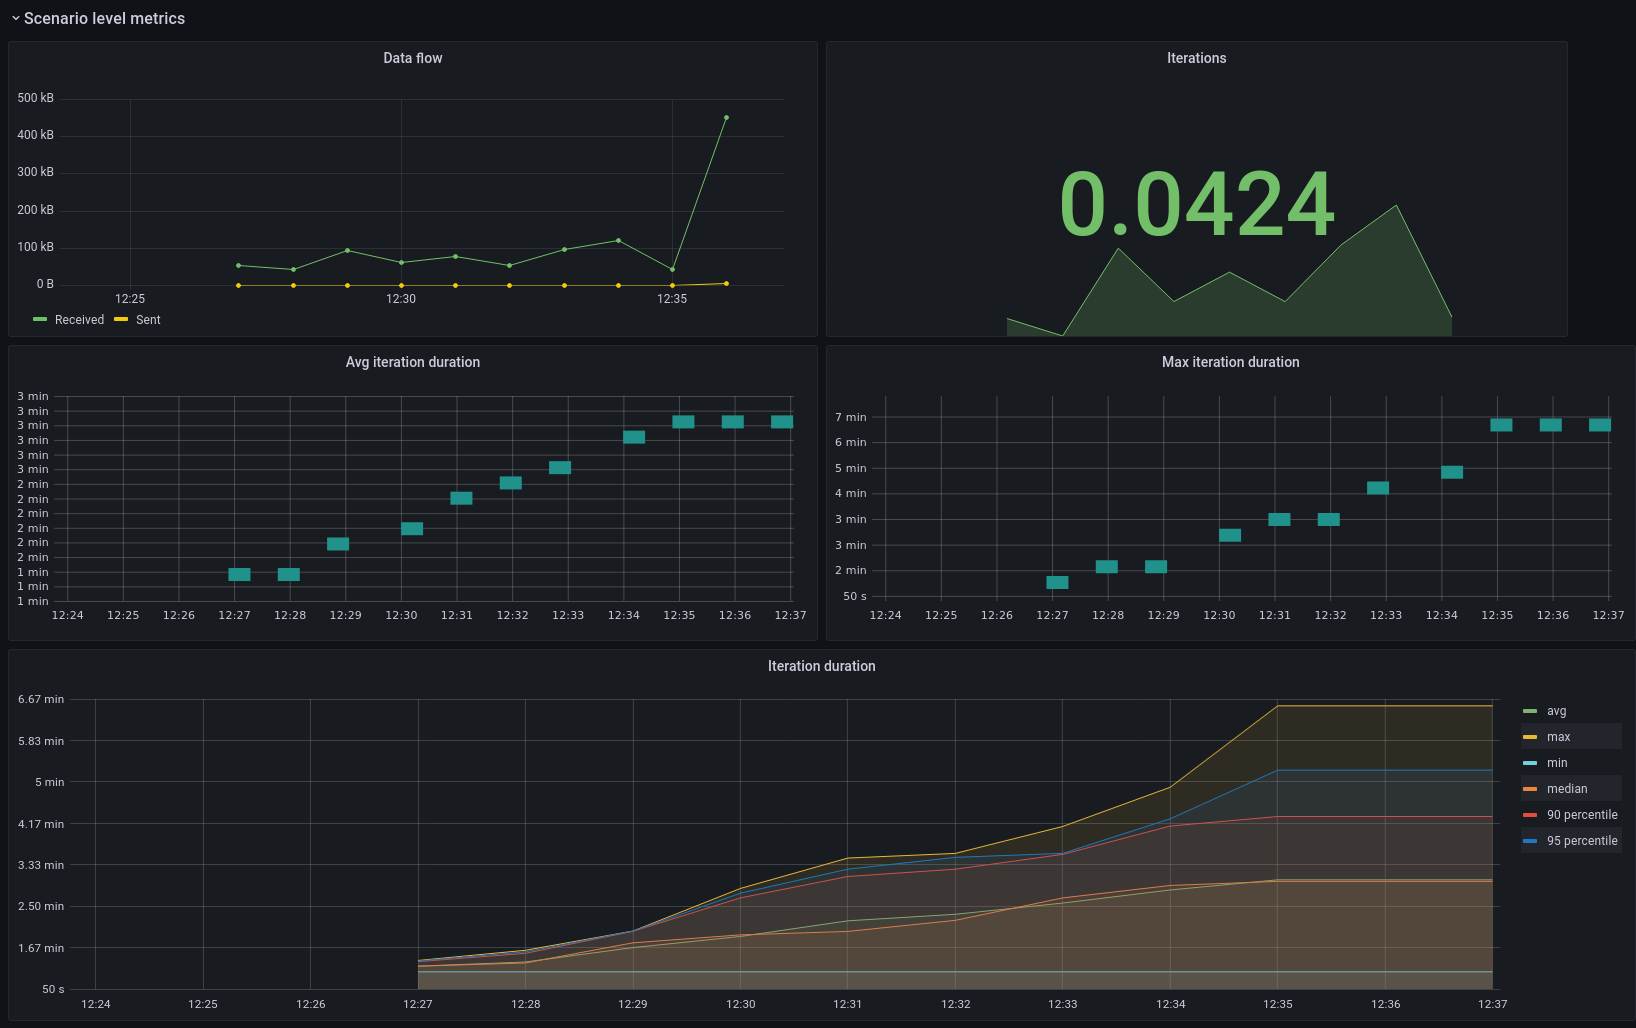
What it solves:
*Generate many, many
measurements!
** Tap into the huge k6 ecosystem to integrate and correlate with System Monitoring, Load Testing, etc
Summary
- Frontend Performance is Mission Critical
- Core Concepts and Performance Continuum
- Automated(?) a Google Search Performance Test
- Tools and Techniques to avoid the Asterisks in Results
What's next?
- Google Chrome Project: Fraggle Rock

Help NASA Open MCT!
- Open e2e Testing Initiative
- Your opportunity to contribute to NASA
- Traditional CLA applies to testers
- It's as easy as it looked!
Contact and Links
openmct
js-perf-toolkit
browserless/chrome
xk6-browser
Cutting Room Floor
Creating a baseline of measurement for transferability
- Let’s get rid of all asterisks associated with our measurment.
- Create a HTML Webpage.
- Test and Time the page.
- Demo
- Run this before every run. Run between version changes. Run this local vs CI.
Summary
- Browser Performance and DevTools
- Load Testing and Perf Problems
- What to Measure
- Browserless
- Driving with Puppeteer
- js-perf-toolkit
Demo
What do we need?
- Stable Interface
- Controlled Environment
Demo
What do we need?
- Stable Interface
- Playwright "bless your own damn build" testing
- sitespeed.io is a better specialized tool
Hard?
- Variability
- We "only" want App-under-test variation
- Network
- CPU
- Chrome
- Test Framework
- Transferability
- CPU/GPU
- QA Team giving us bad builds!
"Hard" Demo
Capabilities Demo
JS-Perf-Toolkit
- github.com/unlikelyzero/js-perf-toolkit
- Moves everything* into containers
- browserless
- influxdb+prometheus+grafana
- Puppeteer/Playwright Examples
- NodeJS->InfluxDB (coming soon)
- xk6-browser*
- Network control with toxiproxy
- Integrates into monitoring systems with InfluxDB and Prometheus*
Why?
- Load Testing is what you do to the backend to approximate Rough Response Time
- HTTP Rest API can provide a rough estimate to User Experiences in the app
Selenium?
- Yes? No? Maybe?
- Variability in results due to waitFor
- Driver? Jmeter+Selenium
- 2 Cores per User!
- CDP in 4.0

How?
(Chrome! Devtools!)
Our first asterisk * !

Load Testing Can't Properly Approximate Frontend Performance Regressions
Chrome
- Loads and renders your web app via static assets, javascript, and APIs
- Web app / javascript
- How well it runs on your machine
- Static Assets
- You can't
- But!
- HTTP 1.1 only allows 6 sequential API responses
- Websockets?
- Graphql queries based on user data?
Network Variability*
- Network is defined by Latency and number of requests necessary to provide User the needed data to present on screen
- Variability in the internet and local machine
Why is *frontend* performance important?
- Amazon found that every 100 milliseconds in load time correlated to 1% decrease in sales.
- Google found that when they increased the search results from 10 to 30, the load time increased by half a second and resulted in a 20% decrease in ad revenues.
- Load time and User Experience
Quick Check-in
- Why performance test
- Load times and lighthouse
- What to look for
- After load and Long Tasks
- RUM, User Timing, and marks
How did Google know the users left?
Google found that when they increased the search results from 10 to 30, the load time increased by half a second and resulted in a 20% decrease in ad revenues."
Real User Monitoring (RUM)
- "Where real users go and what they do"
- Inject js code into application to report back your marketing team
- Session Replay
- Key Takeaway for Performance Testing
-
- User Timing
- Performance.marks()
What happens after the first load?
What happens after the first load?

Performance Testing Without Asterisks*
By John Hill
Performance Testing Without Asterisks*
Front-end performance testing is hard. Really hard. There are hundreds of variables that affect end users’ perceived performance. Only a few are measured with traditional load testing tools. Few can be actively controlled outside of a dedicated test environment, and we lose credibility as soon as our tests leave that environment. Worse yet, the available front-end performance tooling blindly focuses on how quickly a page loads. What happens after the first load? At NASA Ames, our Mission Operators have an 18-hour shift. Then there is automation, none of those tools were designed to be automated like our e2e tests. Adding all this up means that, as performance testers, we’re required to add too many asterisks to our results… until now! In this live demo, we’ll detail the metrics that matter and how to measure them without asterisks. Using Browserless, Playwright, and k6, we’ll instrument and automate a performance test. We’ll have a front-end performance tooling state-of-the-union to outline what’s happening in this space and where we’re going. Lastly, we’ll end with ways to integrate these new tools into your existing CI/CD process and test frameworks.


