Structural Equation Modeling, Part 1
PSY 356
But first: what is SEM?
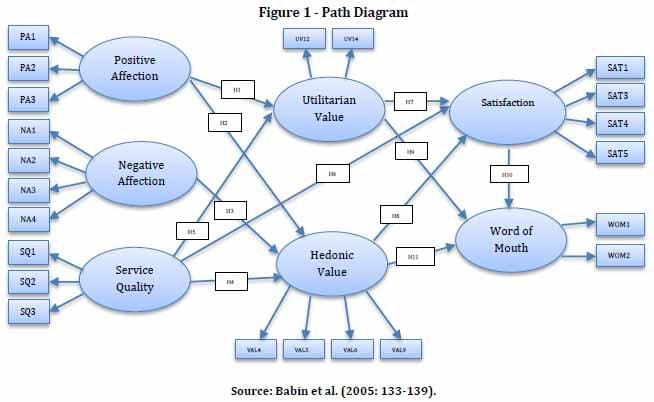
Structural equation modeling (SEM) "can be viewed as a combination of factor analysis and regression or path analysis." (Hox and Bechger, 2011)
...OK, but what are those?
Factor analysis
Factor analysis aims to explain common variance among observed indicators in terms of latent variables. It is often referred to as a measurement model.
Math
Verbal
Arithmetic
Matrix reasoning
Word problems
Analogies
Reading comprehension
Vocabulary
Path analysis
Path analysis aims to find directional paths from one observed variable to another. It is often referred to as a structural model.
Math instruction
Math self-efficacy
Math performance
Attitudes toward school
Structural equation modeling
Structural equation modeling is a general term that refers to any combination of a measurement model and a structural model.
Mediation
Mediation occurs when the effect of one variable on an outcome is transmitted through the effect of an intervening variable.
Math instruction
Math self-efficacy
Math performance
Attitudes toward school
Mediation
Mediation occurs when the effect of one variable on an outcome is transmitted through the effect of an intervening variable.
Math instruction
Math self-efficacy
Math performance
Attitudes toward school
Mediation
Mediation occurs when the effect of one variable on an outcome is transmitted through the effect of an intervening variable.
Math instruction
Math self-efficacy
Math performance
Attitudes toward school
Mediation
Math instruction
Math self-efficacy
Math performance
a
b
c'
- Performance = b0 + b1*Instruction + b2*Self-efficacy + b3*(Instruction*self-efficacy)
- Under this interpretation, we can say: The effect of instruction on performance was stronger for students with high math self-efficacy.
- Or, equivalently: The effect of self-efficacy on performance was stronger for students who had received instruction.
- We cannot statistically distinguish between the above two explanations.
- Contrast this with mediation:
- Instruction predicts higher levels of math self-efficacy, which in turn predicts higher levels of performance.
Moderation
What is the relationship between these variables?
Moderated mediation: Instruction leads to higher math self-efficacy, which in turn leads to higher performance. The effect of instruction on math self-efficacy is stronger among those with more positive attitudes toward school.
Math instruction
Math self-efficacy
Math performance
Attitudes toward school*Math instruction
Attitudes toward school
Preacher, Rucker, and Hayes, 2007
What is the relationship between these variables?
Mediated moderation: The effect of instruction on performance is stronger among those who have more positive attitudes toward school, and this effect is partially transmitted through math self-efficacy.
Math instruction
Math self-efficacy
Math performance
Attitudes toward school*Math instruction
Attitudes toward school
Preacher, Rucker, and Hayes, 2007
Mediation using regression
Instruction
Instruction
Performance
a
c'
c
Self-efficacy
Instruction
Performance
Self-efficacy
b
Mediation using regression
- Baron and Kenny (1986) and Judd and Kenny (1981)
- Test a series of regression models
- Performance = c*Instruction
- Self-efficacy = a*Instruction
- Performance = c'*Instruction + b*Self-efficacy
- If the effect of instruction (i.e., c') is attenuated when self-efficacy is added in, partial mediation
- If it is reduced to zero when self-efficacy is added in, complete mediation
- A better question: is the mediated effect significantly different from zero?
- Performance = c*Instruction
- Self-efficacy = a*Instruction
- Performance = c'*Instruction + b*Self-efficacy
- Mediated effect of performance = a*b
- Is the mediated effect significant?
- In order to find this, we need standard errors
- Sobel (1982) gives Delta method SEs (not recommended)
- Bootstrapping the distribution of a*b
- Monte Carlo simulation
- In order to find this, we need standard errors
Mediation using path analysis
Math instruction
Math self-efficacy
Math performance
a
b
c'
At this point, it is standard practice to fit an SEM, calculate the value of the mediated path (a*b), and test its significance.
Why use SEM?
- Some would say that SEM more closely corresponds to the theoretical mechanism of change than regression.
- ...but when there is just one predictor and one mediator (as in the example we just did) there isn't really a benefit.
- As we'll see in lab, we get the same results
- And the conceptual challenges and caveats are still the same!
- The benefit arises once things become more complicated -- i.e., once we start adding in more variables and paths between them. Then we can test model fit.
Model fit
- How well does our model replicate our data's means and covariances?
- Every model gives us a model-implied covariance matrix and model-implied means.
- The discrepancy between those model-implied values and our actual values indicates how well the model fits.
- The likelihood represents a function of this discrepancy, which gets higher if the model fits better and lower if the model fits worse
Back to our example
Math instruction
Math self-efficacy
Math performance
Attitudes toward school
Back to our example
Math instruction
Math self-efficacy
Math performance
Attitudes toward school
Means
Covariances
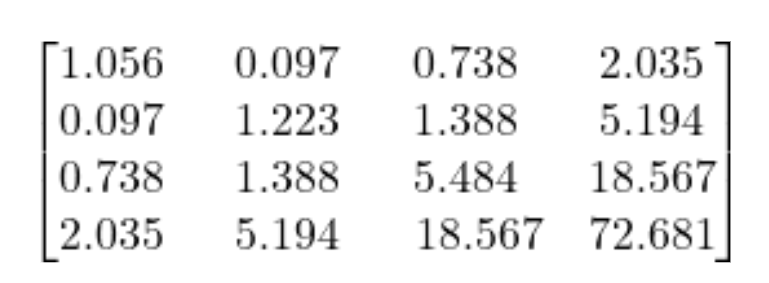
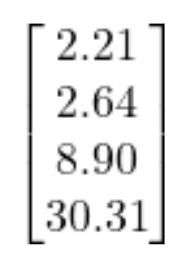
Means and covariances of school attitudes, math instruction, math self-efficacy, and math performance, respectively*
The key question is: how well does our model replicate these means and covariances?
*Note that these are not the actual values. You will see the real values in lab.
Model fit
- The basic premises:
- SEM implies that some set of relationships exists among the variables. This means that some relationships do not exist among the variables - i.e., that we aren't modeling every possible relationship that could exist.
- If we could model every possible relationship among the variables, we could replicate the means and covariances perfectly. We would also require a ton of parameters and the model would not be informative.
- How can we balance the fit of the model against not having too many parameters?
Fit indices
- Fit indices are a function of the likelihood and the number of parameters.
- We start with a \(\chi^2\) distribution.
-
Degrees of freedom are # means, variances, and covariances - # parameters in the model
- Significant test = model does not fit
- The \(\chi^2\) itself is almost always significant. What is interesting are the fit indices we can construct from this statistic.
-
Degrees of freedom are # means, variances, and covariances - # parameters in the model
"Absolute" fit indices
- Root mean squared error of approximation (RMSEA)
- Rule: Values between 0 and 0.08 are OK; below 0.10 are marginal.
- Tucker-Lewis Index (TLI) and Comparative Fit Index (CFI)
- Rule: Values above 0.9 are OK; above .95 is better.
- Squared Root Mean Residual (SRMR)
- Rule: Values below 0.08 are OK.
Honestly, these "rules" are highly subjective and fallible. You should at some point learn how these fit indices are formulated, but today doesn't need to be that day.
Structural Equation Modeling
By Veronica Cole


